Circumnuclear Shock And Starburst In NGC 6240 : Near-IR Imaging And Spectroscopy With Adaptive Optics
Abstract
We have obtained adaptive optics, high spatial resolution (0.15 arcsecond) K-band spectra and images of the region around the two active nuclei in NGC 6240 which show the presence of circumnuclear shocks. The data are consistent with the thermal excitation mechanism being the dominant one in the nuclear region. UV fluorescence and associative detachment may also contribute to the fraction of the energy emitted through molecular hydrogen transitions. The near-IR continuum emission appears closely associated with the two active nuclei. The morphological similarities between the near-IR images and the Chandra X-ray images indicate the same mechanisms may be responsible for the emission in near-IR and X-ray band.
1 Introduction
1.1 NGC 6240
NGC 6240 is one of the best studied composite galaxies, hosting a luminous starburst and two active galactic nuclei (AGNs) obscured by gas and dust. With a bolometric luminosity of (Rieke et al., 1985), emitted predominantly in the infrared, this galaxy is a borderline case of the ultra-luminous infrared galaxies (ULIRGs, ). Moreover, NGC 6240 has the largest known near-infrared molecular hydrogen line luminosity, (Draine & Woods, 1990). Many of the ULIRGs are objects with a large amount of molecular hydrogen gas. Their extraordinary infrared luminosity originates either in a powerful starburst or in a gas embedded AGN; NGC 6240 is an object with clear signatures of both.
We observed the two distinct nuclei at high angular resolution with adaptive optics. Both, the northern and southern nucleus (hereafter the N nucleus and the S nucleus respectively) are surrounded by bright gas components. The S nucleus shows strong nuclear activity and has been suggested to be the source of the AGN hard X-ray component (Iwasawa & Comastri, 1998; Vignati et al., 1999; Ikebe et al., 2000). Being embedded in the gas, dust, and powerful starburst, the AGN is not directly observable at energies lower than keV. Recent Chandra ACIS data (Komossa et al., 2002) reveal two active nuclei in hard X-ray emission, coincident with the optical and IR nuclei of NGC 6240.
NGC 6240 was observed in the near-infrared by many authors in the past, Joseph, Wright & Wade (1984); Rieke et al. (1985); Lester, Harvey, & Carr (1988); Elston & Maloney (1990); Herbst et al. (1990); Van der Werf et al. (1993); Lester & Gafney (1994); Lançon, Rocca-Volmerange, & Thuan (1996); Oliva et al. (1999); Ohyama et al. (2000); Scoville et al. (2000); Tecza et al. (2000), with the latest works setting the quality and resolution criteria for near-IR spectroscopy and imaging of this object. An important goal of the past 20 years of study of this galaxy has been to determine and explain the dominant emission mechanism. This objective has been difficult to meet because both very accurate line ratios and spatial information about the emission lines are needed to draw firm conclusions. In the next section we review some of the proposed excitation mechanisms.
1.2 Proposed Excitation Mechanisms
There are four excitation mechanisms proposed by different authors to explain the dominant source of energy emitted in the near-infrared from the nuclear region of NGC 6240.
Thermal emission driven by collisional excitation (Sugai et al., 1997; Lester, Harvey, & Carr, 1988; Ohyama et al., 2000). This type of excitation arises from the collision of molecules with other hydrogen molecules, atoms, and energetic electrons. NGC 6240 is a merger galaxy and the presence of shocks is expected both as a consequence of tidal effects and starburst driven superwinds.
Ultraviolet fluorescence (Tanaka, Hasegawa, & Gatley, 1991). This mechanism is expected to arise in galaxies hosting a young starburst population of supergiant stars. Starburst galaxies typically have a large amount of gas that responds to the UV radiation. The gas shows a characteristic disrupted morphology and strong infrared emission.
X-ray heating by the central source and supernovae (Draine & Woods, 1990). NGC 6240 is known to have two hard X-ray nuclei embedded in gas (Komossa et al., 2002). The central, high-temperature source ionizes the gas in its vicinity and creates high energy electrons. These further participate in collisions with and . Since the column density of the gas in the nuclear region of NGC 6240 is high (; Komossa et al. 2002), X-ray emission is expected to be mostly thermalized and re-emitted in the IR continuum. Alternatively X-rays can be produced by supernovae and high-velocity cloud-cloud collisions. The emission from this mechanism depends on the power of the source and column density of the gas.
A formation pumping mechanism, driven by dissociative shocks (Mouri & Taniguchi, 1995). Fast, dissociative shocks passing through the molecular gas leave behind atoms and ions that recombine into excited and give rise to formation pumping. This process is also called associative detachment.
Our observations allow further investigation into which mechanisms contribute the dominant fraction of energy radiated in near-IR. In we describe the observations and data reduction procedures applied to the spectra and images. In we present the results; in we discuss their implications and give concluding remarks in .
2 Observation and Data Reduction
In June 2000 and August 2001 we obtained high spatial resolution ( arcsecond) near-IR images and spectra of NGC 6240 with the Lick 3 meter telescope and the natural guide star adaptive optics system (Gavel et al., 2000). The observations were carried out with the PICNIC IR array IRCAL camera (Lloyd et al., 2000). The plate scale was 75.60.2 milliarcsec per pixel with a total field of view of 19.4 arcsec. For our spectroscopic observations we used a CaF2-grism (Ge et al., 2003), which covered a wavelength band , with a wedge angle of 30.95 degrees. One pixel corresponded to approximately 19.5Å along the dispersion direction. The spectral resolution achieved was about , or R==400. The total on-source spectroscopic exposure time was 6900 seconds (23 exposures, 300 seconds integration each) (Table 1) and 4465 seconds total for imaging (Table 2).
2.1 Spectra of the NGC 6240 Nuclear Region
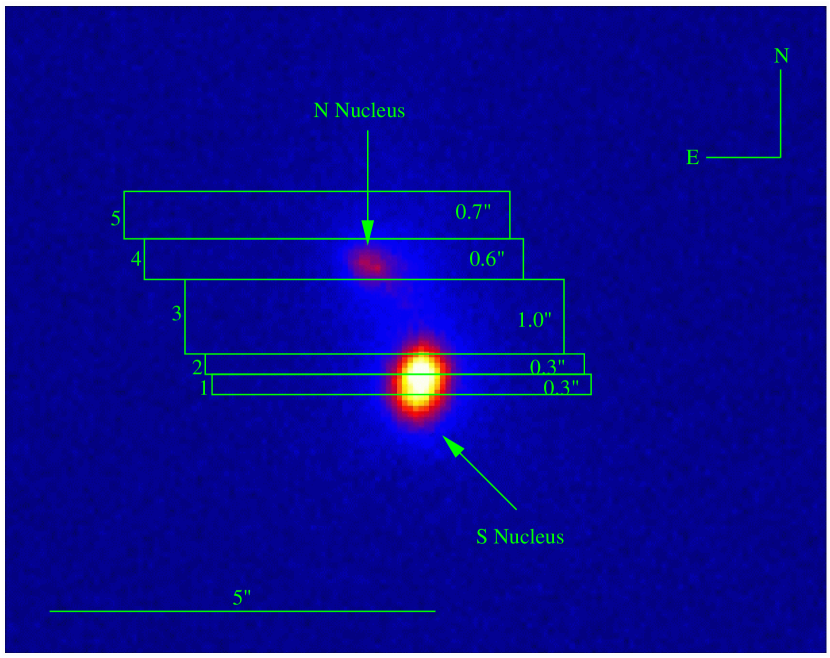
The angular separation of the two galactic nuclei measured in the H and K bands is about 1.8 arcsec (Lira et al., 2002). The slit was initially positioned on the center of the S nucleus, the brighter one, and then progressively shifted towards the N nucleus. The instrumental slit width of 0.15 arcseconds and slit positioning allowed us to obtain coverage of the nuclei and the region between them. Spatially close frames, with similar spectral features were then combined in order to obtain higher signal to noise ratios for the five resulting spectral frames. The regions on the sky associated with every combined spectral frame are boxes of approximate sizes 0.35.0, 0.35.0, 1.05.0, 0.65.0 and 0.75.0 arcseconds, positioned from the S towards N nucleus, respectively. The area of each box is defined by the slit widths (which depends on how many spectra are combined for particular frame) and slit length of 5 arcseconds. The scheme of positions of the boxes on the sky, associated with the five spectral frames, is shown in Figure 1.
Data reduction was performed using the IRAF software package. The sky frames, obtained right after the target exposure, were subtracted from all object frames. The data were flat fielded using dome flat lamp exposures, obtained at the end of each observation. For the spectral calibration we used a neon lamp, which has enough strong emission lines in the wavelength interval of interest to allow calibration. The flux units are arbitrary, as common for spectra obtained with adaptive optics system, where absolute flux values are uncertain. Later (Section 3.4) we base our analysis on relative line intensities. For this purpose we fit every line with a Gaussian and calculate its equivalent width. The equivalent width of a line sensitively depends on the adopted continuum level. We estimate the continuum level in the vicinity of each emission line. This helps us to minimize the error caused by the noise in the continuum not captured by the continuum fitting.
The atmospheric absorption correction was carried out with the A0 V star HD 203856, observed on the same night as the object, by dividing the target spectra by the A0 V star spectrum. The Br absorption region in the spectrum of the star was approximated with a Gaussian and then removed.
We estimate the error for the calculated line ratios, from the error contribution for both lines. The uncertainty in the measurement of relative intensity of a single line is contributed by the finite signal to noise ratio and finite resolution.
2.2 Images of NGC 6240 Nuclear Region
We obtained three sets of images: with the band filter, and and narrow band filters, with exposure times of 60, 1722 and 2633 seconds, respectively (Table 2). The Ks filter has a central wavelength of =2.150, and full width half maximum (FWHM) of 0.320. The and filters have central wavelengths of =2.125 and =2.167, respectively, and FWHM of 0.020. The latter two filters have approximately the same transmission, close to 80 per cent.
Due to the redshift of the object (Vsys=7339; Downes, Solomon & Radford 1993) the filter samples the continuum emission and the Br filter samples the redshifted molecular hydrogen emission line as well as the underlying continuum. The v= emission line, observed at a =2.1243 object frame, may contaminate the continuum emission observed with the filter. However, the expected contamination effect should be small, since the line intensity of this transition in NGC 6240 is very weak (Ohyama et al. 2000; see Section 3.4). The sky was subtracted from every object frame. The twilight flats taken at the beginning of the evening were used for the flat fielding of object frames.
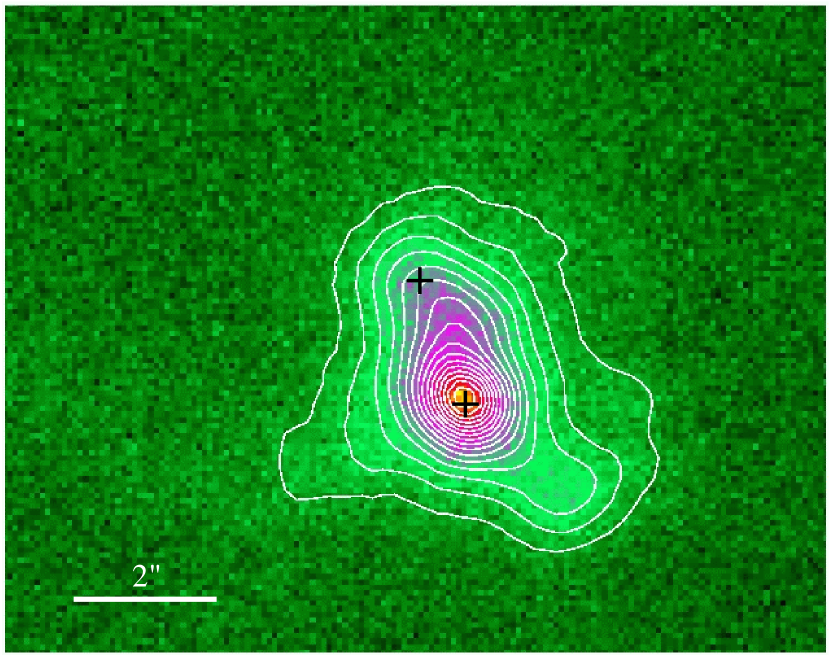
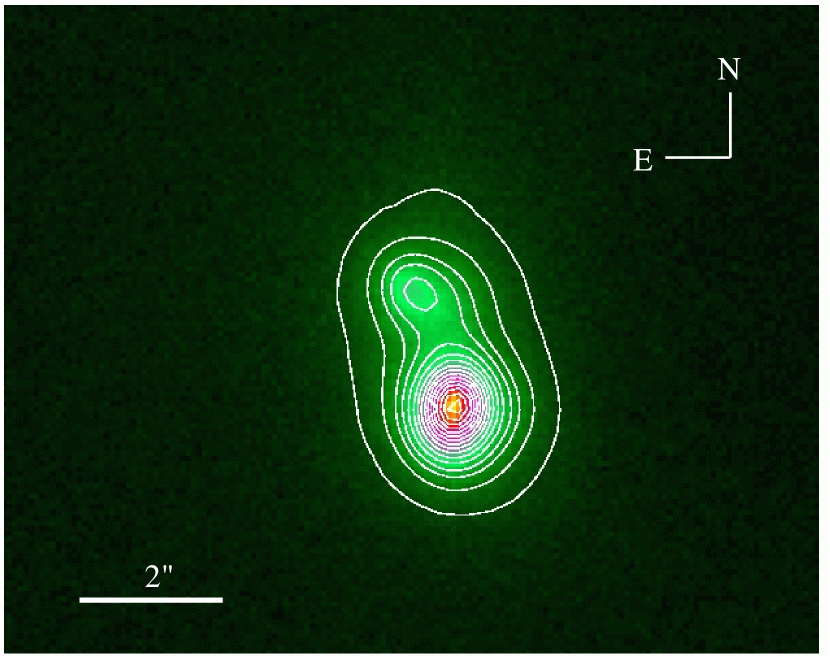
We used Keck NIRSPEC and NIRC2 spectra, with spectral resolution R=2000 and 0.4 arcsecond slit, taken by one of us (C.Max) as an independent check of relative brightness scale for images obtained with the two narrowband filters. The emission line was resolved in each of two spectra. Both spectra showed that the peak brightness of the S nucleus is about a factor of 1.3 higher in the Br filter bandpass (comprised of line plus continuum emission) than in the filter bandpass (contributed by the continuum emission). The scaling factor confidence is about 3. We rescaled the band image in order to make its peak brightness at the Southern nucleus equal to 1/1.3 times that seen in Br, and then subtracted the rescaled image from the Br image. As a result we obtained an image that emphasizes the molecular emission region (Fig 2a). The images show a region about arcseconds (kpc) in size. The images are overlaid with a linear isocontour in order to highlight the morphology of the nuclear region. In Fig 2a we also mark the locations of the N and S nuclei as seen in the near-IR continuum image in Fig 2b.
3 Results
3.1 Ks Broad Band Image and Narrow Band Images
Figure 1 shows the Ks-band image, obtained with the Ks broad band filter, transparent to near-IR photons in a wavelength range of 1.992.31. The flux in this wavelength range is contributed by the emission from the continuum and molecular hydrogen lines. Our Ks-band image closely resembles to the high resolution images reported by Scoville et al. (2000), taken in the 1.1 and 2.2 rest frame. Two compact nuclei are easily distinguished on the image. Also noticeable is the faint, extended emission around the nuclei.
The narrow band images (Figure 2) allow to observe the continuum emission and emission from molecular lines separately. They show that what is seen as emission from the continuum is consistent with the emission coming from the active nuclei, while molecular line emission is coming from the surrounding gas component.
The narrow band image in the 2.12 rest frame (hereafter only) transition (Fig 2a) reveals diffuse emission of a gas component. Tacconi et al. (1999) presented the detailed study of the gas dynamics in the nuclear region, traced in the CO millimetar emission. The CO emission maps revealed the existence of a large concentration of molecular gas (2-4), in between the two nuclei, confined to a geometrically and optically thick disk, where the dust in the disk efficiently shields the emission from the molecular hydrogen gas. The emission seen in our images then probably originates from the parts of nuclear region outside the circumnuclear disk, and from the orders of magnitude less mass of molecular hydrogen than in the disk.
The diffuse emission region extends to pc east and west from the long axis of the system connecting the two nuclei. The strongest emission is observed at the position of the S nucleus and between the two nuclei. The peak of the emission at the S nucleus appears about 0.3 arcseconds displaced from the center of the nucleus (as determined from the near-IR continuum image, Fig 2b) towards the north-eastern rim of the S nucleus. This is consistent with the previous detections of the emission in the region between the two nuclei (Herbst et al., 1990; Van der Werf et al., 1993; Sugai et al., 1997; Tecza et al., 2000) and implies that emission from this gas component is probably not powered by the X-rays coming from the nuclei, but rather by the circumnuclear shocks. A gaseous blob seen in molecular hydrogen emission, located at the 1kpc distance, south-west to the S nucleus, coincides with the blob emission as seen in the X-ray contour image (Figs 2a and 3). The size of the blob is about 700 pc. The same region is not seen in the continuum emission which appears associated with the nuclear activity (Fig 2b). This indicates that emission of the gaseous blob may be driven by the local starburst activity, nested inside this region. The N nucleus exhibits low brightness in the molecular transition, while it is distinct on the continuum image. We conclude that the N nucleus is a more quiescent one with a lower rate of starburst and shock waves.
We compare our near-IR images to the H images of the nuclear region in Lira et al. (2002) and Zezas, Fabbiano, & Prestwich (2001). We find that the general geometries of the extended emission in these two images do not resemble each other. Near-IR images show more centralized emission on the scale of 3-4 arcseconds. The only example of very faint filamentary structure seen in the near-IR image is stretching south-east to the nuclear region. The filament is not observed in the continuum emission nor the X-ray contour image. Near-IR emission is thus spatially more associated with the nuclear activity and the circumnuclear starburst than with the larger scale outflows and superwinds as further shown in the X-ray contour image (Fig 3). The hourglass symmetry of the region (Heckman, Armus, & Miley, 1990) and the cone-like outflows (Lira et al., 2002), typical of superwinds, and seen in H images, can not be uniquely identified on the image.
Both nuclei appear brighter and more distinct in the near-IR emission than visible H emission since the near-IR line is less affected by extinction. The extinction toward the nuclei, estimated from IR observations (Tecza et al., 2000), is found to be mag and mag. The extinction toward the extended emission, estimated from optical observations (Thronson et al., 1990), is mag.
From the comparison with the recent Chandra ACIS-S images (Komossa et al., 2002) we notice that the morphology of the near-IR continuum image (Fig 2b) corresponds closely to that of the hardband (6.0-6.7 keV) X-ray image of the same region, showing 4 arcsecond scale nuclear emission. The near-IR 1-0 S(1) image (Fig 2a) corresponds in scale and morphology to an ACIS-S intermediate energy band image (1.5-2.5 keV), showing more diffuse emission around the nuclear region. Finally the morphology of the ACIS-S soft energy band image (0.5-1.5 keV) does not correspond to any of near-IR images but matches well the H HST image (Lira et al., 2002) in both, scale ( arcsec) and morphology. The morphological analogies between X-ray and near-IR band suggest that the same mechanisms may be responsible for the emission unless the structure is significantly under-resolved in one of the bands.
3.2 X-ray Contours
Figure 3 is an X-ray logarithmic isocontour of the same region observed with Chandra HRC in the energy range of 0.0810 keV. The image shows the X-ray emission on the scale of arcseconds. The central region, marked in the dashed line as a smaller box ( arcseconds), also shown in Figure 2, is a part of a larger scale structure which is presented here for clarity.
The contour plot is made in the logarithmic scale to emphasize the faint, extended emission dominated by the nuclear emission. The rich gaseous structure seen in the X-ray contours matches well the size and morphology of the structure seen in the emission images (Zezas, Fabbiano, & Prestwich, 2001; Lira et al., 2002).
X-ray contours show both nuclei in emission. The nuclei are in the north-south orientation with a positional angle of degrees and an angular separation of 1.4 arcseconds. Also marked on the X-ray contour image are locations of the nuclei as observed in near-IR continuum. The near-IR angular separation of nuclei measured is 1.8 arcseconds. The cone-like outflows and filaments expanding into the surrounding medium are noticeable to the west of the nuclear region (as marked with arrows in Figure 3). Visible in the X-ray, these are likely to be superwinds capable of heating the medium and initiating a new sequence of starburst. The emission to the east of the nuclear region is more extended but appears to have less filamentary structure.
3.3 Observed Spectral Features
All of our IRCAL frames show a prominent molecular hydrogen line (Fig 4). This line is formed as a forbidden quadrupole transition at . It can be excited collisionally at temperatures larger than K or radiatively by UV resonant fluorescence.
CO(2-0) absorption, noticeable for all slit positions, is characteristic of late spectral type (K and M) giants and supergiants. The typical age of these stars is about years. This is consistent with a starburst initiated about ago, around both nuclei and in the middle region, most likely as a consequence of tidal interaction (Tecza et al., 2000; Ohyama et al., 2000). Today, these evolved stars contribute a significant amount of radiation to the infrared. Due to the finite spectral resolution we are only able to place an upper limit on the velocity dispersion, , and we do not observe a significant change in the CO(2-0) absorption width towards the N nucleus. Tecza et al. (2000) measure and for N and S nucleus, respectively, with a spectral resolution of R=2000 and a spatial resolution of 1 arcsecond. After correction for inclination of the nuclei, they find dynamical masses of N and S nuclei to be about and , respectively. These values imply that we are witnessing a merger of the nuclei with very massive bulges.
We also observe , and transitions (Table 3). The relative intensities of these lines are in general determined by thermal mechanisms and ultraviolet fluorescence. Excitation by ultraviolet fluorescence is expected to result in larger populations in vibrational levels with than for collisional excitation in molecular shocks. In the regions where is excited both by collisions at high temperatures () and UV sources, lines in the region will be dominated by collisional excitation. As calculated by Black & van Dishoeck (1987), the amount of necessary to produce a certain line intensity at by thermal excitation is an order of magnitude less than that required by UV excitation. However, the intensities of lines in transitions are sensitive to UV so they are enhanced by factors of 3 by UV fluorescence and the excitation effects are considerably larger. This implies that detection of the radiatively excited transitions is difficult but not impossible.
The emission associated with associative detachment mechanism is characteristic for vibration levels and high rotational levels. The latter allows this mechanism to be discriminated from two other competing processes: collisional and fluorescent emission. In high density regions, molecules are de-excited collisionally which then leads to thermalization of the molecular population at low rotational levels. In that case associative detachment lines are suppressed and it is hard to distinguish it from the other two mechanisms. Formation pumping depends strongly on the properties of the gas and the , reaction cross section. These are not well constrained and the contribution of this mechanism is hard to estimate (Mouri & Taniguchi, 1995).
3.4 Line Ratios: Comparison of Observations with Model Predictions
We calculate line ratios for detected molecular transitions and list them in Table 4. The flux units in the shown spectra are arbitrary. Consequently the intensities of observed emission lines are expressed relative to the strongest transition , which has an assumed intensity of 1.0. Therefore the values for line ratios listed in Table 4 are identical with relative line intensities. Line ratios for transitions detected with less then 3 confidence are put as upper limits. This is always determined by the detection confidence of the weaker line, since the transition is always detected with confidence higher than 3.
Line ratios measured at box locations 1, 2, 3, 4, and 5 (see Table 1), are compared against model-predicted line ratios, calculated for cases of pure fluorescent excitation and pure thermal excitation (Black & van Dishoeck, 1987) and “mixture” cases: mixture of associative detachment plus fluorescent excitation and thermal plus fluorescent excitation for two different UV field strengths (Black, Porter, & Dalgarno, 1981).
The first model is purely fluorescent (also refered to as UV pumping) and calculated line ratios are functions of total density , temperature T, incident UV flux and visual extinction . The model-predicted values do not constrain physical parameters for the nuclear region of NGC 6240 but indicate the observable trend in line ratios. In the case of fluorescent excitation as the dominant excitation mechanism, line ratios typically have higher values, close to 0.50. The second model is calculated for purely thermal excitation at 2000K and has typically lower values of line ratios with respect to fluorescence model.
The third and fourth model indicate combined effects of associative detachment and fluorescent excitation for the gas illuminated by blackbody radiation for blackbody temperatures of 1000K and 5000K. The line ratio predictions in the =1-0 band for these two models are close to the values predicted by the thermal model. Unless the =1-0 band ratios are measured with great precision the only sure discriminant is the =2-1 band.
Models five and six predict line ratios from collisional and fluorescent excitation of a gas illuminated by radiation from a T=1000K and 5000K blackbodies. The rate of radiative excitation versus collisional excitation by electrons is the same for both models. The values of the line ratios exhibit degeneracy with other models, except for the ratio. Model-predicted line ratios for are not available.
We find that all the measured line ratios are consistent with purely thermal excitation or mixture of thermal and fluorescent excitation. Some of the ratio values, within the error bars, could be consistent with associative detachment+fluorescence mechanism. The purely fluorescent model can be eliminated based on this set of ratios, since there is only one ratio that marginally supports it.
The values for the line ratios and , show the same consistency with the purely thermal or thermal+fluorescence models, and few of them with the associative detachment+fluorescence model. The purely fluorescent model is not favored scenario based the values of line ratios.
The Br emission line, a tracer of young stellar population, is not seen in our near-IR spectra. Br has been observed by other authors as a very weak transition with the intensity of about 0.07 relative to the intensity of the 1-0 S(1) transition (Sugai et al., 1997; Ohyama et al., 2000). Similarly, we do not detect and transitions in our spectra (not listed in Table 4) but they were detected by Sugai et al. (1997) and Ohyama et al. (2000) with relative intensities of 0.03 and 0.08, respectively. The fluorescence model-predicted ratios for these transitions are for and for . The T=2000K thermal model predicts and ratios, respectively (Black & van Dishoeck, 1987). The measured line ratios are therefore closely consistent with the predicted values for this thermal model and exclude the possibility for significant contribution from the X-ray heating, which would result in weaker relative intensities of these lines (Sugai et al., 1997).
The line ratios are a necessary tool to determine the nature of the emission mechanism. In the case of NGC 6240 line ratios imply that the whole nuclear region is excited thermally while there may be some contribution from the radiative excitation mechanism. However the line ratios do not necessarily discriminate among the excitation progenitors. For example, thermally excited transitions can be powered by heating from red giant stars or circumnuclear shocks but also by high energy electrons, created by ionization from the central X-ray source. On the other hand, fluorescent radiatively powered transitions are characteristic of young stellar populations only. For measured column density (Komossa et al., 2002) high energy photons emitted from the central source are expected to be mostly thermalized, so they do not participate in radiative excitation in the near-IR band. By the same argument all radiative transitions are likely to come from smaller optical depths. Otherwise, they are obscured by gas and dust and thermalized during radiative transfer.
4 Discussion
We notice the following similarities in the apparent morphology of the nuclear region as seen in different spectral bands; near-IR, X-ray observed by Komossa et al. (2002) and optical observed by Lira et al. (2002): a) The near-IR continuum image corresponds to the 6.0-6.7 keV band, Chandra X-ray image; b) The near-IR 1-0S(1) image corresponds to the 1.5-2.5 keV band Chandra image; while c) the Chandra 0.5-1.5 keV image matches well the HST H image. This correlation indicates that the same mechanism may be responsible for the emission in bands with apparent morphological similarities.
The near-IR continuum emission and hard band 6.0-6.7 keV X-ray emission can be associated with the compact emission from the two nuclei. The hard X-ray nuclei ionize the surrounding gas and create high energy electrons which further participate in collisions with hydrogen atoms and molecules.
The diffuse 1-0 S(1) molecular emission, as well as the intermediate X-ray energy band emission, are associated with the circumnuclear region. The near-IR line ratios indicate that the 1-0 S(1) transition in this region is predominantly excited by a thermal mechanism. Circumnuclear shocks are thought to be carriers of thermal excitation. The shocked component probably originates from the volume different than the volume occupied by the thick gaseous disk, from which stars are forming (Tacconi et al., 1999). In parts of nuclear region, a mixture of thermal and fluorescent excitation may also take place, the latter tracing the presence of young stellar population capable of UV heating. UV fluorescence is expected to originate at smaller optical depths and therefore trace the star formation only at a certain physical depth in the nuclear region, meaning that the young stellar population could potentially be larger than observed from radiatively excited transitions.
Based on the line ratio analysis, certain contributions from the associative detachment can not be excluded. Furthermore, associative detachment is expected in regions where fast shocks pass through the molecular gas. Fast shocks that contribute their energy to near-IR, through molecular emission, are also likely to contribute to X-ray emission, which is observed in Chandra ACIS-S intermediate X-ray energy band.
Optical H emission is observed on the angular scale of 20 arcseconds, much larger than 3-4 arcsecond scale of near-IR molecular line emission. Morphologically similar to soft X-ray band emission, the H emission is likely to be associated with large scale outflows and superwinds.
The morphological comparison of the nuclear region as seen in different energy bands is valid under the assumption that dominant features in the nuclear region are resolved in all of the bands. This can be questioned if the longer imaging integration would reveal significantly different scale and features in the nuclear region, from those in images we refer to.
In the whole nuclear region we also detect the presence of an aged starburst population, initiated yr ago probably as a consequence of tidal interaction of two nuclei (Lester & Gafney, 1994). These are mostly found to be late type supergiants that contribute all of the CO absorption and a fraction of thermally induced emission to band transitions.
5 Conclusions
In this work we base our conclusions on high spatial resolution near-IR imaging and spectroscopy and available X-ray imaging. NGC 6240 is revealed as a luminous galaxy with multiple components in emission. We find that near-IR luminosity emitted from the nuclear region of NGC 6240 is spatially associated with the central kiloparsec (3-4 arcsecond scale). We observe both nuclei in emission with the S nucleus being the more prominent. We also observe the diffuse emission from the gas component distributed around and between the nuclei.
The values of measured line ratios in near-IR are consistent with thermal excitation as the dominant excitation mechanism. Thermal emission can be driven by collisional excitation in small scale circumnuclear shocks and also contributed by late type, giant and supergiant stars. A smaller fraction of energy can be contributed radiatively, through UV fluorescence and comes from young stellar population. The associative detachment emission mechanism can not be excluded based on our data. This mechanism is likely to contribute to near-IR emission, since it is typically triggered in molecular regions with presence of fast shocks. The X-ray radiation emitted by the two active nuclei under 10 keV is scattered and thermalized. Its contribution to near-IR band is the most noticeable in continuum emission, associated with the N and S nuclei. Near-IR data, compared to X-ray and optical data available, indicate that thermal excitation is the dominant mechanism but not the only one.
References
- Black & van Dishoeck (1987) Black, J.H. & van Dishoeck, E.F. 1987, ApJ, 322, 412
- Black, Porter, & Dalgarno (1981) Black, J.H., Porter, A., & Dalgarno, A. 1981, ApJ, 249, 138
- Downes, Solomon, & Radford (1993) Downes, D., Solomon, P.M., & Radford, S.J.E. 1993, ApJ, 414L, 13
- Draine & Woods (1990) Draine, B.T. & Woods, D.T. 1990, ApJ, 363, 464
- Elston & Maloney (1990) Elston, R. & Maloney, P. 1990, ApJ, 357, 91
- Gavel et al. (2000) Gavel, D.T., Olivier, S.S., Max, C.E., Macintosh, B.A., & Bauman, B.J. 2000, Proc. S.P.I.E., 4007,63
- Ge et al. (2003) Ge, J. et al. 2003, ApJ Letters, submitted
- Heckman, Armus, & Miley (1990) Heckman, T.M., Armus, L., & Miley, G.K. 1990, ApJ, 74, 833
- Herbst et al. (1990) Herbst, T.M., Graham, J.R., Tsutsui, K., Beckwith, S., Matthews, K. & Soifer, B.T. 1990, AJ, 99, 1773
- Ikebe et al. (2000) Ikebe, Y., Leighly, K., Tanaka, Y., Nakagawa, T., Terashima, Y., & Komossa, S. 2000, MNRAS, 316, 433
- Iwasawa & Comastri (1998) Iwasawa, K. & Comastri, A. 1998, MNRAS, 297, 1219
- Joseph, Wright & Wade (1984) Joseph, R.D., Wright, G.S., & Wade, R. 1984, Nature, 311,132
- Komossa et al. (2002) Komossa, S., Burwitz, V., Hasinger, G., Predehl, P., Kaastra, J.S., & Ikebe, Y. 2002, ApJ, 582L, 15
- Lançon, Rocca-Volmerange, & Thuan (1996) Lançon, A., Rocca-Volmerange, B., & Thuan, T.X. 1996, A&A, 115, 253
- Lester & Gafney (1994) Lester, D.F. & Gafney, N.I. 1994, ApJ, 431, L13
- Lester, Harvey, & Carr (1988) Lester, D.F., Harvey, P.M., & Carr, J. 1988, ApJ, 329, 641
- Lira et al. (2002) Lira, P., Ward, M.J., Zezas, A. & Murray, S.S. 2002, MNRAS, 333, 709
- Lloyd et al. (2000) Lloyd, J.P., Liu, M.C., Macintosh, B.A., Severson, S.A., Deich, W.T., & Graham, J.R. 2000, Proc. S.P.I.E., 4008, 814
- Mouri & Taniguchi (1995) Mouri, H. & Taniguchi, Y. 1995, ApJ, 449, 134
- Murray et al. (1997) Murray, S.S. et al. 1997, Proc. S.P.I.E., 3114, 11
- Ohyama et al. (2000) Ohyama, Y. et al. 2000, PASJ, 52, 563
- Oliva et al. (1999) Oliva, E., Origlia, L., Maiolino, R., & Moorwood, A.F.M. 1999, A&A, 350, 9
- Rieke et al. (1985) Rieke, G.H., Cutri, R.M., Black, J.H., Kailey, W.F., McAlary, C.W., Lebofsky, M.J., & Elston, R. 1985, 290, 116
- Scoville et al. (2000) Scoville, N. Z. et al. 2000, AJ, 119, 991
- Sugai et al. (1997) Sugai, H., Malkan, M.A., Ward, M.J., Davies, R.I., & McLean, I.S. 1997, ApJ, 481, 186
- Tacconi et al. (1999) Tacconi, L.J., Genzel, R., Tecza, M., Gallimore, J.F., Downes, D., Scoville, N.Z. 1999, ApJ, 524, 732
- Tanaka, Hasegawa, & Gatley (1991) Tanaka, M., Hasegawa, T., & Gatley, I., 1991, ApJ, 374, 516
- Tecza et al. (2000) Tecza, M., Genzel, R., Tacconi, L.J., Anders, S., Tacconi-Garman, L.E., & Thatte, N. 2000, ApJ, 537, 178
- Thronson et al. (1990) Thronson, H.A., Majewski, S., Descartes, L., & Hereld, M. 1990, ApJ, 364, 456
- Van der Werf et al. (1993) Van der Werf, P.P., Genzel, R., Krabbe, A., Blietz, M., Lutz, D. Drapatz, S., Ward, M.J. & Forbes, D.A. 1993, ApJ, 405, 522
- Vignati et al. (1999) Vignati, P. et al. 1999, AA, 349L, 57
- Zezas, Fabbiano, & Prestwich (2001) Zezas, A., Fabbiano, G., & Prestwich, A. 2001, ASP Conference Series


| Spectrum | Obs. Date | Exposure | Area | Std. Star | S/N |
|---|---|---|---|---|---|
| (1) | (2) | (3) | (4) | (5) | (6) |
| 1 | 2000 Jun 25 | 600 | 0.35 | HD203856 | 40 |
| 2 | 2000 Jun 25 | 1200 | 0.35 | HD203856 | 15 |
| 3 | 2000 Jun 25 | 2100 | 1.05 | HD203856 | 15 |
| 4 | 2000 Jun 25 | 1500 | 0.65 | HD203856 | 10 |
| 5 | 2000 Jun 25 | 1500 | 0.75 | HD203856 | 10 |
| Image | Obs. Date | Exposure | Size | Filter | FWHM | S/N | |
|---|---|---|---|---|---|---|---|
| (1) | (2) | (3) | (4) | (5) | (6) | (7) | (8) |
| Fig.1 | 2000 Jun 25 | 60 | 11.349.07 | Ks | 2.150 | 0.320 | 110 , 38 |
| Fig.2a | 2001 Aug 6 | 2633 | 11.349.07 | 2.167 | 0.020 | 6400 , 550 | |
| Fig.2b | 2001 Aug 6 | 1772 | 11.349.07 | 2.125 | 0.020 | 5300 , 560 |
| Emitter | Transition | Rest () | Obs. () |
|---|---|---|---|
| v=1-0S(2) | 2.0338 | 2.0836 | |
| v=2-1S(3) | 2.0735 | 2.1243 | |
| v=1-0S(1) | 2.1218 | 2.1738 | |
| v=2-1S(2) | 2.1542 | 2.2070 | |
| Br | … | 2.1661 | 2.2192 |
| v=1-0S(0) | 2.2233 | 2.2778 | |
| v=2-1S(1) | 2.2477 | 2.3028 |
| Observed/Modeled | 1-0S(2)/1-0S(1) | 1-0S(0)/1-0S(1) | 2-1S(1)/1-0S(1) |
|---|---|---|---|
| 1aaObserved line ratios. See text. | 0.360.12 | … | 0.37 |
| 2aaObserved line ratios. See text. | 0.380.16 | 0.38 | 0.34 |
| 3aaObserved line ratios. See text. | 0.240.10 | … | 0.42 |
| 4aaObserved line ratios. See text. | 0.32 | 0.36 | … |
| 5aaObserved line ratios. See text. | 0.40 | 0.450.23 | … |
| FluorescentbbModel 14 of Black & van Dishoeck 1987. | 0.50 | 0.45 | 0.56 |
| Thermal (2000K)bbModel 14 of Black & van Dishoeck 1987. | 0.37 | 0.21 | 0.082 |
| Associ Detach. + Fluorescent (1000K)ccCombined effects of associative detachment and UV pumping, Black & van Dishoeck 1981. | 0.41 | 0.43 | 0.55 |
| Associ. Detach. + Fluorescent (5000K)ccCombined effects of associative detachment and UV pumping, Black & van Dishoeck 1981. | 0.42 | 0.32 | 0.53 |
| Thermal + Fluorescent (1000K)ddCombined effects of thermal and fluorescent excitation, Black & van Dishoeck 1981. | 0.41 | … | 0.54 |
| Thermal + Fluorescent (5000K)ddCombined effects of thermal and fluorescent excitation, Black & van Dishoeck 1981. | 0.37 | … | 0.19 |