Chandra Observations of the Dwarf Nova WX Hyi in Quiescence
Abstract
We report Chandra observations of the dwarf nova WX Hyi in quiescence. The X-ray spectrum displays strong and narrow emission lines of N, O, Mg, Ne, Si, S and Fe. The various ionization states implied by the lines suggest that the emission is produced within a flow spanning a wide temperature range, from K to K. Line diagnostics indicate that most of the radiation originates from a very dense region, with cm-3. The Chandra data allow the first tests of specific models proposed in the literature for the X-ray emission in quiescent dwarf novae. We have computed the spectra for a set of models ranging from hot boundary layers, to hot settling flows solutions, to X-ray emitting coronae. WX Hyi differs from other dwarf novae observed at minimum in having much stronger low temperature lines, which prove difficult to fit with existing models, and possibly a very strong, broad O VII line, perhaps produced in a wind moving at a few . The accretion rate inferred from the X-rays is lower than the value inferred from the UV. The presence of high-velocity mass ejection could account for this discrepancy while at the same time explaining the presence of the broad O VII line. If this interpretation is correct, it would provide the first detection of a wind from a dwarf nova in quiescence.
1 Introduction
Cataclysmic Variables (CVs) are a class of interacting binaries in which a donor star transfers mass onto a white dwarf (WD) accretor (see Warner 1995 for a comprehensive review). The characteristics of the accretion flow depend mostly on the rate of accretion onto the WD and on the WD magnetic field strength. In non-magnetic systems ( G), accretion from the donor proceeds through an undisturbed accretion disk, which connects to the WD through a boundary layer (Patterson & Raymond 1985). When the WD is more strongly magnetized, the accreting material is forced to follow the topology of the field lines before it hits the surface (Aizu 1973).
As a dwarf nova of the SU UMa type, WX Hyi (discovered by Luyten 1932) belongs to the class of non-magnetic CVs. Its orbital period is 0.0748134 days, and because it does not show eclipses, only an estimated inclination angle of is available (Schoembs & Vogt 1981). Schoembs & Vogt (1981) derive a white dwarf mass of 0.90.3 M⊙. Normal outbursts occur on average every 11.2 days (Ak, Ozkan & Mattei 2002). Distance estimates range from 120 pc based on the correlation between H equivalent width and mass transfer rate, (Patterson 1984), and 265 pc based on the correlation between period and absolute magnitude during outburst (Warner 1987). We adopt 265 pc because the latter correlation is tighter. Patterson (1984) estimates from the H equivalent width, which would give an X-ray luminosity of if half the accretion energy emerges as X-rays. However, Schwope et al. (2002) find an X-ray luminosity of only from the ROSAT All-Sky Survey data (assuming a 265 pc distance), which yields . K. Long (2003, personal communication) finds accretion rates of order from fits of accretion disk models to the UV continuum. The optical emission lines are single-peaked (Schoembs & Vogt 1981), perhaps placing WX Hyi in the SW Sex class of CVs. Strong, rather broad UV emission lines are seen in IUE spectra, with the N V line being stronger than is typical of dwarf novae in quiescence (Hassall et al. 1983).
Here we are interested in the structure of the accretion flow in the quiescent state. In quiescence, the accretion rate in the disk is low ( g s-1) and the disk is too cool to contribute any significant X-ray emission, while on the other hand the boundary layer is expected to be optically-thin and thus emit copious amounts of X-rays. According to the standard accretion theory (e.g. Lynden-Bell & Pringle 1974), the gravitational energy from the accreting material should reemerge in roughly equal proportions from the disk and from the boundary layer (BL). Whereas initial Einstein data on quiescent CVs appeared to be consistent with emission from an hot, optically-thin BL (Patterson & Raymond 1985), later observations with Ginga, ROSAT, ASCA, RXTE showed that the X-ray luminosity is actually lower than theoretically expected. Several suggestions have been made to solve this “mystery of missing BLs” (e.g. Ferland et al. 1982), such as (among others) reflection effects and cooling flows (Done & Osborne 1997), and disruption of the inner disk region by the WD rotation (Ponman et al. 1995), by irradiation from the WD (King 1997), or by “coronal” evaporation (Meyer & Meyer-Hofmeister 1994).
The presence and structure of BLs (or more generally hot flows) in quiescent CVs is therefore still a subject of debate, and wildly different models have been proposed (e.g. Narayan & Popham 1993, Meyer & Meyer-Hofmeister 1994; Mahasena & Osaki 1999; Medvedev & Menou 2001). While all the models can account for the total observed X-ray luminosity, each of them, however, makes very specific predictions for the physical conditions within the flow, and hence the resulting temperature and density profiles. As shown in a number of papers (among the most recent ones: Pradhan 2000; Mauche et al. 2001; Perna et al. 2000; Menou et al. 2001; Porquet et al. 2002; Dubau & Porquet 2002; Szkody et al. 2002), a powerful way to constrain the characteristics of hot X-ray emitting flows is through the relative intensities of emission lines produced within them. The high resolution of Chandra gives us the opportunity, for the first time, to resolve relative line intensities and perform such an analysis.
In this paper, we report Chandra observations of the dwarf nova WX Hyi in quiescence. Its X ray spectrum shows many lines from different ionization states of N, O, Ne, Mg, Si, S and Fe. First, we use line diagnostics to set overall constraints on the range of temperatures and densities spanned by the flow. Second, we compute X-ray spectra for different types of accretion flow structures, and test them against our data. The comparison shows that none of the models provides an adequate fit to the entire emission line spectrum, in that more plasma must be present at relatively low temperatures than predicted by the models. A cooling flow model (used by Mukai et al. 2003 to model spectra of non-magnetic CVs) is consistent with the short-wavelength spectra, but fails to reproduce the strength of the O VII line. This line is much stronger and broader than in the objects studied by Mukai et al., and we consider the intriguing possibility that it might be produced in a wind from the accretion flow.
2 Data Analysis
WX Hyi was observed on-axis by the Chandra X-ray Observatory’s ACIS-S detector and HETG grating on 2002 Jul 25 and Jul 28 (observation ids 3721 and 2760) and with effective exposure times after standard processing of 48366s and 49266s respectively. Optical data provided by the AAVSO show that WX Hyi was in quiescence during both observations, with an outburst 4 days after the second observation on August 2. The previous detected outburst was 20 days before our first observation. Examination of the background light curves shows no significant variability due to dropouts or flares. The destreak algorithm was applied to remove electronic noise from the noisier S4 chip, and the standard extraction parameters were used to obtain dispersed count spectra. The and orders for both observations were coadded to obtain summed HEG and MEG spectra. There was no significant difference in the spectra between the two exposures. The secular degradation of the ACIS quantum efficiency was taken into account using the acis-abs model while making the response files.
The spectra were grouped to a signal-to-noise of 2 per bin. Initial attempts to model the lines in the merged spectrum using the CIAO fitting program Sherpa using both global model fits and fits to individual lines with a gaussian line model and polynomial fits to the local continuum gave unsatisfactory, poorly constrained results for the weaker lines. Instead, we determined line fluxes by simple integration of the counts in a band around each line, subtracting the continuum contribution using two methods: by comparison with counts in nearby wavelength bands and by subtraction of a broken powerlaw fit to the global continuum. These two methods gave consistent results, and are in reasonable agreement with the gaussian line fits in the case of the strongest lines. In addition, measurements of the stronger lines in the individual single order exposures give consistent results. Line flux measurements are presented in Table 1 together with probable identifications. The errors in Table 1 are 1-sigma statistical uncertainties computed for the line and continuum counts using the Gehrels (1986) approximation suitable for low count Poisson statistics.
The cleanest X-ray line is the O VIII resonance line at 18.967 Å. Its width is (FWHM) after correction for the instrument profile. Correcting for the inclination, the intrinsic width is . While this is similar to the widths () of the UV lines, the wings () apparent in the UV line profiles (K. Long 2003, private communication) are absent. The inclination-corrected line width is the Keplerian velocity near the WD surface.
3 Constraints on the characteristics of the accretion flow from the X-ray spectrum
3.1 Line diagnostics
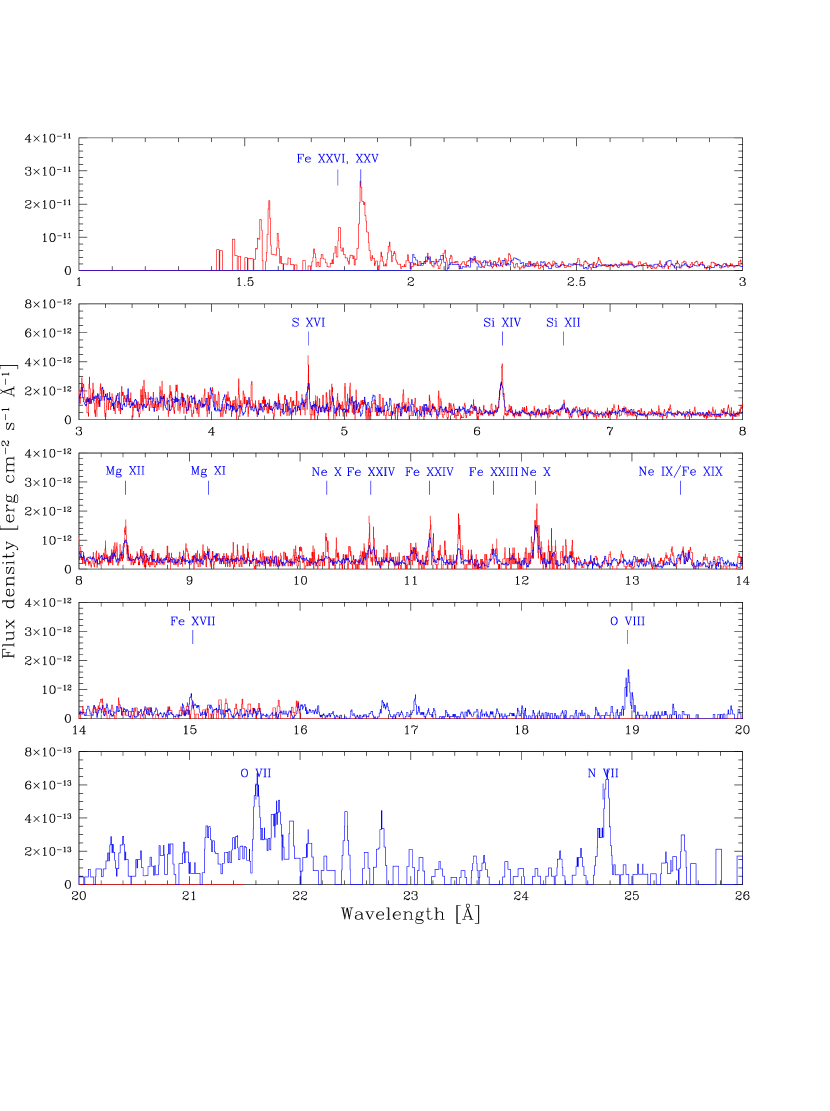
The X-ray spectrum, including both the MEG and HEG observations, is displayed in Figure 1. The spectrum shows a smooth continuum with strong emission lines, particularly from the H and He-like ions of O, Mg, Ne, Si, Fe, as well as from all the Fe L-shell complex (Fe XVII-Fe XXIV). The presence of this variety of ionization states indicates emission from a plasma distributed over a wide range of temperatures, from K, necessary to have some contribution to the O VII line, up to K, a temperature at which the ion Fe XXVI is most abundant in equilibrium (without strong photoionizing radiation).
From the X-ray spectrum in Figure 1, one can see that the O VII line profile appears to be wider that those of O VIII and the other lines, though it is clearly noisy. The profile, which is separately displayed in Figure 2, seems to consist of narrow O VII resonance and forbidden lines on top of a broad feature perhaps 5000 wide. Some of the noise level results from the presence of bad columns in the order of the MEG, which are broadened by dithering. However, careful examination of the counts in the order in the individual exposures indicates that the broad feature is probably real, though details of the structure are questionable. Note that the effective area changes rapidly in this wavelength range, making the number of counts in the blue-shifted part of the feature more significant. It is difficult to determine an unambiguous value for the uncertainty, in that different choices for spectral binning yield different estimates of the significance of the feature. There are several lines of calcium near this wavelength, but comparison with iron lines formed at the same temperatures indicates that the calcium lines are too weak to account for the observed structure. It should be noted, however, that there appears to be also a feature around 20.3 Å for which we have no identification.
If the broad O VII component is genuine, the lack of broad components in the other lines suggests that the high velocity material only appears in low ionization species. The lack of this component in N VII must be due to the small number of counts in that line. The line width is comparable to or larger than the widths () of the UV Lines (K. Long 2003, personal communication), so the broad O VII might originate in the innermost part of the disk or in a wind.
As a first attempt to constrain the physical conditions in the accretion flow, we use the diagnostics provided by the He-like triplet line ratios, which have been widely used in analyses of the solar plasma (Gabriel & Jordan 1969; Mewe & Schrijver 1978; Doyle 1980; Pradhan & Shull 1981). In particular, the ratio between the forbidden line and the intercombination line is a strong function of the density at high densities, due to the suppression of the forbidden lines with increasing density. The ratio is typically on the order of a few at low densities, and rapidly drops at densities larger than a critical value that increases with , ranging from cm-3 for C, to cm-3 for Fe (e.g. Porquet et al. 2001). We find the 1 upper limits and for Ne111It should be noted that the intercombination line of Ne is not very clean, and might have some contamination from Fe XIX which is not possible to quantify. and Mg respectively. The 1s2s - 1s2p transition, however, is driven not only by collisions, but also by UV radiation, so that in gas near a 30,000 K black body the ratio will be in the high density limit for elements through Mg (Mauche 2002). We do not know the white dwarf temperature for WX Hyi. K. Long (private communication, 2003) has fit UV continua of WX Hyi observed by the Hopkins Ultraviolet Telescope and by the Hubble Space Telescope GHRS with combinations of white dwarf and accretion disk spectra, and typically finds WD temperatures above 20,000 K. The ratios of O VII, Ne IX and Mg XI are probably dominated by UV radiation, but the ratio for Si XIII should be dominated by collisions, even if the entire UV continuum in the Hopkins Ultraviolet Telescope wavelength range arises from the white dwarf. Unfortunately, we are unable to obtain a reliable measurement of the Si XIII ratio.
Another useful plasma diagnostic is the ratio , where is the resonance line. This is sensitive to the ionization state of the gas and to the electron temperature. When the resonance line is strong compared to the forbidden and the intercombination line (), the plasma is collision-dominated. On the other hand, a plasma in which photoionization is important will have a weaker resonance line. Values of are typically considered to be indicative of a photoionization-dominated plasma (e.g. Porquet et al. 2001). For O, Si and S, we found that the , and lines were not well resolved to allow a reliable estimate of the value. In the cases of Mg and Ne, we were able to set the 1 upper limits and , respectively. This indicates that photoionization is not dominant.
A useful density diagnostic is provided by the ratio between the 17.10 Å and the 17.05 Å lines of the ion Fe XVII, which is less sensitive to UV radiation than are the He-like line ratios (Mauche et al. 2001). The Fe XVII ratio is found to be (at the level) for WX Hyi. For a collisionally-dominated plasma, this value suggests a density in the relatively cooler region (– K) where Fe XVII is produced. A comparable density is implied by the best value of the ratio between the 11.92 Å and the 11.77 Å lines of Fe XXII, which is found to be in our data. Accounting for the error in the measurement, the confidence level for the density ranges between . As discussed by Mauche, Liedahl & Fournier (2003), this density determination is very insensitive to temperature and photoexcitation.
3.2 Comparison with specific models for the X-ray emission
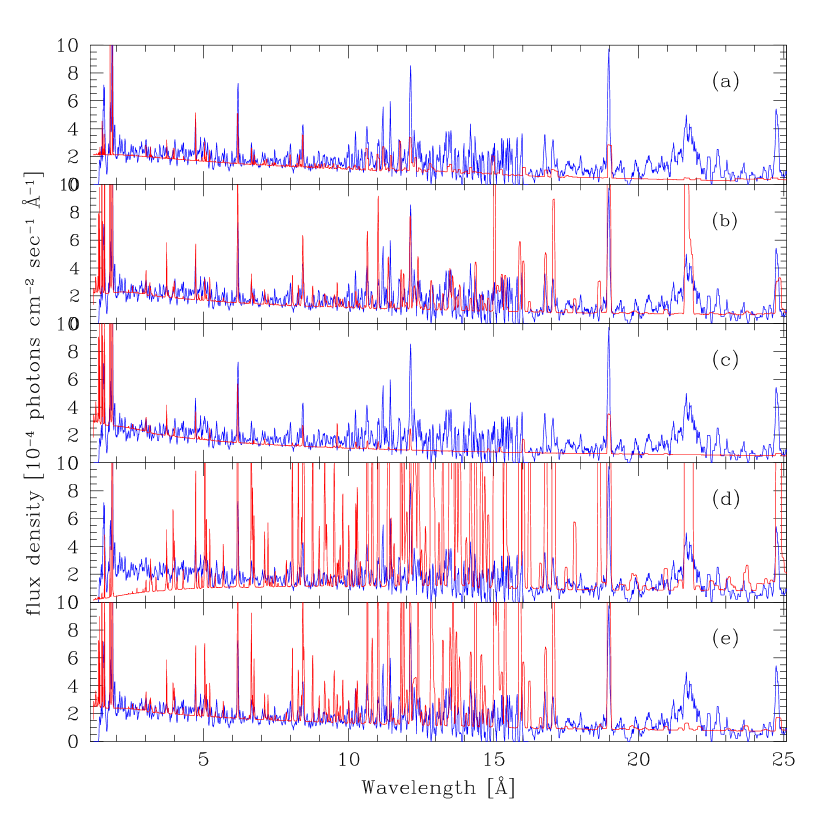
The physics, and hence the density-temperature structure, of boundary layers is still poorly understood. Only a few models have been proposed, and they have been primarily tested on their ability to account for the total observed X-ray and UV radiation. The Chandra observations of the X-ray emission, by resolving lines, allow us to set much tighter constraints on the models, due to the high sensitivity of the relative line intensities to the temperature and density profile characterizing the flow. Here we consider five types of models proposed in the literature to explain the origin of the quiescent X-ray emission of CVs. For each of them, we compute the expected X-ray spectrum using the temperature and density profiles that they predict, and compare the spectra with our observations. The cooling flow model has been implemented in the xspec package (Arnaud 1996). For the other models we compute the emissivity of the medium by using the atomic rate packages of the shock model code described by Raymond (1979), modified with updated atomic rates, as in Cox & Raymond (1985). This package has the disadvantage that some Fe L-shell multiplets that are resolved in our spectra are computed as single lines. The package also lacks recent improvements to the atomic rates of the more complex Fe ions. It computes an ionization balance which is quite similar to that of Mazzotta et al. (1998) in ionization equilibrium. The advantages of the code are that it allows us to compute time-dependent ionization and to include photoionization. It includes dielectronic recombination satellite lines and the contributions of recombination to excited levels for the spectra of H-like and He-like ions. Overall, the predictions should be reasonably accurate for most of the strong lines; those of H-like and He-like ions, Fe XVII and Fe XXIV. For the models presented here we included the effects of photoionization by the X-ray radiation produced within the flow itself, though this turned out to have little effect on the emission lines. For a proper comparison with the data, the computed X-ray spectra were then convolved with the response matrices and effective areas of the Chandra detectors. In particular, we used the HEG detector for Å, and the MEG detector for Å.
(a) Cooling flow
A cooling flow model, based on Mushotzky & Szymkowiak (1988), has been implemented in xspec with the routine mkcflow. Its basic assumption is of steady-state isobaric radiative cooling. The two main parameters are the maximum temperature, , and the overall normalization, which directly relates to the mass accretion rate. Mukai et al (2003) showed that cooling flow models provide a good representation of the X-ray spectral properties of non-magnetic CV systems. A fit to our data with the model mkcflow is shown in the top panel of Figure 3. We find that the fit is acceptable at short wavelengths but poorly constrained, with the maximum temperature parameter at a value of 20 keV, uncertain by a factor of two, and the column density cm-2 (basically consistent with zero). The value of the temperature is consistent with the Fe XXVI/Fe XXV ratio that gives an upper limit of 10 keV. Note that this ratio is about 1/7 in WX Hyi as opposed to 3/4 in U Gem (Szkody et al. 2002), implying a corresponding lower temperature of WX Hyi. The value of implied by the cooling model is for keV (assuming that half of the X-rays are absorbed by the WD). This is about a factor of 5 smaller than the value found by K. Long (2003, private communication) from fits of disk models to the UV continuum. While the system is by definition variable, it is not surprising that the X-ray luminosity is less than expected from farther out in the disk. Possible interpretations are that decreases inward in the disk as material builds up for the next outburst, that some material and energy is lost to a wind, or that some energy is advected to the WD surface and reemitted in the UV.
Overall, the cooling flow model appears to account reasonably well for the continuum and the line strengths in the short wavelength region of the spectrum, but it underpredicts the emission at long wavelengths. In particular, it is not able to account for the emission from the O VII line, which in WX Hyi is significantly stronger than in the objects studied by Mukai et al. (2003).
(b) Hot boundary layer
Narayan & Popham (1993; NP93) describe detailed models for thin disk boundary layers in CVs. A key element of their theory is the role of heat advection which, they show, allows boundary layers at low accretion rates to be radially thicker and significantly hotter than those at higher accretion rates. We have used the profiles of density and temperature corresponding to the model with , which is the closest to the accretion rate in our system. The behavior of the low temperature region closest to the white dwarf surface cannot be read from the plots in NP93, but this is a small fraction of the total X-ray luminosity and may be neglected. We note that the comparison with this particular solution should be interpreted with caution, as temperature and density do not simply scale with accretion rate. Panel (b) of Figure 3 shows a comparison between our data and the X-ray spectrum that we computed for this boundary layer solution. The spectrum has been rescaled to match the continuum. If the density profile were to scale linearly with the accretion rate, the data would imply a value of of about g s-1. As the figure shows, this model predicts substantially more emission than the cooling flow in the O VII and O VIII lines. This is a result of the fact the BL solution of NP93 predicts an increase of the density in the outer, colder regions of the flow where the oxygen emission peaks. However, the reasonable agreement between the observed and predicted low temperature lines is partly fortuitous in that Narayan & Popham assumed bremsstrahlung cooling, while the actual line cooling rate at the temperatures where the O VII, O VIII and Fe XVII lines are formed is nearly an order of magnitude higher. Thus if Narayan & Popham had used a cooling rate consistent with the lines we observe, their model would have predicted weaker emission by an order of magnitude.
(c) Coronal siphon flow
Meyer & Meyer-Hofmeister (1994) investigated a model based on the interaction between a cool disk and a hot corona above it via thermal conduction. They showed that, in these conditions, a coronal “siphon flow” can develop. This evaporates mass from the disk, which is partly accreted onto the white dwarf and partly lost to a wind. The solutions for this model are uniquely determined once the viscosity parameter for the flow is specified222Under the conditions in which the radiative energy loss in the corona is small compared to conductive energy loss towards the lower boundary and the wind loss, the radial solutions for and are independent of for a given white dwarf mass (Meyer & Meyer-Hofmeister 1994).. We varied the value of this parameter to find the best fit coronal flow solution to our data. The resulting X-ray spectrum predicted for the coronal siphon flow is shown in the middle panel of Figure 3. As it can be seen, this model falls short of producing enough emission in the long wavelength region of the spectrum. This is a consequence of the fact that this solution predicts a radial temperature profile , and a run of density which is a very steep function of the radius, . This implies that there is relatively little mass at the lower temperatures where the longer wavelength emission is generated.
(d) X-ray emitting corona
Mahasena & Osaki (1999) constructed steady-state solutions of X-ray emitting corona, including the effect of thermal conduction. We have used the density and temperature profiles shown in their Figure 1 for an accretion rate g s-1, and calculated the corresponding X-ray spectral emission. It was not possible to read numbers from their plot for the region below K, so we computed a matching solution that neglected the rotation and infall velocities, both of which are small in this region. The result is compared to the data in panel (d) of Figure 3. This comparison should also be taken with caution because the value of the accretion rate is not precisely tuned to match that of WX Hyi. This coronal model, which transports most of the accretion luminosity to a cool, thin, conduction dominated layer near the white dwarf surface and radiates it there, produces emission lines that are far too strong and a continuum that is much too soft. The higher accretion rate model of Mahasena & Osaki, g s-1, did a much better job matching the Chandra spectrum of U Gem (Szkody et al. 2002)333Note that there is a typo in the Szkody et al. (2002) in reporting the higher value of the accretion rate used as g s-1 rather than g s-1. because it is closer to the cooling flow solution, which matches that spectrum quite well (Mukai et al. 2003). However, the cooling model predicts too little emission in the low temperature lines to match the WX Hyi spectrum. The density in the region where the Fe XXII lines are produced is about in this model, a few times higher than the density sensitive line ratio indicates.
(e) Hot settling flow solutions
Following Medvedev & Narayan (2001), Medvedev & Menou (2002) presented solutions for hot accretion onto unmagnetized, rotating white dwarfs. Together with the accretion rate, the WD rotation rate is an important parameter in these models, because viscously-mediated losses of rotational energy by the WD constitute an additional source of energy powering the X-ray emission from the flow (see Medvedev & Menou 2002 for examples). To calculate the hot flow models we used the numerical relaxation code which solves height-integrated two-temperature hydrodynamic equations with high spatial resolution providing accurate solutions even deep inside the boundary layer. This is the same code which has previously been used by Medvedev & Menou (2002) except for the cooling part which now also incorporates (in addition to bremsstrahlung) the emission line cooling in the form erg cm-3 s-1, which is a good approximation above K, where (Raymond, Cox & Smith 1976). At the high densities of the WX Hyi boundary layer, quenching of UV lines reduces the cooling rate below K, but here we are concerned only with lines formed above K. In our present solutions we have chosen the outer boundary of the flow to be at radius , which is realistic. We have computed hot settling flow models appropriate for WX Hyi. Absent any observational constraint on the WD rotation in this system, we have computed a variety of models with values for the spin parameter, (the angular velocity of the WD in units of the Keplerian angular velocity), ranging from 0.03 to 0.3. The accretion rate in the models was adjusted so that the observed X-ray luminosity is reproduced in each case (see Medvedev & Menou 2002 for details). The required value was on the order of g s-1.
We found that the X-ray spectrum predicted by the hot settling flow solution greatly overpredicts the X-ray line emission with respect to our observations. Figure 3 (e) shows the spectrum predicted by this solution for the case . As increases, line emission becomes even more pronounced. Therefore, unless optical depth effects become sufficiently important to suppress line emission, this solution does not appear to reproduce the observations well.
4 Conclusions
The Chandra observations of the dwarf nova WX Hyi in quiescence show resolved spectral lines produced within the accretion flow. Line diagnostics have allowed us to set constraints on the characteristics of the hot flow, showing that gas densities are very high, –, and span a wide range of temperatures, – K.
The spectrum of WX Hyi shows some unusual features if compared to the spectra of the objects in the same class studied by Mukai et al. (2003). Lines in the longer wavelength region of the spectrum are relatively stronger. The O VII line especially cannot be accounted for by the cooling flow model used by Mukai et al. to fit the spectra of this type of objects.
The Chandra data allow the first tests of specific models proposed in the literature for the X-ray emission in quiescent dwarf novae. We have computed the spectra for a set of models ranging from hot boundary layers, to hot settling flows solutions, to X-ray emitting coronae. While most of these models can reproduce well the shape of the continuum, none of them can fully account for the relative line strengths over the entire spectral range. Most coronal models fall short of predicting enough radiation at longer wavelengths, though a thermal conduction-dominated boundary layer predicts too much long wavelength emission. Hot accretion solutions tend to overpredict the short wavelength emission. It is possible, but far from obvious, that some combination of these models, perhaps with thermal conduction present but reduced by a magnetic field, might match the observations.
Given the difficulties of the existing models, it is possible that somewhat different physical processes dominate the boundary layer flow. In particular, it has been suggested that magnetic flux tubes rise above the disk surface and produce X-rays in the same manner as solar flares (Galeev, Rosner & Vaiana 1979). While X-ray emission from the disk as a whole is excluded by the X-ray light curve of OY Car, which limits much of the X-ray emission to the immediate vicinity of the white dwarf (Ramsay et al. 2001), the boundary layer is likely to be magnetically dominated. The boundary layer itself is stable against the magnetorotational instability (Balbus & Hawley 1991), but magnetic flux generated just beyond the boundary layer diffuses into it, and the toroidal component is strongly amplified by the enormous shear (Armitage 2002; Steinacker & Papaloizou 2002). Lacking a more definite prediction, one might expect a power law distribution of X-ray flare energies, as on the Sun (UeNo et al. 1997) and perhaps a significant contribution from flares that reach modest temperatures (e.g. Raymond 1990). Detailed models require Monte Carlo simulations of flare energies, intervals between flares, and physical processes such as thermal conduction, and are beyond the scope of this paper. It is possible, however, that some combination of parameters can be found to roughly match the data.
It is therefore possible that the boundary layer is better described as a collection of impulsive magnetic reconnection events than as a smooth fluid flow. An implication of this idea is that a significant amount of mass may be expelled as a wind. Solar flares are often accompanied by Coronal Mass Ejections (CMEs), and on average the CMEs carry somewhat more kinetic energy than the flares emit as radiation. Thus mass ejections could easily account for the factor of 3 or so discrepancy between the accretion rates estimated from the UV spectrum and the X-ray spectrum. Thus far, winds from cataclysmic variables have only been detected in high systems. It has recently been shown that these winds are not driven by radiation pressure alone (Mauche & Raymond 2000; Proga 2003). There is as yet no way to determine whether large scale fields, as in Proga’s models, or small scale CME-like eruptions dominate the wind. Winds from low accretion rate systems are difficult to detect because of the high ionization state expected.
Assuming the broad component of the O VII emission (section 2) is real, it could be formed in the wind hypothesized in the previous paragraph. A simple estimate of the mass loss rate from a surface corresponding to the white dwarf circumference and the boundary layer width ( cm) with a density (as required to match the O VII luminosity) and a speed of 3000 yields about , or more than the total inferred from the UV spectra. Thus in order to identify the broad O VII emission with a wind, we require a filling factor of order 0.1. With this filling factor one would in fact need a density larger to keep the emission measure () of the O VII line at the observed value. The accretion rate ( being the area) would then be smaller, consistent with the value inferred from the UV observations. One must be cautious about a wind interpretation both because of the low statistical quality of the O VII profile and because a wide O VII profile might arise from Keplerian rotation of the inner disk just outside the boundary layer. However, a wind of moderate ionization state does provide an appealing explanation for the difference between the accretion rates derived from UV and X-ray observations.
We thank the referee, Chris Mauche, for his careful review of our manuscript and very useful comments. In this research, we have used, and acknowledge with thanks, data from the AAVSO International Database, based on observations submitted to the AAVSO by variable star observers worldwide. This analysis was supported by the CHANDRA grant GO2-3032X to the Smithsonian Astrophysical Observatory and by the Celerity Foundation.
References
- (1)
- (2) Aizu, K. 1973, Prog. Theor. Phys., 49, 1184
- (3) Armitage, P. J. 2002, MNRAS, 330, 895
- (4) Ak, T., Ozkan, M. T. & Mattei, J. A. 2002, A&A, 389, 478
- (5) Arnaud, K. A. 1996, in ASP Conf. Ser. 101, Astronomical Data Analysis Systems V, ed. G.H. Jacoby & J. Barnes (San Francisco: ASP), 17
- (6) Balbus, S. A. & Hawley, J. F. 1991, ApJ, 376, 214
- (7) Cox, D. P. 1972, ApJ, 178, 143
- (8) Done, C. & Osborne, J. P. 1997, MNRAS, 288, 649
- (9) Doschek, G. A. & Cowan, R. D. 1989, ApJS, 56, 67
- (10) Doyle, J. G. 1980, A&A, 87, 183
- (11) Dubau, J. & Porquet, D. 2002, in New Visions of the X-ray Universe in the XMM-Newton and Chandra Era, 26-30 November 2001, ESTEC, The Netherlands
- (12) Ferland, G. J., et al. 1982, ApJ, 262L, 53
- (13) Gabriel, A. H. & Jordan, C. 1969, MNRAS, 145, 241
- (14) Galeev, A.A., Rosner, R., & Vaiana, G.S. 1979, ApJ, 229, 318
- (15) Gehrels, N. 1986, ApJ 303, 336
- (16) Hassall, B. J. M., Pringle, J. E., Schwarzenberg-Czerny, A., Wade, R. A., Whelan, J. A. J. & Hill, P. W. 2002, MNRAS, 203, 865
- (17) King, A. R. 1997, MNRAS 288, L16
- (18) Luyten. W., 1932, AN 245, 5868, 211
- (19) Lynden-Bell, D. & Pringle, J. E. 1974, MNRAS, 168, 603
- (20) Mauche, C.W., Liedahl, D.A., & Fournier, K. B. 2001, ApJ, 560, 992
- (21) Mauche, C. W. 2002, in ASP Conf. Ser. 261, The Physics of Cataclysmic Variables and Related Objects, ed. B. T. Gänsicke, K. Beuermann, and K. Reinsch (San Francisco: ASP), 113
- (22) Mauche, C.W., Liedahl, D.A., & Fournier, K.B 2003, ApJL, 588, 101
- (23) Mauche, C.W., & Raymond, J.C. 2000, ApJ, 541, 924
- (24) Mazzotta, P., Mazzitelli, G., Colafrancesco, S. & Vittorio, N. 1998, A& A, 133, 403
- (25) Medvedev, M. V. & Narayan, R. 2001, ApJ, 554, 1255
- (26) Medvedev, M. V. & Menou, K. 2002, ApJ, 565, L39
- (27) Menou, K., Perna, R., & Raymond, J. C. 2001, ApJ, 549, 509
- (28) Meyer, F. & Meyer-Hofmeister, E. 1994, A&A, 288, 175
- (29) Mewe, R. & Schrijver, J. 1978, A&A, 65, 99
- (30) Mukai, K., Kinkhabwala, A., Peterson, J. R., Kahn, S. M. & Paerels, F. 2003, ApJ, 586, L77
- (31) Mushotzky, R. F. & Szymkowiak, A. E. 1988, in Cooling Flows in Clusters and Galaxies; Proceedings of the NATO Advanced Research Workshop, Cambridge, England, June 22-26, 1987, ed. A.C. Fabian (Dordrecht:Kluwer), 53
- (32) Narayan, R., & Popham, R. 1993, Nature, 362, 820
- (33) Patterson, J. 1994, PASP, 106, 209
- (34) Patterson, J. & Raymond, J. V. 1985, ApJ, 292, 535
- (35) Perna, R., Raymond, J. C. & Narayan, R. 2000, ApJ, 541, 898
- (36) Ponman, T. J., et al. 1995, MNRAS, 276, 495
- (37) Porquet, D., Mewe, R., Kastra, K. S., Dubai, J., Raassen, A. J. J. 2002, in New Visions of the X-ray Universe in the XMM-Newton and Chandra Era, 26-30 November 2001, ESTEC, The Netherlands, in press
- (38) Pradhan, A. K. 2000, in Proc. Symp. Atomic Data Needs for X-ray Astronomy, ed. Bautista, Kallman & Pradhan (NASA CP-2000-209968; Washington: NASA)
- (39) Porquet, D., Mewe, R., Dubau, J., Raassen, A. J. J. & Kaastra, J. S. 2001, A&A, 376, 1113
- (40) Pradhan, A. K. & Shull, J. M. 1981, ApJ, 249, 821
- (41) Proga, D. 2003, ApJ, 585, 406
- (42) Ramsay, G., et al. 2001, A& A, 365, L288
- (43) Raymond, J. C. 1979, ApJS, 39, 1
- (44) Raymond, J.C. 1990, ApJ, 365, 387
- (45) Raymond, J. C., Cox, D. P. & Smith, B. W. 1976, ApJ, 204, 290
- (46) Schoembs, R., & Vogt, N. 1981, A&A, 97, 185
- (47) Schwope, A.D., Brunner, H., Buckley, D., Greiner, J., Heyden, K.v.d., Neizvestny, S., Potter, S. & Schwarz, R. 2002, A& A 396, 895
- (48) Steinacker, A., & Papaloizou, J.C.B. 2002, ApJ, 571, 413
- (49) Szkody, P., Nishikida, K., Raymond, J. C., Seth, A., Hoard, D. W., Long, K. S., & Sion, E. M. 2002, ApJ, 574, 942
- (50) UeNo, S., Mineshige, S., Negoro, H., Shibata, K., & Hudson, H.S. 1997, ApJ, 484, 920
- (51) Warner, B. 1995, Cataclysmic Variable Stars (Cambridge: Cambridge University Press)
- (52) Warner, B., 1987, MNRAS, 227, 23
- (53) Warner, B., Livio, M. & Tout, C. 1996, MNRAS, 282, 735
- (54)
| Element | (a)(a)footnotemark: | HEG flux(b)(b)footnotemark: | MEG flux(b)(b)footnotemark: |
|---|---|---|---|
| Fe XXVI | 1.78 | ||
| Fe XXV | 1.85 | ||
| Fe K | 1.94 | ||
| S XVI | 4.73 | ||
| S XV | 5.05 | ||
| Si XIV | 6.19 | ||
| Si XIII | 6.65 | ||
| Fe XXIV | 8.00 | ||
| Mg XII | 8.42 | ||
| Mg XI | 9.17 | 1.0 | |
| Mg XI | 9.23 | ||
| Mg XI | 9.31 | ||
| Ne X | 10.24 | ||
| Fe XXIV | 10.62(c)(c)footnotemark: | ||
| Fe XXIV | 10.66(c)(c)footnotemark: | ||
| Fe XXIV | 11.05 | ||
| Fe XXIV | 11.17 | ||
| Fe XXIII | 11.73 | ||
| Fe XXII | 11.77 | ||
| Fe XXII | 11.92 | 1.3 | |
| Ne X | 12.13 | ||
| Ne IX | 13.44 | ||
| Ne IX | 13.55 | ||
| Ne IX | 13.70 | ||
| Fe XVII | 15.03 | ||
| Fe XVII | 17.05 | ||
| Fe XVII | 17.10 | 1.1 | |
| O VIII | 18.96 | ||
| O VII | 21.60(d)(d)footnotemark: | ||
| O VII | 21.80(d)(d)footnotemark: | ||
| Fe XXIV | 21.97(d)(d)footnotemark: | ||
| N VII | 24.74 |