A Neighboring Dwarf Irregular Galaxy Hidden by the Milky Way
Abstract
We have obtained VLA and optical follow-up observations of the low-velocity H I source HIZSS 3 discovered by Henning et al. 2000 and Rivers 2000 in a survey for nearby galaxies hidden by the disk of the Milky Way. Its radio characteristics are consistent with this being a nearby ( Mpc) low-mass dwarf irregular galaxy (dIm). Our optical imaging failed to reveal a resolved stellar population, but did detect an extended H emission region. The location of the H source is coincident with a partially-resolved H I cloud in the 21-cm map. Spectroscopy confirms that the H source has a similar radial velocity to that of the H I emission at this location, and thus we have identified an optical counterpart. The H emission (100 pc in diameter and with a luminosity of ergs s-1) is characteristic of a single H II region containing a modest population of OB stars. The galaxy’s radial velocity and distance from the solar apex suggests that it is not a Local Group member, although a more accurate distance is needed to be certain. The properties of HIZSS 3 are comparable to those of GR 8, a nearby dIm with a modest amount of current star formation. Further observations are needed to characterize its stellar population, determine the chemical abundances, and obtain a more reliable distance estimate.
1 Introduction
A complete census of nearby galaxies is hampered by the presence of our own Milky Way, whose dust and gas creates a “zone of avoidance” (ZOA) in the distribution of galaxies on the plane of the sky. Yet an accurate knowledge of the mass distribution within our neighborhood is essential if we are to understand the dynamical evolution of the Local Group from kinematic studies (e.g., Peebles et al. 2001). In addition, the discovery of previously unknown nearby galaxies will further efforts to understand the local velocity field (see Kraan-Korteweg 1986 and Karachentsev et al. 2002) as well as providing additional examples for studying the resolved stellar content of nearby systems (cf. Mateo 1998, Massey 2003).
Kerr & Henning (1987) demonstrated the power of single-dish H I surveys in searching for hidden galaxies. Such observations provide not only the two-dimensional location of galaxies on the plane of the sky, but also the redshift. Furthermore, the width of the 21-cm line gives some indication of the mass. “Shallow” surveys are now complete in both the north (Henning et al. 1998, Rivers, Henning, & Kraan-Korteweg 1999, Rivers 2000) and the south (Henning et al. 2000), with more sensitive searches in progress. Although no massive Local Group galaxies have been found lurking behind the Galactic disk, the northern survey did reveal a previously unknown spiral galaxy (“Dwingeloo 1”) at 3 Mpc (Kraan-Korteweg et al. 1994), a likely member of the IC 342/Maffei Group.
Here we report on follow-up observations of a galaxy that is nearly half that distance. In their survey of H I sources in the southern ZOA, Henning et al. (2000) lists object HIZSS 3 as having a heliocentric radial velocity of only 299 km s-1. Improved data (presented below) yield a velocity of 280 km s-1. Given its location relative to the solar apex, this translates to a velocity with respect to the Local Group of 134 km s-1 (following Courteau & van den Bergh 1999) implying a distance of only 1.8 Mpc (=75 km s-1 Mpc-1) in the absence of any peculiar velocities. Thus, this is one of the nearest galaxies known, similar in distance to the well-known Sextans A, Sextans B, and GR 8 galaxies, nearby but slightly beyond the zero-velocity envelope that defines the Local Group (Mateo 1998, van den Bergh 2000). Its location less than 0.1 degrees from the Galactic plane has made prior optical identification unlikely; nothing but foreground stars is seen on the Palomar Sky Survey prints or in the 2MASS images at this position. There is no object listed within 5 arcmin of this position in the Extended Source Catalog (Jarrett et al. 2000) of the 2MASS survey.
The properties of this object (summarized in Table 1) are strongly suggestive of a dwarf irregular (dIm) galaxy. The H I velocity width at 20% peak intensity determined by Henning et al. (2000) is 85 km s-1, a value which is typical for dwarf irregulars (Hunter 1997; see her Fig. 5). In addition, new observations (described below) yield an H I diameter of 6 arcminutes. At a distance of 1.8 Mpc, this would correspond to a diameter of 3 kpc, a value which is also typical for dwarf irregulars (Hunter 1997, Fig. 4).
2 New Observations
2.1 VLA
The galaxy was originally discovered at 21-cm by the Dwingeloo Obscured Galaxies Survey of the northern ZOA (, 5∘; Henning et al. 1998, Rivers, Henning, & Kraan-Korteweg 1999, Rivers 2000), and it was also detected by the H I Parkes Zone of Avoidance Shallow Survey of the southern ZOA (, 5∘; Henning et al. 2000). The galaxy, at galactic coordinates , lies in a region of overlap between the two surveys. The basic H I parameters were first published as part of the latter catalog, hence the HIZSS moniker.
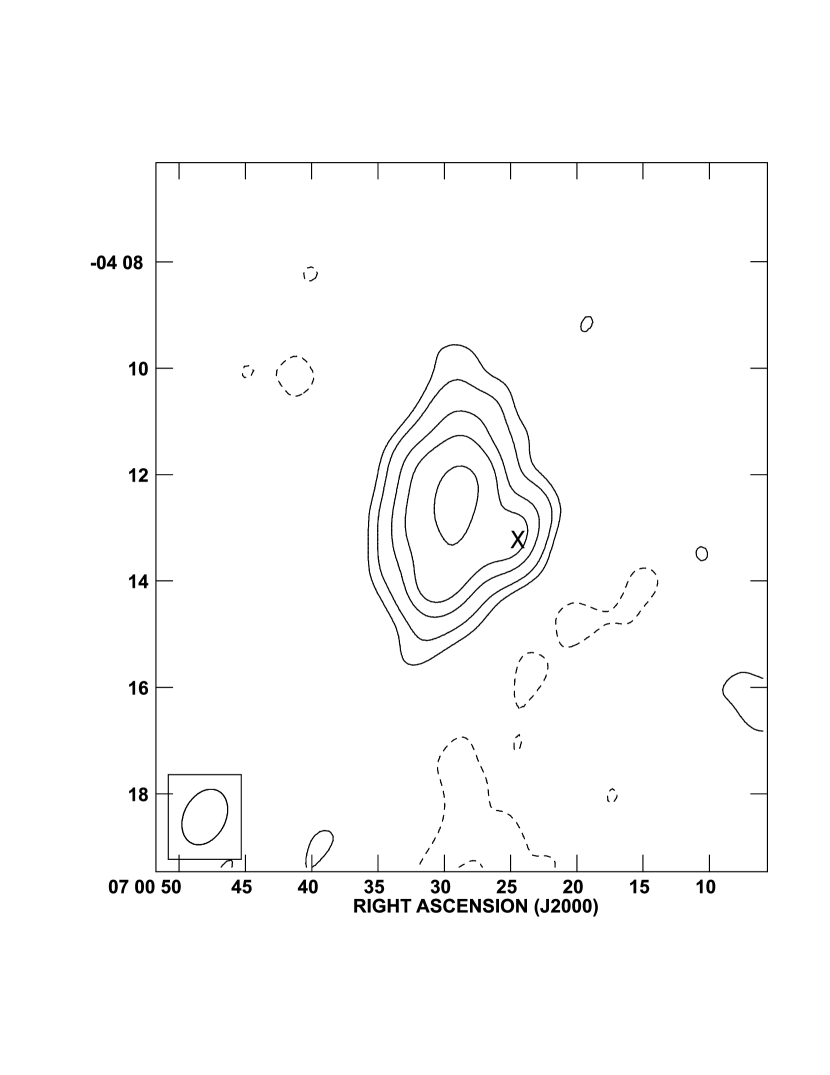
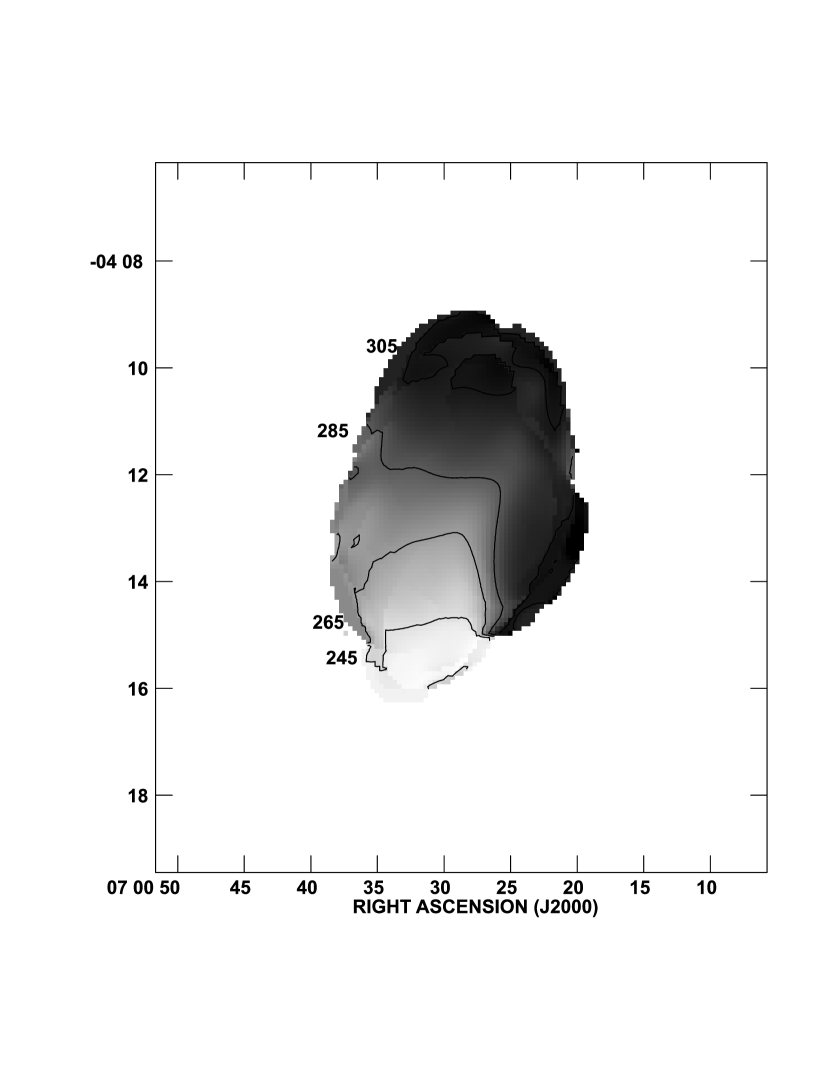
H I synthesis data were obtained with the VLA111The VLA is operated by the National Radio Astronomy Observatory, a facility of the National Science Foundation operated under cooperative agreement by Associated Universities, Inc. in 1999 as part of follow-up observations for the Dwingeloo project (Rivers 2000). A 30-minute observation was made in the compact D-array, and the maps were created using natural weighting of the visibilities. This produced an angular resolution, as measured by the half-power major and minor axes of the synthesized beam, of 66 47 arcsec. The velocity resolution obtained was 10 km s-1. Summing all channels containing H I emission produced the H I total intensity map presented as Fig. 1. Taking the estimated distance of 1.8 Mpc and the total integrated flux from these interferometric observations, measured within an H I column density of 1 M⊙ pc-2, of 24.9 Jy km s-1, the H I mass of this galaxy would be M⊙. The flux recovered with the single-dish Parkes survey was slightly higher: 32.1 Jy km s-1 (Henning et al. 2000), thus yielding a somewhat higher estimated H I mass, M⊙. (The slightly higher value is not unexpected, since the Parkes measurement was not cut off at the 1 M⊙ pc-2 column density level.) More accurate determination of the distance will be required to pin down its exact mass, although this at the low end of what is observed for late-type dwarfs (Swaters 1999). The H I diameter measured to the 1 M⊙ pc-2 level is 6 arcmin, corresponding to 3 kpc. The velocity field, shown in Fig. 2, indicates fairly uniform rotation. The velocity width measured at 20% of the peak flux density from these observations is 91 km s-1, consistent with the value of 85 km s-1 from the Parkes observations, and also consistent with HIZSS 3’s being a low-mass dIm galaxy.
The peak of the H I distribution is at , , with a heliocentric velocity of 280 km s-1.
2.2 Optical Identification
We expected difficulties in the optical identification due to the low galactic latitude and high foreground extinction: Henning et al. (2000) estimate mags based upon the DIRBE/IRAS extinction maps (Schlegel, Finkbeiner, & Davis 1998); i.e., mags. At the time we began our search for an optical counterpart (April 2003) the object was observable only for the first hour or so of the night.
Direct images were taken centered on the center of the VLA map with Lowell Observatory’s 1.1-m Hall telescope using a SITe 20482048 CCD on UT 8 and 9 April 2003. The CCD was binned for a scale of 1.13 arcsec pixel-1. The field of view was 19.4 arcmin by 19.4 arcmin.
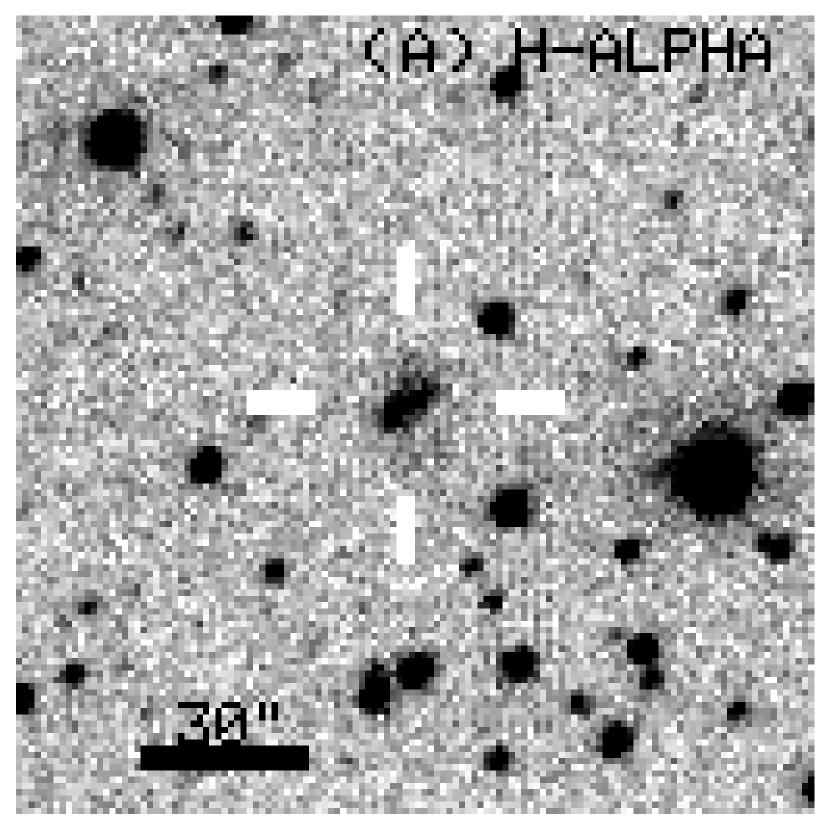
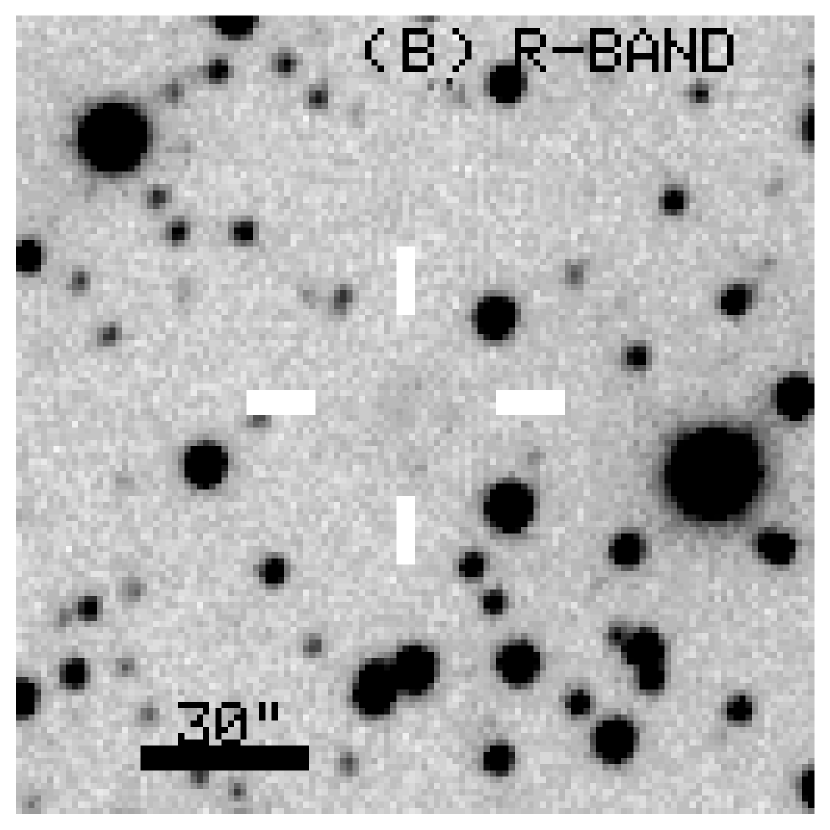
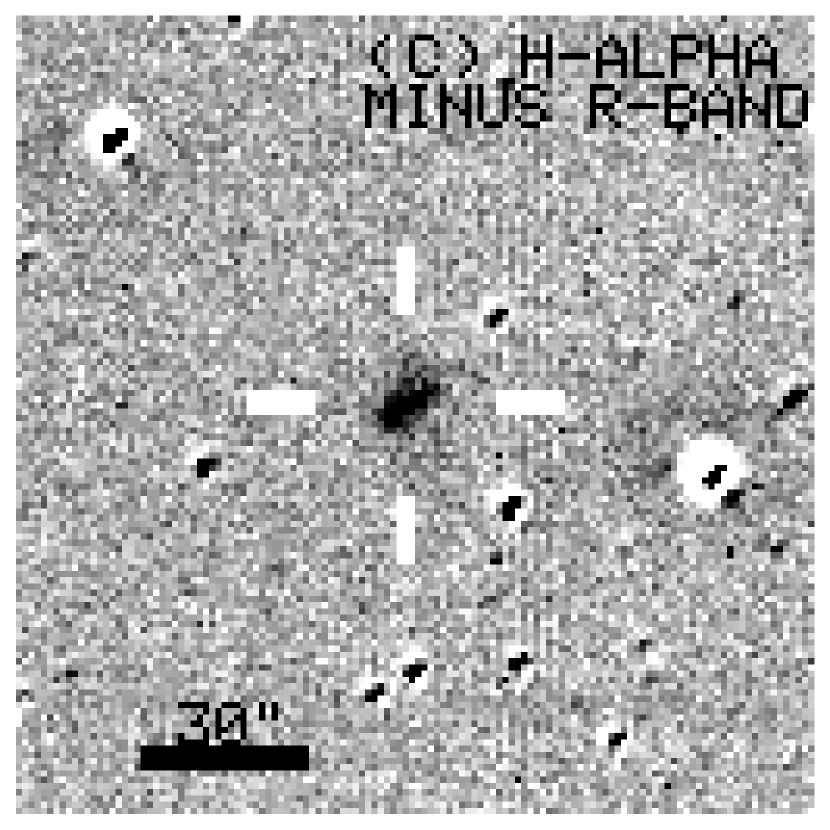
Broad-band BVRI images obtained on the first night failed to show anything other than the expanded swarm of foreground galactic stars. However, an H exposure on the second night clearly showed an extended object about 70 arcsec from the peak of the H I distribution. In Fig. 3 we compare the H image with an -band exposure. The H image (Fig. 3a) is the sum of four 15-minute integrations, while the R-band exposure (Fig. 3b) is the sum of 15 1-minute exposures, taken in this way to minimize saturation. The seeing on each frame was approximately 3 arcsecs, due in large part to the high airmass () of the observations. We also show in Fig. 3c the residual image obtained by subtracting the scaled R-band exposure from the H exposure after sky has been removed from each.
The H source is located at , . This places it within a partially-resolved secondary peak in the H I distribution evident in Fig. 1. We’ve marked the location of the H source with an “X” in Fig. 1. The H source is extended principally NW to SE, covering about 12 arcsecs. At a distance of 1.8 Mpc, this corresponds to a diameter of 100 pc, typical of the ionization region (Strömgren sphere) of a late O-type star (Spitzer 1968, with ne=10 cm-3) were it ionization-bounded. More likely the region is density bounded (as is the case with an older, evolved H II region), and the size is consistent with the smallest first-ranked H II regions in irregular galaxies (see Table 2 of Youngblood & Hunter 1999). Thus it may contain a modest population of OB stars. The bulge in the H I contours suggest a partially-resolved H I cloud, and hence a likely home for star formation.
We were able to calibrate the H image by observing several spectrophotometric standards and by knowing the filter characteristics. The H flux corresponds to ergs cm-2 s-1. If mags, then mags (Savage & Mathis 1979), and at a distance of 1.8 Mpc the H luminosity would be ergs s-1. This value is quite reasonable for the luminosity of the brightest H II regions within dwarf irregular galaxies (Youngblood & Hunter 1999), and is 14 times the H luminosity of the Orion nebula (Kennicutt 1984). No other H sources were found, either by blinking the frames or by examining a continuum-subtracted version of the H image.
The location and size of the H source is certainly suggestive of being part of HIZSS 3. However, we were concerned that this could instead be a foreground planetary nebula. To settle this matter, we obtained a spectrum of the H source using the KPNO 2.1-m telescope and GoldCam spectrometer on 17 April 2003. We used a 600 line mm-1 grating (No. 35) centered at , giving us coverage from at 1.24Å pixel-1. A GG400 filter was used to block out any second-order light. The slit of the spectrograph was rotated to a position angle of 45∘, near the parallactic angle, and perpendicular to the major extension. The slit width was set to 100m (1.3 arcsec) and provided 3.3Å resolution. The object was centered by a blind offset from a nearby star, and the exposure was hand-guided. Conditions were marginal, and only one full 1200 s exposure was obtained before the cirrus thickened; nevertheless, H emission was strongly present at the predicted location, with a signal level of 1500 e-. (A second exposure, terminated by clouds, showed emission at the same place.) A comparison He-Ne-Ar exposure was made both before and after the exposure. The spectrophotometric standard star Feige 34 was observed (through clouds) to provide relative flux calibration. The nebular spectrum was extracted using an exposure of the offset star to serve as a reference for the 2-dimensional mapping of the spectrum on the chip.
The spectrum is shown in Fig. 4. H is strong, and a weak feature may be [OIII] . The heliocentric radial velocity of H is measured to be 335 15 km s-1. This is in substantial agreement with the heliocentric 21-cm velocity map, which suggests a velocity of 300 km s-1 at that position (cf. Figs. 1 and 2), and confirms that the object we’ve identified in our H image is associated with HIZSS 3. The fact that the values for the diameter and luminosities of the H II region are quite reasonable gives gives additional support to our interpretation.
3 Discussion
Most recent discoveries of nearby galaxies have been of dwarf spheroid systems which are not presently active in forming stars. The presence of substantial gas in HIZSS 3, as well as a modest-size H II region, suggests that this is a dwarf irregular (dIm). As such, it is possibly the nearest dIm to be discovered in the past 25 years; i.e., since LGC 3 was found by Kowal, Lo, & Sargent (1978), and SagDIG was found by Cesarsky et al. (1977) and Longmore et al. (1978). Both of these are well-established to be Local Group members. (For more on the growth of our knowledge of the Local Group, see van den Bergh 2000.)
However, the properties of HIZSS 3 are most strongly reminiscent of those of another nearby dIm, GR 8. This galaxy was first cataloged by Reaves (1956) in a survey of dwarf galaxies seen towards Virgo, but Hodge (1967) found it was a much nearer object, possibly even in the Local Group. GR8’s optical appearance is dominated by a few bright H II regions, the largest of which has a diameter of 175 pc (Youngblood & Hunter 1999), somewhat greater than the 100 pc found for our H source. Carignan, Beaulieu, & Freeman (1990) find an H I diameter for GR 8 of about 2 kpc, about two-thirds of what we find for HIZSS 3. (We have adjusted these value to the 2.2 Mpc distance to GR 8 recommended by van den Bergh 2000, based upon newer distance measurements by Tolstoy et al. 1995 and Dohm-Palmer et al. 1998 using a Cepheid and the tip of the red giant branch, respectively.)
Could HIZSS 3 be a member of the Local Group? We have adopted a tentative distance to the galaxy of 1.8 Mpc based upon its radial velocity with respect to the Local Group centroid (LGC) of 134 km s-1, where we have adopted the solution for the solar apex and solar motion (with respect to the LGC) from Courteau & van den Bergh (1999)222Note that equation (6) in Courteau & van den Bergh (1999) is incorrect, and actually gives the correction to the LGC corresponding to the solution of Yahil, Tammann, & Sandage (1977). The equation for the Courteau & van den Bergh (1999) solution should read: . This may be compared to Sandage’s (1986) solution using more limited data. Sandage’s solution is expressed in terms of the motion of the LSR, but transformed to the sun’s motion corresponds to a velocity of 296 km s-1 towards . Thus . Adopting his solution for HIZSS 3 would lead to a velocity relative to the LGC of 120 km s-1, and hence a distance of 1.6 Mpc. and used a value for the Hubble constant km s-1 Mpc-1. Such a distance would place it well beyond the zero-velocity boundary of the Local Group. However, this relies upon the assumption that the HIZSS 3 has no peculiar velocity. In general, the velocities of nearby galaxies will be affected by the presence of their neighbors. However, the galaxies of the Local Group do show only modest peculiar motions. Yahil, Tammann, & Sandage (1977), Sandage (1986), and Courteau & van den Bergh (1999), among others, have all found similar solutions for the velocities of the sun with respect to the Local Group as a whole by minimizing the velocity residuals of well-established Local Group members. In Fig. 5 we show the heliocentric radial velocities of Local Group members (filled circles) and that of nearby non-members (open circles) as a function of , where is the angle from the solar apex. The solution found by Courteau & van den Bergh (1999) is shown by the solid line, and corresponds to a motion of the sun of 306 km s-1 towards . The 1 scatter about this solution is 61 km s-1, shown by the dashed lines. HIZSS 3 lies 134 km s-1 above the solid line, i.e., 2.1 from the mean relationship. Most of the galaxies above the (1) dashed lines are non-members (NGC 3109, Sex A, Sex B, GR 8), but not all: Leo I, in particular, is in a very similar location in this diagram. Measurements of the tip of the red giant branch (Lee et al. 1993) however firmly establish the distance of this galaxy as 270 kpc, about one-tenth one would infer from just its velocity. (The galaxy’s peculiar velocity is due to its proximity to the Milky Way.) While we don’t expect that HIZSS 3 to be equally close, as that would be inconsistent with both the properties of the H II region and the 21-cm width relative to the H I flux, its membership in the Local Group can not be ruled out on the basis of the current data. We conclude that HIZSS 3 is unlikely to be a member of the Local Group based upon its velocity, but emphasize the need for a better distance estimate.
Van den Bergh (2000) discusses galaxies on the outer fringes of the Local Group, and argues that Sextans A, Sextans B, NGC 3109, and Antlia form the nearest external group of galaxies beyond the Local Group (see also van den Bergh 1999). HIZSS 3 may be at a similar distance and does fall similarly above the LG relation in Fig. 5. However, HIZSS 3 is located 46∘-49∘ from these galaxies, or about 1 Mpc away in linear space. This is about twice as far as the separation between Sextans A and NGC 3109. We do not know very much about the characteristics of such small groups, and it seems conceivable, but unlikely, that HIZSS 3 is native to this group. The identification of other nearby galaxies in this region would be illuminating.
Followup observations of HIZSS 3 are planned for the next observing season. Of key interest will be the detection of its resolved stellar population, identification of other H II regions (if any), and the determination of nebular chemical abundances. (Spectroscopy of the nebula potentially will lead to an improved reddening estimate.) Measurements of an accurate distance would best be determined in the infrared from the tip of the red giant branch, as finding Cepheids (which vary most in the blue) will be greatly hindered by foreground extinction.
References
- (1)
- (2) Carignan, C., Beaulieu, S., & Freeman, K. C. 1990, AJ, 99, 178
- (3)
- (4) Cerarsky, D. A., Laustsen, S., Lequeux, J., Schuster, H.-E., & West, E. M. 1977, A&A 61, L31
- (5)
- (6) Courteau, S., & van den Bergh, S. 1999, AJ, 118, 337
- (7)
- (8) Dohm-Palmer et al. 1998, AJ, 116, 1227
- (9)
- (10) Henning, P. A., Kraan-Korteweg, R. C., Rivers, A. J., Loan, A. J., Lahav, O., & Burton W. B. 1998 AJ 115, 584
- (11)
- (12) Henning, P. A. et al. 2000, AJ, 119, 2686
- (13)
- (14) Hodge, P. W. 1967, ApJ 148, 719.
- (15)
- (16) Hunter, D. A. 1997, PASP, 109, 937
- (17)
- (18) Jarrett, T. H., Chester, T., Cutri, R., Schneider, S., Skrutskie, M., & Huchra, J. P. 2000, AJ, 119, 2498
- (19)
- (20) Karachentsev, I. D., et al. 2002, A&A 389, 812
- (21)
- (22) Kerr, F. J., & Henning, P. A. 1987, ApJ, 320, L99
- (23)
- (24) Kowal, C., Lo, K. Y., & Sargent, W. L. W., 1978, IAU Circ. No. 3305
- (25)
- (26) Kraan-Korteweg, R. C. 1986, A&AS, 66, 255
- (27)
- (28) Kraan-Korteweg, R. C., Loan, A. J., Burton, W. B., Lahav, O., Ferguson, H. C., Henning, P. A., & Lynden-Bell, D. 1994, Nature, 372, 77
- (29)
- (30) Lee, M. G., Freedman, W. L., Mateo, M., Thompson, I., Roth, M., & Ruiz, M.-T. 1993, AJ, 106, 1420
- (31)
- (32) Longmore, A. J., Hawarden, T. G., Webster, B. L., Goss, W. M., & Mebold, U. 1978, MNRAS, 183, 97p
- (33)
- (34) Massey, P. 2003, ARA&A, 41, 15
- (35)
- (36) Mateo, M. L. 1998, ARA&A, 36, 435
- (37)
- (38) Peebles, P. J. E., Phelps, S. D., Shaya, E. J., & Tully, R. B. 2001 ApJ, 554, 104
- (39)
- (40) Reaves, G. 1956, AJ, 61, 69
- (41)
- (42) Rivers A. J., Henning, P. A., & Kraan-Korteweg, R. C. 1999, Publ. Astron. Soc. Australia, 16, 48
- (43)
- (44) Rivers, A. J. 2000, Ph. D. thesis, Univ. of New Mexico
- (45)
- (46) Sandage, A. 1986, ApJ, 307, 1
- (47)
- (48) Savage, B. D., & Mathis, J. S. 1973, ARAA, 17, 73
- (49)
- (50) Schlegel, D. J., Finkbeiner, D. P., & Davis, M. 1998, ApJ, 500, 525
- (51)
- (52) Spitzer, L. 1968, Diffuse Matter in Space (New York: John Wiley), 117
- (53)
- (54) Swaters, R. 1999, Ph. D. thesis, Rijksuniversiteit Groningen
- (55)
- (56) Tolstoy, E., Saha, A., Hoessel, J. G., & Danielson, G. E. 1995, AJ, 109, 579
- (57)
- (58) van den Bergh, S. 1999, ApJ 517, L97
- (59)
- (60) van den Bergh, S. 2000, The Galaxies of the Local Group (Cambridge: Cambridge University Press)
- (61)
- (62) Yahil, A., Tammann, G. A., & Sandage, A. 1977, ApJ, 217, 903
- (63)
- (64) Youngblood, A. J., & Hunter, D. A. 1999, ApJ, 519, 55
- (65)
| Property | Value |
|---|---|
| (H I peak) | |
| Galactic coords. | 217.71∘, |
| Heliocentric radial velocity (H I peak) | 280 km s-1 |
| Radial velocity wrt Local Group centroid | 134 km s-1 |
| Inferred distance ( km s-1 Mpc-1) | 1.8 Mpc |
| H I velocity width (20% peak intensity), single-dish (Parkes) | 85 km s-1 |
| H I velocity width (20% peak intensity), VLA | 91 km s-1 |
| H I diameter (angular) | 6’ |
| H I diameter (linear, for 1.8 Mpc distance) | 3 kpc |
| Integrated 21-cm flux-density, single-dish (Parkes) | 32.1 Jy km s-1 |
| H I mass (for 1.8 Mpc distance),single-dish (Parkes) | M⊙ |
| Estimated foreground | 1.1 mags |
| (HII region) | |
| H II region diameter (angular) | 12” |
| H II region diameter (linear, for 1.8 Mpc distance) | 100 pc |
| H II region H flux | ergs cm-2 s-1 |
| H II region H luminosity (for 1.8 Mpc distance) | ergs s-1 |