Optical Identification of the ASCA Lynx Deep Survey: An Association of QSOs and a Supercluster at ?111 Based on observations made with the Kiso Observatory, which is operated by Institute of Astronomy, the University of Tokyo, with the Kitt Peak National Observatory 2.1m and 4m telescopes, which are operated by National Optical Astronomy Observatories (NOAO) operated by AURA, Inc., under contract with the National Science Foundation, with the University of Hawaii 88” telescope, and with the William Herschel Telescope operated on the island of La Palma by the Isaac Newton Group in the Spanish Observatorio del Roque de los Muchachos of the Instituto de Astrofisica de Canarias.
Abstract
Results of optical identification of the ASCA Lynx deep survey are presented. Six X-ray sources are detected in the 2–7 keV band using the SIS in a field of view with fluxes larger than erg s-1 cm-2 in the band. Follow-up optical spectroscopic observations were made, and five out of six sources are identified with AGNs/QSOs at redshifts of 0.5 – 1.3. We also identify two more additional X-ray sources detected in a soft X-ray band with AGNs/QSOs. It is found that three QSOs identified are located at . Two rich clusters and several groups of galaxies are also placed at the same redshift in the surveyed field, and projected separations between the QSOs and the clusters are 3–8 Mpc at the redshift.
1 INTRODUCTION
The optical identification of X-ray sources is an important step to reveal cosmological evolution of AGN/QSOs as well as the evolution of super-massive black holes harbouring in their host galaxies. It is also a direct way to solve the origin of cosmic X-ray background (CXB). Although many optical identifications of soft X-ray selected samples have been already made (e.g., McHardy et al. 1998; Lehmann et al. 2001), it is essential to use a hard X-ray selected sample, because the energy of the CXB peaks at around 20 keV and the bulk of the CXB energy is thought to come from moderately obscured ( cm-2) type-2 AGNs (e.g., Comastri et al. 1995; Ueda et al. 2003). The soft X-ray emission such as in the 0.2 – 2 keV band, which was used in the ROSAT surveys, is insensitive to sources with such high column densities, which can only be detected in the harder X-ray bands. Therefore the optical identification of X-ray sources selected in a hard X-ray band (e.g., 2–10 keV) is required to examine the evolution of type-1 and -2 AGNs and to solve the origin of the CXB.
In this context, we have been pursuing optical follow-up spectroscopy of hard X-ray selected sources. Akiyama et al. (2000) obtained optical identifications for the X-ray sources detected by ASCA with a flux larger than erg s-1 cm-2 in a 2-10 keV band (Ueda et al. 1999). The survey area was a contiguous sky area ( deg2) near the north Galactic pole, and we identified 33 X-ray sources among 34 sources. We have obtained further optical identifications of a subsample of the ASCA Medium Sensitivity Survey (Ueda et al. 2001). The survey is a serendipitous source survey making use of many ASCA pointing observations made during a three year period; from this catalog we selected 87 hard X-ray selected sources and have identified all of them (Akiyama et al. 2003). Although these surveys are shallower by about two orders of magnitude than those made by Chandra and XMM-Newton, the resultant catalogs cover the flux level between these very deep surveys and the much shallower survey previously made by HEAO1 ( erg s-1 cm-2 in the 2–10 keV band), and our catalogs play a unique role to investigate the cosmological evolution of AGN/QSOs; the evolution of the luminosity function in hard X-ray band, the luminosity dependence of the distribution, and the origin of the CXB (e.g., La Franca et al. 2002; Cowie et al. 2003; Ueda et al. 2003).
In this paper, we report results of our optical identification for the ASCA Lynx deep survey. Our survey covers a wider field than the Chandra survey of Stern et al. (2002) made in 2000 May. The optical identification of the Stern et al. Lynx survey remains incomplete, with only a relatively small number of sources having been identified. We therefore believe that adding further optical identifications for hard X-ray band selected AGN/QSOs with a flux level of erg s-1 cm-2 (2–10 keV) would be still valuable and useful, though our sample size is very small. Preliminary results were presented by Ohta et al. (1998), and a particularly interesting result concerning a discovery of a type-2 QSO candidate was described by Ohta et al. (1996) (with subsequent results by Akiyama, Ueda, & Ohta (2002)).
2 X-RAY DATA
The ASCA deep observation of the Lynx field was performed from 1993 May 13 12:55 (UT) to May 15 19:13. We here concentrate on the data of the SIS instrument (Burke et al. 1991), which was operated in the 4-CCD Faint Mode. The total field of view (FOV) covered by the SIS0 and SIS1 had roughly a square shape with corners corresponding to (RA, DEC(J2000)) = (, ), (, ), (, ), and (, ). A total survey area was about 530 arcmin2. An average net exposure of 82 ksec (per one CCD) was obtained after standard data screening. We made sky images in the 3 energy bands, 0.7–7 keV, 0.7–2 keV, and 2–7 keV, from events of grade 0, 2, 3, and 4, discarding the very edge regions of each chip to avoid complexity due to satellite-attitude fluctuations. Note that the sensitivity was not uniform over the FOV also because of vignetting and gaps between the CCD chips. We calibrated the absolute fluxes by a correction factor of 10% so that they match with those obtained by the GIS (Ohashi et al. 1996), referring to the results of the CXB spectrum analysis from the same data by Miyaji et al. (1997).
To produce an X-ray source list, we adopted the same procedure as applied to the ASCA deep survey data in the Lockman hole field (Ishisaki et al. 2001), which utilized the positions of ROSAT sources. In this method we did not perform source detection initially. Instead, we determined fluxes at positions of known (soft) X-ray sources, utilizing the image fitting method where the detector response was taken into account (Ueda et al. 1999). This technique is effective to minimize source confusion when we have sufficiently deep (and wide FOV) ROSAT data. Analysis was made in the three energy bands. For the initial source list we adopted the WGA catalog of PSPC sources (White, Giommi, & Angelini 1994) available from the HEASARC database. We then repeated the fitting process by adding new sources to the input list when any significant peaks were found in the residual image. This procedure was iterated until we confirmed that there was no significant source above 3.5 .
Table 1 gives the complete X-ray source list from the ASCA observation, containing sources detected with significance above 3.5 in any of the three bands, sorted by RA and DEC. The count rate has been converted into the energy flux of the same band by assuming a power law photon index of 1.6. There are two sources detected with ASCA but not with ROSAT. The positional errors of these ASCA only sources are conservatively estimated at .
From this list, we defined a hard-band selected sample consisting of 6 sources significantly (larger than 3.5) detected in the 2–7 keV band, which are marked with * in Table 1. Using the Chandra archival data, we made spectral analysis of the three sources (No. 1, No. 9, and No. 11) from this sample which are located within the Chandra FOV. We corrected the level-1 event data for the Charge Transfer Inefficiency using the technique developed by Townsley et al. (2000) and used the appropriate energy response. Spectral fits were performed using the redshift information from optical identification described below. The type-2 quasar candidate AX J08494+4454 (No. 11) shows a large absorption of cm-2 (Akiyama et al. 2002), while the other two (No. 1 and No. 9) show a power law with almost no absorption over that expected from the Galaxy. The results are summarized in Table 2.
3 OPTICAL IDENTIFICATION
In order to identify candidate optical counterparts of the ASCA sources, we conducted optical imaging observations with Kiso 1.05m Schmidt telescope with a Tek CCD on January 1995 and follow-up deeper band imaging observations with a Tek CCD attached to the University of Hawaii 88′′ telescope on March 1995 and April 1996. In the latter observations, one CCD pixel corredponded to 0.′′22 and a seeing (FWHM) during the observing runs was typically 1.′′5. Exposure times were between 5 and 20 minutes. Landolt’s standard stars (Landolt 1992) were also observed a few times in each night.
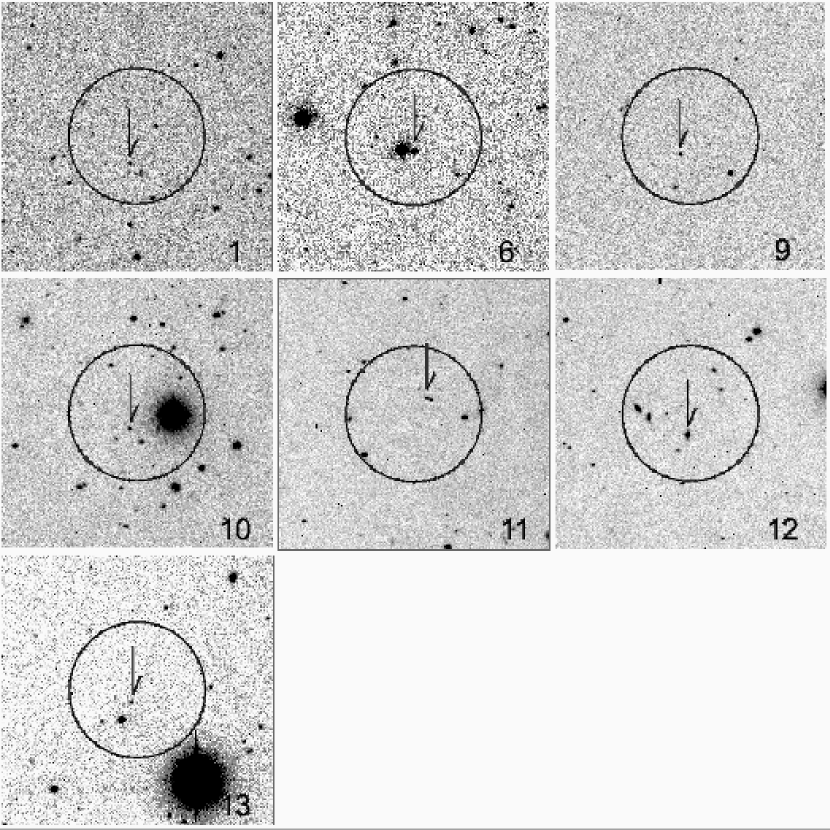
The -band images for the hard-band selected sources are shown in Figure 1, with the exception of source No. 2, for which we do not have imaging data. We also show images for No. 6 and No. 13, which are not hard X-ray selected objects, but which were identified in the following spectroscopic observations. The large circle in each image indicates the error circle of the X-ray source.
We conducted optical spectroscopy of the optical candidates with the Gold Camera Spectrograph on the Kitt Peak National Observatory (KPNO) 2.1m telescope in February 1995. We used a grating of 158 mm-1 blazed at 6750Å and a WG345 filter for the order cut. A wavelength range from 5000Å to 10000Å was covered with a spectral resolution of 13Å. The slit width was 2′′. One CCD pixel corresponded to 2.5 Å for the dispersion direction and 0.′′78 for the spatial direction. The typical seeing during the observations was . We also conducted optical spectroscopic observations with the multislit spectrograph (CryoCam) on the KPNO Mayall 4m telescope in April 1996. We used the grism 730 to covere a spectral range from 6000 Å to 9000 Å with a spectral resolution of 22 Å. The slit width used was 2.. One CCD pixel corresponded to 4.3 Å and 0.. The seeing was typically 1.
We took spectra of candidates of optical counterparts of all the hard-band selected sources, except for No. 2. We also observed two additional sources (No. 6 and No. 13), though they are not hard band selected objects (their significance levels in the hard band are 3.0 and 3.1.) An exposure time of each frame in these observations was 20–30 minutes. A total exposure time for each target ranged from 30 to 90 minutes. In all spectroscopic observations including those described below, we took spectra of KPNO spectrophotometric standard stars. The data were reduced with the usual manner using IRAF; after debiasing, the flat fielding was carried out and the wavelength calibration was made using HeNeAr lamp data. The background was subtracted with BACKGROUND task and a sensitivity correction was applied using spectra of the spectrophotometric standard stars. Finally, the spectrum of the target object was extracted using APALL task by tracing the spectral continuum.
In these observations, we found an object which showed AGN-like emission lines for each of the X-ray sources. Some of them showed only one broad emission line. They are marked with arrows in Figure 1, and their coordinates and optical magnitudes are listed in Table 2. Astrometry was done using APM catalog (Irwin, Maddox, & McMahon 1994). The -band magnitude was derived using Landolt’s standard stars and the photometric error is estimated to be 0.03 mag to 0.2 mag. Magnitudes of three of them are given by Stern et al. (2002) and agree with our magnitudes within the errors.
In order to obtain higher SN spectra and achieve secure redshift determination with additional emission lines, we obtained further spectroscopic observations with the Wide Field Grism Spectrograph (WFGS) on the UH88′′ in March 1998, and the ISIS spectrograph on the 4.2m William Herschel Telescope (WHT) in December 1998 (service observation). No. 1, No. 9, No. 10, and No. 12 were observed with the WFGS with a grating of 420 mm-1 blazed at 6400Å. A slit width of 1. was used. The spatial sampling was 0. pixel-1, and the seeing size was typically 1′′. The wavelength range from 4000Å to 9000Å was covered with a spectral resolution of 12Å. No. 10 and No. 13 were observed with the ISIS two beam spectrograph with R300B and R158R gratings on the blue and red arms, respectively. In combination with the two arms, a wavelength range from 3300Å to 8000Å was covered with spectral resolutions of 6Å (blue) and 10Å (red). A total exposure time was 20 minutes for each of the target. The data were reduced in the same way as described above. In order to improve the signal-to-noise ratios for No. 1 and No. 12, we averaged two one-dimensional spectra obtained in different observing runs (UH88′′ and KPNO 4m for No. 1 and UH88′′ and KPNO 2.1m for No. 12) after adjusting the differences of spectral resolutions by convolving Gaussian kernels.
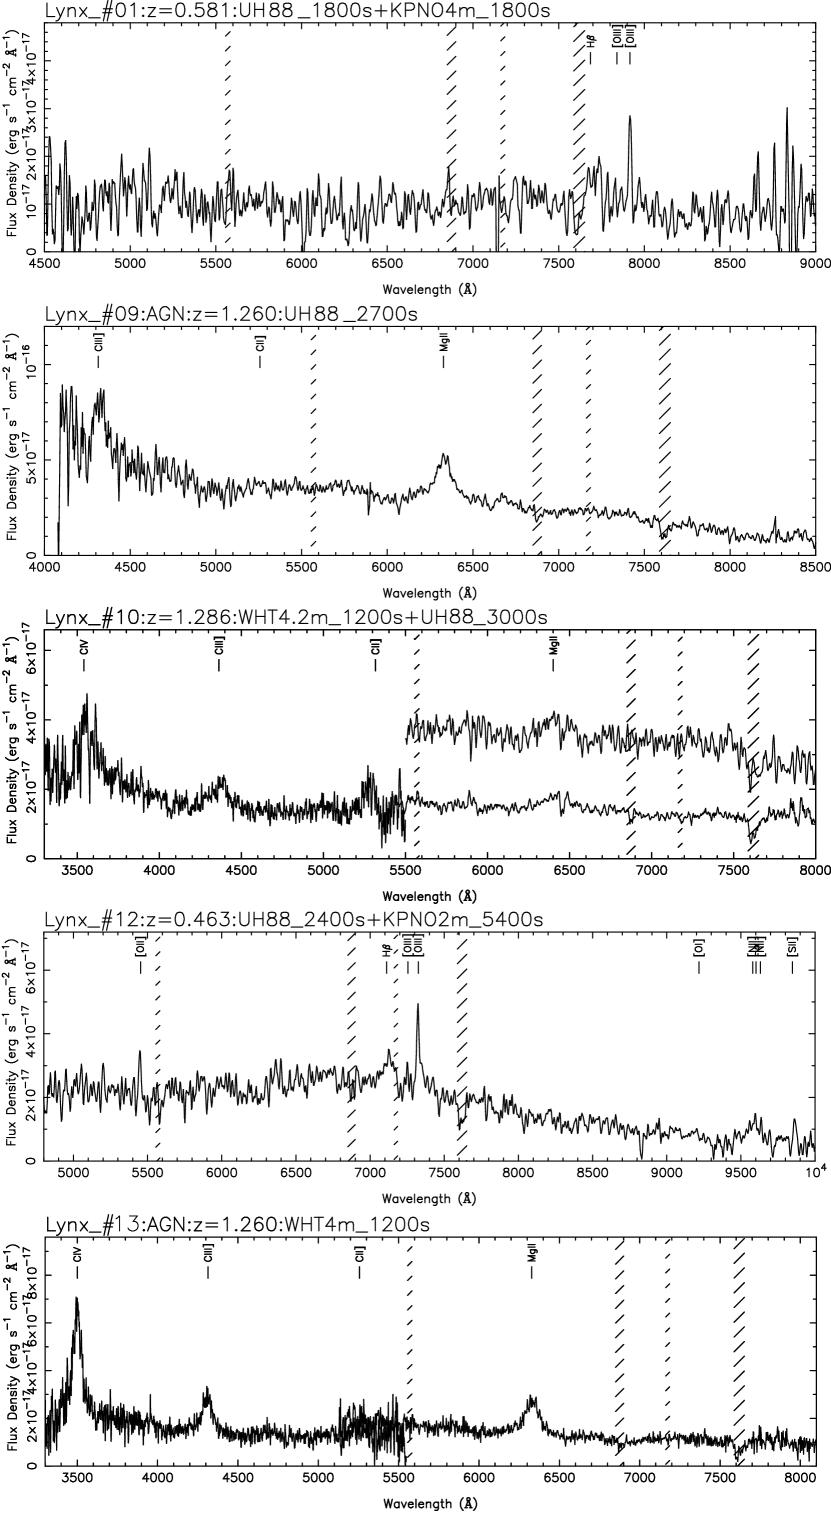
The resultant optical spectra of the counterparts of the hard X-ray selected objects are shown in Figure 2. Object No. 1 shows an H emission line and an [OIII]5007 emission line. Although the signal-to-noise ratio is not so good, we measured a line width of the H emission line to be km s-1, thus identified it with a broad emission line. The redshift obtained is 0.581. No. 9 shows a broad (9200 km s-1) MgII2800 emission line and a CIII]1909 emission line with a redshift of 1.260. No. 10 shows broad (14000 km s-1) MgII2800, CII]2326, CIII]1909, and CIV1549 emission lines. The redshift is 1.286. In the MgII2800 emission line, there seems to be an absorption feature. No. 11 has a very hard X-ray spectrum and is identified with a type-1.9 QSO at , showing narrow H, strong [OIII]4959/5007, and [NeV]3426 as well as some other [NeIII] lines (Ohta et al.1996), but showing a broad H emission (Akiyama et al. 2002). We do not reproduce the spectrum of this object in this paper. No. 12 shows a broad H emission line ( km s-1) and a strong [OIII]5007 and is identified with an AGN at . [OII]3727 is also seen clearly. The results are summarized in Table 2. In Table 2, an X-ray luminosity refers to an intrinsic luminosity in the rest-frame 2–10 keV band after correcting absorption by using an SIS 2–7 keV count rate and the photon indices listed in Table 2. We adopt a cosmological parameter set of km s-1 Mpc-1, , and . These X-ray luminosities are used by Ueda et al. (2003).
We also took optical spectra of No. 6 and No. 13 with KPNO 2.1m and WHT, respectively. No. 6 shows broad H and strong [OIII]4959/5007 lines as well as H, H, [NeIII]3869, and [OII]3727 with a redshift of 0.573. This object is also identified by Rosati et al. (1999) and in Stern et al. (2002) as an AGN (ID number of 39 by Stern et al. 2002). Stern et al. (2002) show its optical spectrum with a better S/N and we do not show our spectrum here. No. 13 is identified with a QSO at with broad MgII2800, CIII]1909, and CIV1549 emission lines. Its spectrum is shown in Figure 2. The properties are also summarized in Table 2. We note that No. 5 is identified with a cluster of galaxies at by Vikhlinin et al. (1998) and by Rosati et al. (1999), and a more detail study of this cluster is presented by Holden et al. (2001).
4 A QSO – SUPERCLUSTER ASSOCIATION AT ?
We found three QSOs at in the surveyed field of , which spans Mpc Mpc at ( Mpc at the present epoch). The redshift difference of corresponds to a comoving depth of 54 Mpc. An expected number of QSOs with X-ray luminosities larger than erg s-1 (2–10 keV) in this volume is , if we adopt the X-ray luminosity function in the 2–10 keV band at recently obtained by Ueda et al. (2003). Thus the density of QSOs in this field is very much high. Similar overdensities of X-ray sources are found by for example Gilli et al. (2003) in the Chandra deep field south. They found density peaks in a region of physical size 7 Mpc with a depth of , although the X-ray luminosities seem to be small when compared with our case. They also point out a correlation between spikes in distribution of X-ray sources and those of galaxies surveyed in the -band.
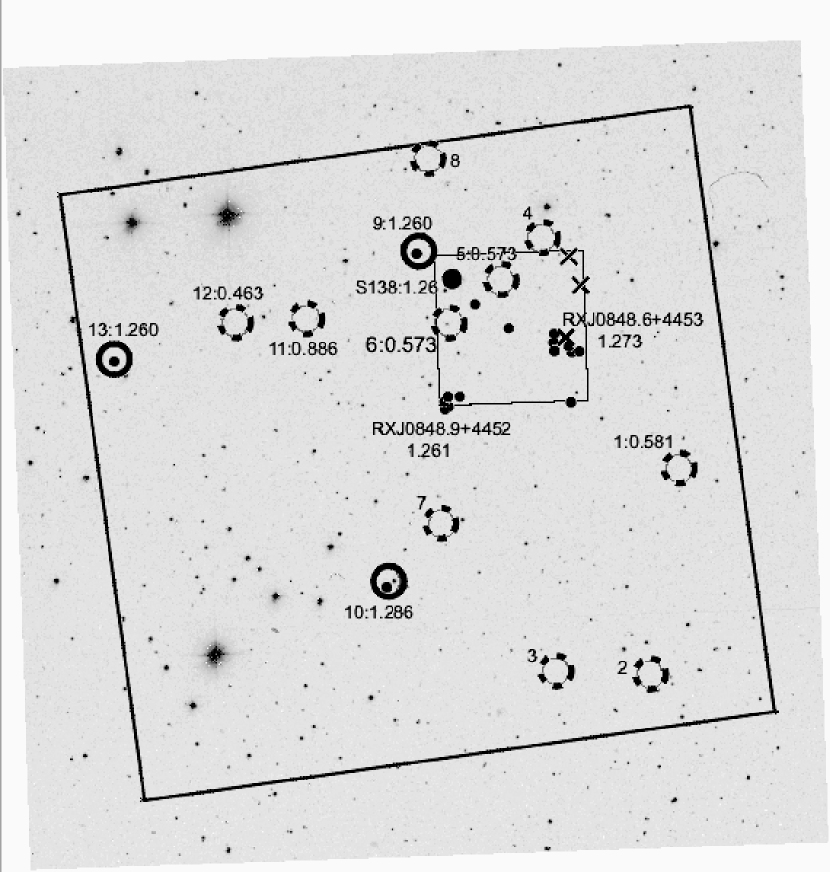
In the Lynx field, the presence of two rich clusters at and 1.27 is known (Stanford et al. 1997; Rosati et al. 1999). The positions (J2000) of these two clusters are RA and Dec, and RA and Dec, respectively. The distribution of the three QSOs and the two clusters (cluster members) are shown in Figure 3 together with the positions of other ASCA sources. Angular separtions of the three QSOs from these clusters are , corresponding to Mpc at the distance and to comoving separations of Mpc. Furthermore, seven groups of red galaxies with are found around the two rich clusters (Nakata et al. 2002). No. 9 is located at an edge of their group 2 (gr2) and No. 10 near their group 3 (gr3). No. 13 is out of their field (25). These groups seem constitute a supercluster together with the two rich clusters (Nakata et al. 2002) and with the QSOs which reside on the outskirts, avoiding the central region of the supercluster.
Associations of QSOs and clusters were reported by Tanaka et al. (2001) and by Haines et al. (2001) at . In these studies, QSOs exhibit a rather clumpy distribution, with a scale of 20′–30′ in a wider degree field. Clusters are found close to the QSO structure and have a scale of 1′–2′. The feature is similar to our case, though the luminosities of the QSOs in the Lynx field are slightly smaller. More recently, a similar trend has been found by Pentericci et al. (2002) at ; their field contains two or more QSOs in a field centered on a radio galaxy. Their field size is smaller than our field and their AGNs have slightly smaller X-ray lumiosities than our three QSOs. In the lower redshift universe (), similar associations of AGN/QSOs with a cluster have been claimed (e.g., Cappi et al. 2001; Martini et al. 2002; Molnar et al. 2002). The assocication of QSOs and rich clusters on large scales seems to be a rather general feature, suggesting that detailed studies could shed light on the link between star-formation activity and the environmental effect of QSO activity.
This research has made use of data obtained through the High Energy Astrophysics Science Archive Research Center Online Service, provided by the NASA-Goddard Space Flight Center. Optical follow-up program was supported by grants-in-aid from the Ministry of Education, Science, Sports and Culture of Japan (06640351, 08740171, 09740173) and from the Sumitomo Foundation.
References
- Akiyama et al. (2000) Akiyama, M., et al. 2000, ApJ, 532, 700
- Akiyama et al. (2002) Akiyama, M., Ueda, Y., & Ohta, K. 2002, ApJ, 567, 42
- Akiyama et al. (2003) Akiyama, M., Ueda, Y., Ohta, K., Takahasi, T., & Yamada, T. 2003, ApJS, in press
- Burke et al. (1991) Burke, B.E., Mountain, R.W., Harrison, D.C., Bautz, M.W., Doty, J.P., Ricker, G.R., & Daniels, P.J. 1991, IEEE-ED, 38, 1069
- Capi et al. (2001) Cappi, M., et al. 2001, ApJ, 548, 624
- Comastri et al. (1995) Comastri, A., Setti, G., Zamorani, G., & Hasinger, G. 1995, A&A, 296, 1
- Cowie et al. (2003) Cowie, L.L., Barger, A.J., Bautz, M.W., Brandt, W.N., & Garmire, G.P. 2003, ApJ, 584, L57
- Gilli et al. (2003) Gilli, R., et al. 2003, ApJ, in press (astro-ph/0304177)
- Haines et al. (2001) Haines, C.P., Clowes, R.G., Campusano, L.E., & Adamson, A.J. 2001, MNRAS, 323, 688
- Holden et al. (2001) Holden, B.P., et al. 2001, AJ, 122, 629
- Irwn et al. (1994) Irwin, M., Maddox, S., & McMahon, R.M. 1994, Spectrum, 2, 14
- Ishisaki et al. (2001) Ishisaki, Y., Ueda, Y., Yamashita, A., Ohashi, T., Lehmann, I., & Hasinger, G. 2001, PASJ, 53, 445
- La Franca et al. (2002) La Franca, F., et al. 2002, ApJ, 570, 100
- Landolt (1992) Landolt, A.U. 1992, AJ, 104, 340
- Lehmann et al. (2001) Lehmann, I., et al. 2001, A&A, 371, 833
- Martini et al. (2002) Martini, P., Kelson, D. D., Mulchaey, J. S., Swara, R., & An, J. H. 2002, ApJ, 576, L109
- McHardy et al. (1998) McHardy, I., et al. 1998, MNRAS, 295, 641
- Miyaji et al. (1997) Miyaji, T., Connolly, A.J., Szalay, A.S., & Boldt, E. 1997, A&A, 323, L37
- Molnar et al. (2002) Molnar, S. M., Hughes, J. P., Donahue, M., & Joy, M. 2002, ApJ, 573, L91
- Nakata et al. (2002) Nakata, F., et al. 2002, in Proc. IAU 8th Asian-Pacific Regional Meeting, vol. II, ed. S. Ikeuchi, J. Hearnshaw, & T. Hanawa, 283
- Ohashi et al. (1996) Ohashi, T., et al. 1996, PASJ, 48, 157
- Ohta et al. (1996) Ohta, K., Yamada, T., Nakanishi, K., Ogasaka, Y., Kii, T., & Hayashida, K. 1996, ApJ, 458, L57
- Ohta et al. (1998) Ohta, K., Yamada, T., Akiyama, M., Nakanishi, K., Hayashida, K., Kii, T., & Ogasaka, Y. 1998, Astron. Nachr., 319, 71
- Pentericci et al. (2002) Pentericci, L., Kurk, J.D., Carilli, C.L., Harris, D.E., Miley, G.K., & Röttgering, H.J.A. 2002, A&A, 396, 109
- Rosati et al. (1999) Rosati, P., Stanford, S.A., Eisenhardt, P.R., Elston, R., Spinrad, H., Stern, D., & Day, A. 1999, AJ, 118, 76
- Stanford et al. (1997) Stanford, S.A., Elston, R., Eisenhardt, P.R., Spinrad, H., Stern, D., & Dey, A. 1997, AJ, 114, 2232
- Stern et al. (2002) Stern, D., et al. 2002, AJ, 123, 2223
- Tanaka et al. (2001) Tanaka, I., Yamada, T., Turner, E.L., & Suto, Y. 2001, ApJ, 547, 521
- Townsley et al. (2000) Townsley, L.K., Broos, P.S., Garmire, G.P., & Nousek, J.A. 2000, ApJ, 534, L139
- Ueda et al. (2003) Ueda, Y., Akiyama, M., Ohta, K., & Miyaji, T. 2003 submitted to ApJ
- Ueda et al. (1999) Ueda, Y., et al. 1999, ApJ, 518, 656
- Ueda et al. (2001) Ueda, Y., Ishisaki, Y., Takahashi, T., Makishima, K., & Ohashi, T. 2001, ApJS, 133, 1
- Vikhlinin et al. (1998) Vikhlinin, A., McNamara, B.R., Forman, W., Jones, C., Quintana, H., & Hornstrup, A. 1998, ApJ, 502, 558
- White, Giommi, and Angelini (1994) White, N.E., Giommi, P., & Angelini, L. 1994, IAU circular, 6100
| No.aaSource number defined in this paper. Sources with * belong to the hard-band selected sample (above 3.5 in the 2–7 keV band). | Position (J2000)bbThe positions from the WGA ROSAT-PSPC catalog (White et al. 1994) except for those flagged with †, which are detected only with ASCA. The ASCA positional error is conservatively in radius. | Flux ( erg cm-2 s-1)ccFlux in each energy band corrected for Galactic absorption of = cm-2. It is converted from the observed count rate in the same band assuming a photon index of 1.6. | Significance | |||
|---|---|---|---|---|---|---|
| R.A. | DEC. | 0.7-7 keV | 0.7-2 keV | 2-7 keV | 0.7-7/0.7-2/2-7 keV | |
| 1* | 132.0404 | 44.8206 | 0.800.10 | 0.220.04 | 0.700.12 | 8.4/5.9/6.1 |
| 2* | 132.0667 | 44.6926 | 0.360.09 | 0.070.03 | 0.440.11 | 4.3/2.1/4.0 |
| 3† | 132.1491 | 44.6947 | 0.340.08 | 0.110.03 | 0.250.10 | 4.3/3.5/2.6 |
| 4 | 132.1604 | 44.9643 | 0.370.09 | 0.120.03 | 0.250.10 | 4.3/3.4/2.5 |
| 5 | 132.1967 | 44.9381 | 0.340.09 | 0.170.04 | 0.090.09 | 3.8/4.1/1.0 |
| 6 | 132.2421 | 44.9114 | 0.640.09 | 0.260.04 | 0.270.09 | 7.5/7.1/3.0 |
| 7 | 132.2492 | 44.7863 | 0.310.09 | 0.070.03 | 0.320.11 | 3.6/2.3/2.9 |
| 8 | 132.2604 | 45.0135 | 0.590.15 | 0.130.06 | 0.650.19 | 4.0/2.1/3.4 |
| 9* | 132.2692 | 44.9564 | 0.720.10 | 0.260.04 | 0.450.12 | 7.0/5.9/3.9 |
| 10* | 132.2967 | 44.7502 | 0.640.09 | 0.240.03 | 0.360.10 | 7.5/6.8/3.7 |
| 11*† | 132.3679 | 44.9142 | 0.430.08 | 0.070.03 | 0.540.10 | 5.6/2.3/5.4 |
| 12* | 132.4304 | 44.9115 | 1.290.10 | 0.460.04 | 0.830.12 | 12.7/10.8/7.2 |
| 13 | 132.5367 | 44.8889 | 0.810.14 | 0.300.06 | 0.500.16 | 5.9/5.2/3.1 |
| No.aaSource with an asterisk (*) is a hard band selected object. | Position (J2000)bbInternal error of the possition is . Our declination values are systematically larger () than those of Chandra sources by Stern et al. (2002), presumably due to a differnce of adopted astrometric catalog. | Type | cc and photon index for No. 1, No. 9, and No. 11 are derived using Chandra archive data (see the text). For other sources, either or photon index is derived with the procedure adopted by Ueda et al. (2003) from the two-band hardness ratio of the SIS data (i.e., a value of either or photon index is assumed). Errors are 1 for a single parameter. | Photon | (2-10 keV)ddIntrinsic rest-frame luminosity after correcting for , calculated from the SIS 2–7 keV count rate with the best-fit spectral parameters. | ID number | |||
|---|---|---|---|---|---|---|---|---|---|
| R.A. | DEC. | (mag) | ( cm-2) | indexcc and photon index for No. 1, No. 9, and No. 11 are derived using Chandra archive data (see the text). For other sources, either or photon index is derived with the procedure adopted by Ueda et al. (2003) from the two-band hardness ratio of the SIS data (i.e., a value of either or photon index is assumed). Errors are 1 for a single parameter. | ( erg s-1) | Stern et al. (2002) | |||
| 1* | 8:48:09.9 | 44:49:03 | 20.5 | 0.581 | 1 | 1.1 | 77 | ||
| 9* | 8:49:05.0 | 44:57:15 | 19.6 | 1.260 | 1 | 4.8 | 31 | ||
| 10* | 8:49:11.4 | 44:44:54 | 20.2 | 1.286 | 1 | 0 (fixed) | 3.9 | - | |
| 11* | 8:49:27.7 | 44:54:58 | 20.2 | 0.886 | 2 | 4.5 | 12 | ||
| 12* | 8:49:43.3 | 44:54:32 | 18.6 | 0.463 | 1 | 1.9 (fixed) | 0.81 | - | |
| 6 | 8:48:58.1 | 44:54:35 | 19.0 | 0.573 | 1 | 0 (fixed) | 0.45 | 39 | |
| 13 | 8:50:09.0 | 44:53:16 | 20.9 | 1.260 | 1 | 1.9 (fixed) | 5.1 | - | |