A LIMIT CYCLE MODEL FOR LONG-TERM OPTICAL VARIATIONS OF
V SAGITTAE:
THE SECOND EXAMPLE OF ACCRETION WIND EVOLUTION
Abstract
V Sagittae shows quasi-periodic optical high (soft X-ray off) and low (soft X-ray on) states with the total period of days. A binary model is presented to explain orbital light curves both for the high and low states as well as the transition mechanism between them. The binary model consists of a white dwarf (WD), a disk around the WD, and a lobe-filling main-sequence (MS) companion. In the optical low state, the mass transfer rate to the WD is small and the size of the disk is as small as its Roche lobe size. In the optical high state, the mass transfer rate to the WD exceeds the critical rate of yr-1, and the WD blows an optically thick, massive wind. Surface layers of the disk are blown in the wind and the disk surface extends to the companion or over. As a result, optical luminosity of the disk increases by a magnitude because of its large irradiation effect. The massive wind completely obscures soft X-rays. This corresponds to the optical high/soft X-ray off state. The transition between optical high and low states is driven by an attenuation of the mass transfer from the secondary. During the optical high state, the wind from the WD hits the companion and strips off its surface layer. The mass transfer from the companion gradually reduces and stops. As the mass supply stops, the WD wind weakens and eventually stops. The disk shrinks to a Roche lobe size and the optical magnitude drops. This phase corresponds to the optical low/soft X-ray on state. Then a rapid mass transfer resumes. The mass of the WD envelope increases and it blows a wind again. This cycle is repeated like a limit cycle. During this intermittent wind phase, the WD can grow in mass at the critical rate and eventually reach the Chandrasekhar mass limit. This process is called “accretion wind evolution,” which is a key evolutionary process in a recently developed evolutionary scenario of Type Ia supernovae. This evolutionary process was first confirmed in the LMC supersoft X-ray source RX J0513.96951, although it commonly occurs in the supersoft X-ray sources when the mass transfer rate exceeds the critical rate. Thus, V Sge is the second example of accretion wind evolution.
1 INTRODUCTION
V Sagittae is an eclipsing binary system exhibiting optical high and low states (Herbig et al., 1965). V Sge has been intensively observed in various bands from radio to X-rays and many groups challenged to interpret its binary nature, but this peculiar system still defies explanation (e.g., Smak et al., 2001, for recent review and criticism on the binary nature).
There have been many debates on the nature of V Sge. Williams et al. (1986) suggested a cataclysmic variable (CV) nature from their observations. They claimed that the observed changes in the line profiles through the eclipse were similar to the rotational disturbance expected from the eclipse of an accretion disk. However, Wood & Lockley (2000) argued that the variability of the emission lines seen by Williams et al. (1986) continue all the way around the orbit and is actually unrelated to the eclipse. Robertson, Honeycutt, & Pier (1997) also found that no evidence of a rotational disturbance in their high-state spectroscopy of H.
V Sge (catalog ) has been suggested to be a supersoft X-ray source (SSS) (Diaz & Steiner, 1995; Greiner & van Teeseling, 1998; Patterson et al., 1998; Steiner & Diaz, 1998). This suggestion stems from similarities in the orbital light curve shapes between V Sge and the LMC supersoft X-ray source CAL 87 and in the long-term soft X-ray behaviors between V Sge and the LMC supersoft X-ray source RX J0513.96951. Soft X-rays were detected only during the optical low states (Greiner & van Teeseling, 1998), although this is not yet fully established in V Sge because of their sparse period coverage in X-rays.
Wood & Lockley (2000) argued that the light curves of V Sge can be well fitted by a much simpler model (a pair of two stars, see also Mader & Shafter, 1997; Lockley et al., 1999; Smak et al., 2001) and that no one has yet modeled the light curves or explained the emission-line profiles with the SSS model. Instead, Lockley (1998) and Wood & Lockley (2000) proposed a colliding wind model of V Sge both in the optical high and low states (see, also, Gies et al., 1998; Lockley & Wood, 1998; Wood & Lockley, 1997). However, it should be noted that no one successfully proposed a model of the transition between the optical high and low states.
The key observational features necessary to be elucidated here are: (1) V Sge exhibits long-term transitions between optical high ( and days) and low ( and days) states with the total durations of about 300 days (e.g., Šimon & Mattei, 1999, for the long-term behavior). (2) Very soft X-rays are detected only in the long-term optical low state (e.g., Greiner & van Teeseling, 1998). (3) Recent radio observations indicate a wind mass loss rate of yr-1 (Lockley, Eyres, & Wood, 1997, 1999).
These observational characteristics remind us of the LMC supersoft X-ray source RX J0513.96951 (catalog ) (hereafter RX J0513). RX J0513 shows very similar characteristics: (1’) quasi-regular transitions between optical high ( and days) and low ( and days) states (e.g., Alcock et al., 1996; Cowley et al., 2002), (2’) supersoft X-rays detected only in the optical low states (e.g. Reinsch et al., 1996, 2000; Schaeidt et al., 1993; Southwell et al., 1996), and (3’) bipolar jets and winds with the velocity of km s-1 (e.g., Crampton et al., 1996; Hutchings et al., 2002; Southwell et al., 1996), which is much stronger (faster and denser) in the optical high states. Recently, a new transition mechanism between the optical high and low states of RX J0513 has been proposed by Hachisu & Kato (2003a, b). Here we try to reproduce the above three observational features of V Sge by the same mechanism as in RX J0513.
In §2, we introduce our binary model for V Sge. The orbital light curve modulations in the optical high and low states are reproduced in §3. We discuss various arguments for/against the WD model in §4. A limit cycle model for the long-term light curve behavior is formulated in §5 and we present our numerical results in §6. Discussion and conclusions follow in §7 and §8, respectively.
2 THE BINARY MODEL OF V SAGITTAE
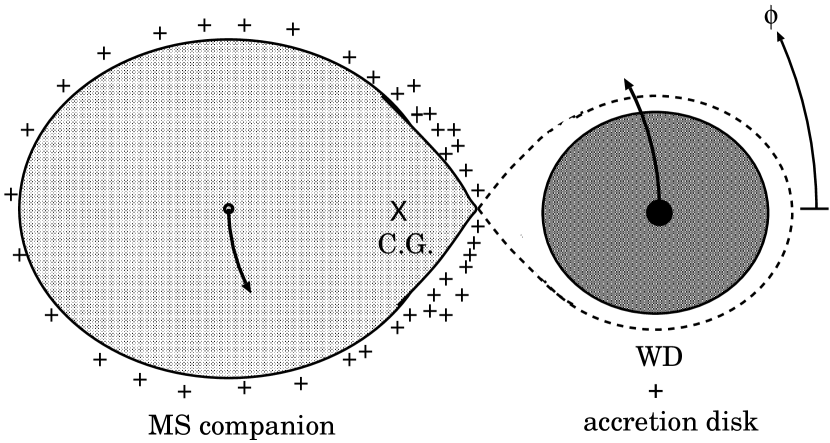
The orbital light curve modulations of V Sge are quite different both in shape and brightness between the optical high and low states (e.g., Herbig et al., 1965; Mader & Shafter, 1997; Šimon et al., 2002). In this section, we will show how to construct our binary models that reproduce orbital modulations in the optical high and low states. We adopt a binary system consisting of a mass-accreting white dwarf (WD), a disk around the WD, and a lobe-filling, main-sequence (MS) companion (see an illustration of Fig. 1).
2.1 Binary parameters
In this section, we assume the WD mass of taking the results of §6 in advance, i.e.,
| (1) |
We adopt the ephemeris by Patterson et al. (1998), i.e.,
| (3) | |||||
at eclipse minima (see also, Lockley et al., 1999; Mader & Shafter, 1997; Šimon, 1996b; Smak, 1995).
The secondary mass is determined as follows: Herbig et al. (1965) estimated each component mass from the observed radial velocities. They assumed that the weaker O III fluorescent line correctly traces the motion of the primary while the stronger O III fluorescent line follows the motion of the secondary, i.e., from km s-1 and from km s-1 (Smak et al., 2001), where is the inclination angle of the binary. Radial velocities of these two sharp lines are oscillating in the same period of the eclipsing binary and in anti-phase each other. Moreover, gamma velocities of these two lines are almost coincident. We do not think that the other lines such as H and He II are correct tracers of binary components because they are broad and their gamma velocities are not consistent with those of O III fluorescent lines.
Here, we reexamine the companion mass. We assume, following Herbig et al.’s paper, that the weaker O III fluorescent line correctly traces the motion of the primary, i.e., km s-1 (Herbig et al., 1965), but do not think that the stronger O III fluorescent line correctly follows the motion of the secondary. The reason is as follows: When the companion star is strongly irradiated by a luminous (hydrogen shell-burning) WD, its surface temperature is much higher at the irradiated hemisphere than that of the other side (see Fig. 1). Probably the stronger O III fluorescent line should trace more closely the irradiated hemisphere of the cool component. As a result, it is very likely that the observed orbital velocity of the stronger O III fluorescent line is a bit slower than the motion of the cool component as seen in Figure 1. If this is the case, the observed velocity of km s-1 does not represent the true radial velocity of the cool companion.
Figure 2 shows the relation between the orbital radial velocities and the MS companion mass derived from Kepler motion with the period of 0.514 days. This figure shows the secondary mass between and for km s-1, and the orbital radial velocity of km s-1. Here, we adopt the mass of . Then the separation is , the radii of the effective Roche lobes are and . The radius of zero-age main-sequence (ZAMS) star is (e.g., Bressan et al., 1993), so that the secondary is a main-sequence (MS) star but it is undersized and probably underluminous because of thermal imbalance by the Kelvin-Helmholtz timescale mass-transfer. We assume K for non-irradiated temperature of the MS companion. The inclination angle is determined by light curve fitting as described below. It should be noted here that the thermal timescale mass-transfer is realized for the mass ratio and the mass transfer rate can reach yr-1 or more (e.g. Li & van den Heuvel, 1997).
Our binary models for numerical calculation are illustrated in Figure 3. A circular orbit is assumed. We also assume that the photospheric surfaces of the WD, the MS companion, and the disk emit photons as a blackbody at a local temperature that varies with position. The numerical method adopted here was fully described in Hachisu & Kato (2001b).
2.2 Flaring-up disk and its irradiation effect
The irradiation effects both of the disk and of the MS companion play an essential role in the light curve modeling. For the basic structure of the accretion disk, we assume an axisymmetric structure with the size and thickness of
| (4) |
and
| (5) |
where is the outer edge of the accretion disk, is the effective radius of the inner critical Roche lobe for the WD component, is the height of the surface from the equatorial plane, and is the distance from the symmetric axis.
Since the orbital light curve modulations of V Sge show a nonaxisymmetric shape, we introduce an asymmetric configuration of the accretion disk as done by Schandl, Meyer-Hofmeister, & Meyer (1997). They explained an asymmetric feature in the orbital light curves of the LMC luminous supersoft X-ray source CAL 87. The cause is that the gas stream from the companion hits the edge of the accretion disk and makes a vertical spray when the mass transfer rate is as high as in the luminous supersoft X-ray sources ( yr-1). We have also introduced the same type of asymmetry of the accretion disk as Schandl et al.’s, i.e.,
| (6) |
and
| (7) |
where
| (8) |
and is a parameter specifying the degree of asymmetry, is the starting angle of the vertical spray, at the vertical spray reaches its maximum height, this maximum height continues until the angle of , the elevated rim disappear at the angle of , is the starting radius ratio from where the vertical spray is prominent, is the height of the disk surface from the equatorial plane for the asymmetric case. The azimuthal angle is measured from the phase at the WD component in front of the MS companion, i.e., from the phase at the secondary eclipse (see Fig. 1). Here, we assume that the accretion disk is symmetric inside (). The other parameters of , , , , and are determined from the light curve fitting. Such an example of the accretion disk is shown in Figure 3. Here, we adopt , , , , , , , and for configuration (a) but , , , , , , , and for configuration (b). The irradiation efficiency is assumed to be , i.e., 50% of the irradiated energy is emitted but the residual 50% is converted into thermal energy.
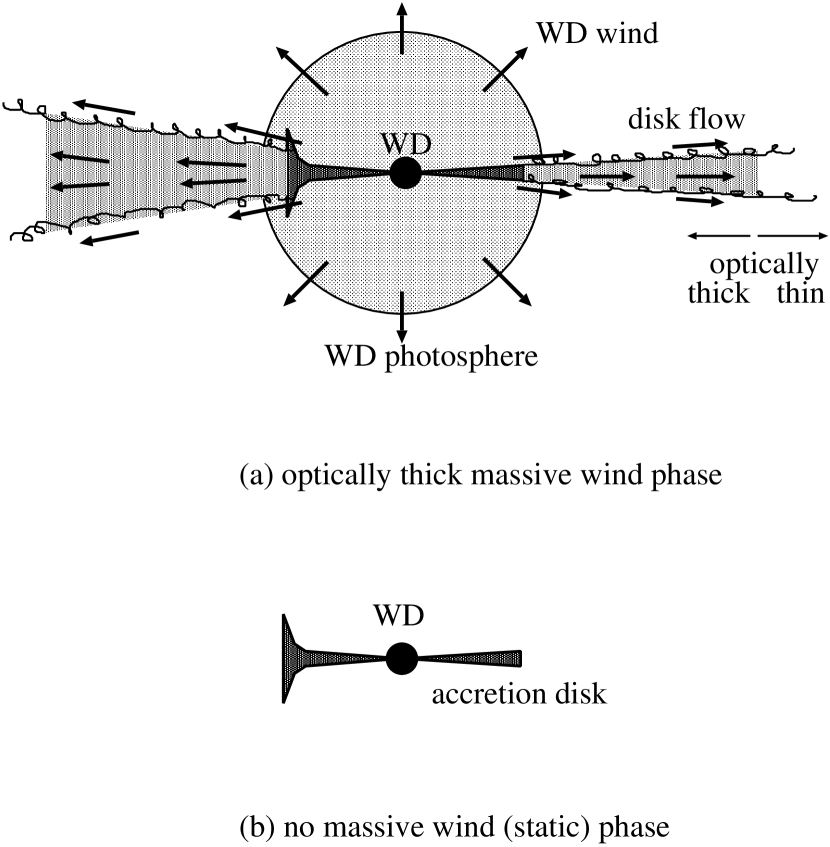
Recent analysis on the recurrent nova CI Aql 2000 outburst (Hachisu & Kato, 2003a) and the LMC supersoft X-ray source RX J0513 (Hachisu & Kato, 2003b) indicates that the irradiation area of the disk is blown in the wind and extends up to the companion star or over ( or over) as schematically shown in Figure 4. This physically means that (1) the surface layer of the accretion disk is blown off and accelerated up to, at least, several hundred km s-1 like a free stream going outward, and that (2) the optically thick part of the disk surface ends somewhere far outside the Roche lobe as seen in Figures 3a and 4a. Here, we adopt during the massive wind phase but in the no massive wind phase (Hachisu & Kato, 2003a, b). This -square law mimics the effect of flaring-up at the rim of the disk by vertical spray as discussed by Schandl et al. (1997) for supersoft X-ray sources.
The accretion luminosity of the disk is also numerically included, although its contribution to the -light is much smaller compared with that of the irradiation effect (see discussion of Hachisu & Kato, 2001a, b; Hachisu, Kato, & Schaefer, 2003). The temperature of the outer rim of the disk is assumed here to be 10000 K. We have checked that the light curves are hardly changed even if 8000 K or 12000 K is adopted as an outer rim temperature instead of 10000 K.
2.3 Irradiated MS companion
The MS companion is also irradiated by the WD. As already shown by Smak et al. (2001), the irradiation effect alone cannot closely reproduce the orbital modulations. Schandl et al. (1997) adopted a redistribution of the irradiated energy with a diffusion angle of to reproduce a relatively round shape of orbital modulations just before/after the eclipse minima. Here, we also adopt the same type of redistributions of irradiated energy, but with a bit larger diffusion angle of instead of . The irradiation efficiency is the same as that of Schandl et al. (1997), i.e., assumed to be , i.e., 50% of the irradiated energy is emitted but the residual 50% is converted into thermal energy. The distribution of surface temperature is determined by the constraint that the total of the emitted energy is equal to the sum of 50% of the irradiated energy and the emitted energy with the original surface temperature of 12,000 K.
3 ORBITAL LIGHT CURVES IN THE OPTICAL HIGH AND LOW STATES
Our modeled light curves are shown in Figure 5. To reproduce the bright state, we must have a large size of the disk, , and an expanded WD envelope of ( K), as shown in Figure 3a. For the optical faint state, we adopt a much smaller photospheric radius of and a smaller size of the disk, i.e., , as shown in Figures 3b, 6b, and 7b. The WD blows winds when , so that these two photospheric radii are consistent with the optically thick wind theory.
The photospheric radius of the WD () exceeds its critical Roche lobe () but smaller than that of the MS secondary (). The velocity of the wind is as fast as km s-1 or more at the WD photosphere and much faster than the orbital velocity ( km s-1). As a result, the wind is almost free stream near the photosphere and hardly affected by the rotation effect (or the tidal effect) even if the photosphere exceeds the Roche lobe.
The velocities of winds calculated are as fast as km s-1 (e.g., Kato & Hachisu, 1994) and the wind mass loss rate is as large as yr-1 (e.g., Hachisu & Kato, 2001b). Observationally wind velocities are reported to be, for example, km s-1 during the bright state (see, e.g., Koch et al., 1986; Wood & Lockley, 2000). Such a massive and fast wind affects the surface of the accretion disk. Because of a large velocity difference between the wind and the disk surface, it certainly drives the Kelvin-Helmholtz instability at the interface. Only the surface layer of the disk is dragged away outward with the velocity at least several hundred km s-1 like a free stream moving outward. This surface free stream is optically thick near the original disk but becomes optically thin somewhere outside because of geometrical dilution effect. We regard the transition place from optically thick to thin as the edge of the extended disk (see Fig. 4). In this sense, we should understand that the outer rim shown in Figure 3a is not the matter boundary but a transition from optically thick to thin regions of the tenuous disk surface flow.
It should be noted that a high density part of the disk (dark-hatched region in Fig. 4) is hardly changed by this relatively tenuous disk surface free stream because the internal density of the disk is much denser than that of the WD wind. The wind mass loss rate reaches about yr-1 and its velocity is km s-1, so that the density of the wind is estimated from the continuity () to be about g cm-3 at the distance of from the center of the WD. On the other hand, the density of the accretion disk is about g cm-3 at the same radius. Here, we assume the standard accretion disk model (Shakura & Sunyaev, 1973) with a mass accretion rate of yr-1.
In the faint state, on the other hand, small WD radii and disk sizes are required as illustrated in Figure 3b. As suggested by Smak et al. (2001), the size of the disk exceeds the Roche lobe, that is, , as shown in Figures 3b, 6b, and 7b. The edge of the disk still contributes to the total light even in the eclipse minima (see Fig. 6b) and, as a result, the eclipse is not total but partial.
The orbital light curves both in the high and low states vary from night to night (e.g., Herbig et al., 1965; Mader & Shafter, 1997; Lockley et al., 1997). These variations are attributed to the dynamical changes of the disk edge shape, which are frequently observed in supersoft X-ray sources. In this sense, our obtained shapes of the disk both in the high and low states are not rigid but dynamically variable.
The calculated color variations are roughly consistent with the observations, if the color excess is (e.g., Mader & Shafter, 1997; Patterson et al., 1998), i.e., for the faintest state, against , and, for the brightest state, against , where is the calculated color (see Fig. 5) and the observed color (taken from, e.g., Herbig et al., 1965; Šimon et al., 2001; Smak et al., 2001). Then, the distance to V Sge is estimated to be kpc with and .
4 VARIOUS ARGUMENTS FOR/AGAINST THE WHITE DWARF MODEL
The most serious criticisms on the WD model of V Sge have been proposed by Smak et al. (2001). They excluded the model of a disk around a compact primary component mainly because such a model cannot reproduce the orbital light curves in the faint phase. However, their conclusions are derived based on the assumptions that (1) the accretion disk is geometrically thin, that (2) their irradiation effect does not include the diffusion effect between the irradiated and non-irradiated regions of the secondary surface, and that (3) the size of the disk is limited within times the Roche lobe size. As already shown in the previous subsection, we are able to reproduce the orbital light curves if these three assumptions are relaxed in V Sge.
As for assumption (1), Schandl et al. (1997) have shown that an elevated edge of the disk reproduce the light curve of the supersoft X-ray source CAL 87, which is very similar to the faint state of V Sge (e.g., Diaz & Steiner, 1995; Greiner & van Teeseling, 1998; Patterson et al., 1998; Šimon, 1996a). As for assumption (2), Schandl et al. (1997) also showed that a diffusion effect on the secondary surface is important to explain a wide primary eclipse (or a round shape just outside the primary eclipse). The same round shape just outside the primary eclipse was also observed in the recurrent nova CI Aql 2000 outburst and such a round shape can be reproduced by the same effect (Lederle & Kimeswenger, 2003).
As for assumption (3), the mass transfer rate becomes as large as the Eddington limit for white dwarfs in the optical low (faint) state, i.e.,
| (9) |
as will be shown in the following section. In such high accretion rates, a part of matter overflows the inner critical Roche lobe. However, the size of the disk, i.e., , is still smaller than the outer critical Roche lobe.
Hoard, Wallerstein, & Willson (1996) found that the X-ray flux from V Sge shows modulation with periodicities approximately equal to a half, a third, and a fourth of the orbital period but not with the orbital period itself. Smak et al. (2001) counted it one of the evidences against the model in which the hotter component is a source of soft X-rays. In our model, however, the hot component (white dwarf) is blocked at least twice, i.e., by the edge of the disk and by the companion as seen in Figure 3. Furthermore, in some configurations of the disk like in Figure 3, this occultation of the hot component by the disk edge continues from binary phase to , i.e., orbital periods, which may explain a modulation frequency of a third of the orbital period.
5 A LIMIT CYCLE MODEL OF V SAGITTAE
The long-term optical behavior of V Sge shows a quasi-regular transition between high and low states (e.g., Šimon & Mattei, 1999, for a recent summary of the long-term variations). In this section, we reproduce the long-term optical variations based on an optically thick wind model of mass-accreting white dwarfs (Hachisu & Kato, 2001b; Hachisu et al., 1996, 1999a, 1999b; Kato, 1983; Kato & Hachisu, 1994).
5.1 Winds of mass-accreting WDs
An essential point of our wind model is that WDs blow a fast and massive wind when the mass accretion rate exceeds the critical rate, i.e.,
| (10) |
for and (see, e.g., Hachisu & Kato, 2001b, for other cases of hydrogen content and metallicity). The wind velocity is as fast as or faster than km s-1 and the wind mass loss rate is approximately given by
| (11) |
and usually as massive as yr-1.
5.2 Mass stripping effects
When massive winds collide with the surface of the companion, the surface is shock-heated and ablated in the wind. We estimate the shock-heating by assuming that the velocity component normal to the surface is dissipated by shock and its kinetic energy is converted into the thermal energy of the surface layer. We regard that gas is ablated and lost from L3 point (L3 is the outer Lagrange point near the MS companion) when the gas gets the same amount of thermal energy as the difference of the Roche potentials between the MS surface and L3 point. Then the mass stripping rate is given by
| (12) |
where , is the separation of the binary, the Roche potential at the MS surface, means the Roche potential at L3 point near the MS companion, both of which are normalized by , the efficiency of conversion from kinetic energy to thermal energy by shock, is the geometrical factor of the MS surface hit by the wind including the dissipation effect (only the normal component of the wind velocity is dissipated), and is only a function of the mass ratio (see Hachisu, Kato, & Nomoto, 1999a, for more details). Here we modified equation (21) of Hachisu et al. (1999a) to include the effect of Roche lobe overflow from L3 point. Then the stripping rate is estimated as
| (13) |
where
| (14) |
The efficiency of conversion is assumed to be . Here, we assume further that , . Then, we have the separation of , the total mass of the binary , and the difference of Roche potentials , and for the mass ratio (Hachisu et al., 1999a). Substituting these values to equation (14), we have
| (15) |
for the wind velocity of km s-1. Here, the maximum wind velocity observed is km s-1 in the optical bright state (e.g., Koch et al., 1986; Wood & Lockley, 2000), which is a similar wind velocity in RX J0513.
5.3 Mass transfer attenuated by winds
In such a wind phase, the net mass accretion rate to the WD, , is modified as
| (16) |
Here we adopt a small value of yr-1 when because the mass accretion to the WD does not stop abruptly but probably continues at least for a draining time of the accretion disk. We do not know the exact draining time of the accretion disk after the mass transfer from the MS stops. Alternatively, we just assume a small rate of the mass accretion to mimic the draining of the disk during that .
To know when the rapid mass accretion resumes, we monitor the level of flow as
| (17) |
with the initial value of (see Fig. 3 of Hachisu & Kato, 2003b, for more details). This corresponds to when the surface of the MS companion fills its critical Roche lobe. We regard that the mass transfer is going on when (overflow level). During that , decreases to a large negative value. Here, we regard that the mass transfer stops when . Then the mass transfer from the MS stops or its rate drops to . Once the mass accretion rate drops below the critical rate, i.e., , the wind gradually weakens and eventually stops. Then, the stripping effect vanishes () and the level of flow () begins to rise toward . We start again the rapid mass accretion when the level reaches . This period is considered to be a thermal recovering time of the envelope of the MS companion. It should be noted that the level remains to be if a steady-state is reached, i.e., .
5.4 Time evolution of winds
Time evolution of the photospheric radius and temperature of the WD are calculated from Kato & Hachisu’s (1994) optically thick wind solutions. It is written, after Hachisu & Kato (2001b), as
| (18) |
where is the envelope mass, the mass accretion rate, the decreasing rate by nuclear burning, and the wind mass loss rate of the WD. The photospheric radius, temperature, and luminosity are given as a function of the envelope mass. When the photospheric radius shrinks smaller than the binary size, the irradiation effects both of the accretion disk and of the companion star become important. We include these irradiation effects together with a shadowing effect by the disk on the companion star as already described in the preceding section (see, e.g., Hachisu & Kato, 2001b; Hachisu, Kato, & Schaefer, 2003; Hachisu & Kato, 2003b).
5.5 Delay of mass transfer via accretion disk
An important thing is that equation (18) stands on the WD but equations (12)(17) are on the MS. Therefore, the mass accretion rate, , may not be the same on each side at the specific time, , because it takes a viscous timescale of the accretion disk for gas to reach the WD surface from the MS surface. Then, we have
| (19) |
Here we adopt a viscous timescale of
| (20) |
where is the viscosity, the parameter of Shakura & Sunyaev (1973), the sound speed, and the vertical height of the accretion disk. We adopt and for K and km s-1.
5.6 Model parameters
Our long-term light curves of V Sge are calculated for a given set of parameters: (1) the white dwarf mass, , (2) the companion mass, , and its surface temperature, , (3) the mass transfer rate from the MS companion, , (4) the viscous timescale of the accretion disk, , (5) the coefficient of stripping effect, , and (6) the disk parameters of and and other factors which determine the disk shape. The parameters (1)(5) are summarized in Table 1 except for , 12,000, and 13,500 K for , 3.0, and , respectively. As for the disk shapes, we simply adopt the same disk shape parameters as shown in Figure 3. Typical long-term light curves are shown in Figures 8-11 for various white dwarf masses, i.e., , , , and , respectively.
6 NUMERICAL RESULTS OF LIMIT CYCLE MODEL
6.1 Template light curves
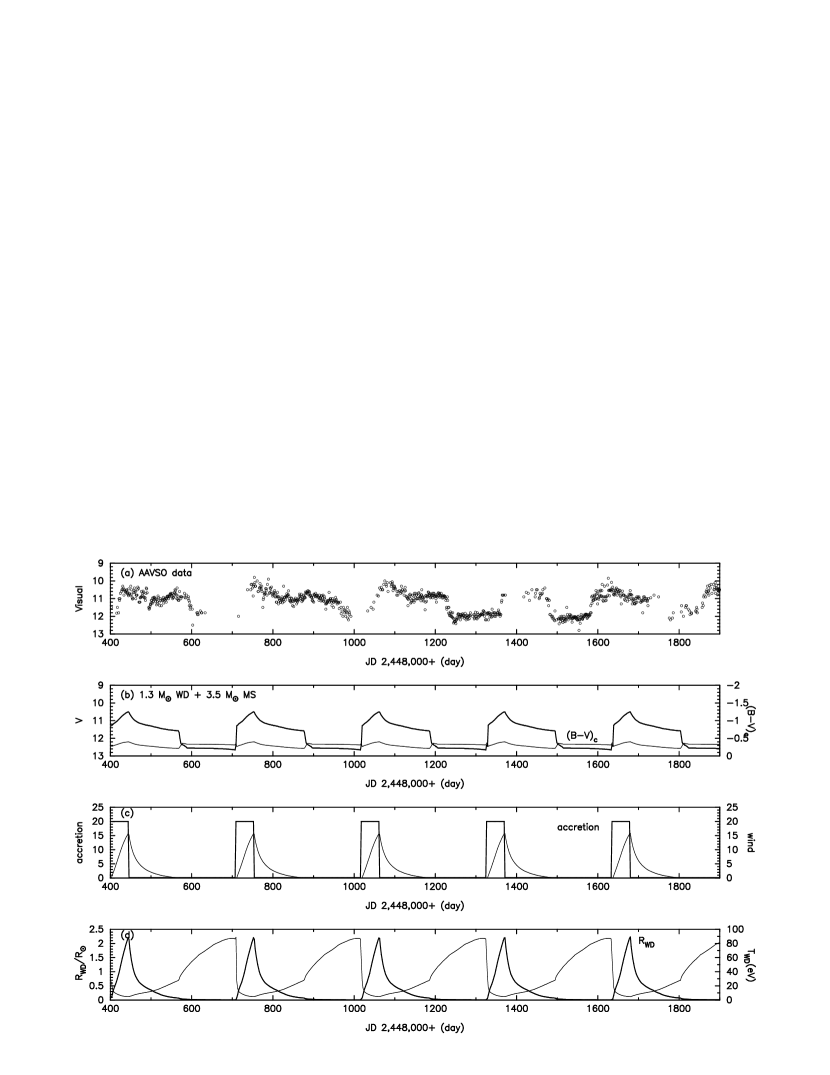
Now we show our long-term light curves that exhibit the transition between the optical high and low states. The first case is a binary system consisting of a WD and a MS companion. Assuming yr-1, , and days (i.e., 81 binary periods), we have followed the time evolution of our binary system with the initial envelope mass of . Figure 8 depicts the obtained -light curve and color (second panel), accretion rate on the WD) and wind mass loss rate in units of yr-1 (third panel), radius () and temperature (eV) of the WD photosphere (bottom panel) together with the AAVSO observation (top panel).
At the beginning of time-evolution calculations, the mass of the WD envelope is small. As the WD accretes matter and its envelope mass increases because of . When the envelope mass reaches the critical value, , the WD photosphere expands to and begins to blow a wind. Then the disk surface is blown in the wind and the disk size quickly expands from to in dynamical timescales. Here we adopt seven days as the transition time, because the massive winds easily blow the surface layer of the disk in the wind. The wind mass loss rate is about yr-1 only one day after the wind starts, which is large enough to completely obscure soft X-rays (see, e.g., discussion of Southwell et al., 1996). The occurrence of optically thick winds can naturally explain the very rapid emergence and decay of the supersoft X-rays accompanied by the transition between the optical high and low states (Greiner & van Teeseling, 1998).
The envelope mass continues to increase and the wind mass loss rate also grows. The WD photosphere continues to expand and this causes a gradual increase in the optical light curve. The mass transfer from the MS is suppressed when the wind mass loss rate reaches yr-1, because yr-1. However, the mass accretion to the WD still continues at a high rate and the wind mass loss rate reaches yr-1 as shown in Figure 8 because the mass in the accretion disk is drained to the WD for 41.6 days of time delay. The mass accretion to the WD eventually stops and the mass of the WD envelope begins to decrease due to wind mass loss and nuclear burning. The WD photosphere gradually shrinks from to during the wind phase. This causes the gradual decrease in the optical light curve until the end of high state. When the mass of the WD envelope decreases to , the wind stops. The duration of the wind phase is about 170 days as shown in Figure 8 and summarized in Table 1.
The WD photosphere begins to shrink quickly after the wind stops. It takes 12 days to collapse from to . The photospheric temperature increases quickly from 30 eV to 40 eV during this period. It takes 27 days to further contract from to . The photospheric temperature further increases from 40 eV to 60 eV during this period. When the wind stops, the wind mass loss rate decreases from yr-1 to zero in a day. This means a sharp emergence of supersoft X-rays in a day or so as observed in the LMC supersoft X-ray source RX J0513.96951 (Reinsch et al., 2000).
During the massive wind phase, the MS companion is stripped off by the wind and its surface becomes smaller than the critical Roche lobe, i.e., the level of mass flow, , in equation (17) goes to much below the level of zero. When the wind stops, the surface of the MS companion is still smaller than the Roche lobe. It gradually recovers up and eventually reaches the level of zero. It takes days in Figure 8. It takes a further 41.6 days until the mass accretion to the WD resumes, i.e., delay time. It takes more 3 days that the WD envelope expands to blow a wind again. The total duration of low states amounts to days. Thus, the system repeats the cycle mentioned above, i.e., a 170 days optical high state and a 130 days optical low state.
The modeled system reaches a limit cycle after one cycle of high and low states. Thus, the long-term light curve modulations are roughly reproduced. The time-averaged mass transfer rate to the WD is yr-1 and 80% of the transferred matter is blown in the wind, so that the MS loses its mass at the average rate of yr-1 by stripping effects. These values satisfy the conditions of and in averaged values.
Robertson et al. (1997) divided the long-term optical brightness of V Sge (catalog ) into three levels, i.e., the high (), intermediate (), and low () states. In this three-level classification of the brightness, we attribute the phase of largely expanded WD photospheres () to the real optical high () state. When the WD photosphere expands as largely as , it contributes more to the UV/optical light compared with the disk irradiation. The temperature of the WD photosphere is as high as K, while the disk has lower temperatures of K. Thus, the color goes blueward as shown in Figures 811.
Lockley, Eyres, & Wood (1997) detected radio emission from V Sge and estimated the wind mass loss rate of
| (21) |
The wind mass loss rate in our model (e.g., Fig. 8) reaches yr-1 and its averaged value during the wind phase is as large as yr-1, which is very consistent with the radio observation.
Thus, we are able to reproduce the basic observational features (1)(3) of V Sge summarized in §1. Furthermore, our model naturally explains the other observational features: (4) the WD photosphere continues to expand during the rapid mass accretion phase and still goes on until days after the wind started. This makes a visual magnitude peak of at the head of optical high states. Large expansions () of the WD photosphere are very consistent with the photospheric radius () of the WD in the optical bright state shown in Figure 5.
6.2 White dwarf mass
We have examined other WD masses, i.e., , , and , with the companion mass being kept to be . The results are shown in Figures 9, 10 and 11. In general, more massive white dwarfs have a shorter duration of the wind phase. The durations of optical high and low states are summarized in Table 1 for various white dwarf masses and other parameters.
Our guiding principle is that (1) we tune and to satisfy the duration of the low state (about 130 days), because we do not know the exact number of , but it may be around from equation (15), and that (2) we also tune to reproduce the optical peak shape in the bright state. Each tuned parameters are summarized in Table 1.
For the case of WD MS, we choose the parameters of and yr-1. Then, the durations of the wind phase (optical high state) and of the no wind phase (optical low state) are about 220 and 130 days, respectively. The observational light curve shape of long-term variations is well reproduced by this WD MS model.
When the rapid mass transfer from the MS companion stops, we still keep a low rate of mass accretion to the WD, i.e., in equation (16). To check the effect of , we double the value of and calculate the long-term light curve. The duration of the optical low state becomes a bit shorter, 120 days, as listed in Table 1. On the other hand, the duration of the optical high state becomes a bit longer, 230 days, with the total period being almost not changed, 350 days. We may conclude that the effect of is not so large as long as its value is small compared with the rapid mass transfer rate. This also examines the effect of the atmospheric mass transfer, although the real number of the mass transfer rate coming from the tenuous atmosphere of the MS companion is not estimated, but it probably does not much exceed yr-1 (e.g., Ritter, Zhang, & Kolb, 2000).
For the case of WD MS, we have the parameters of and yr-1. Then, the durations of the wind phase (optical high state) and of the no wind phase (optical low state) are about 290 and 140 days, respectively. The calculated duration of the optical high state (wind phase) is too long to be compatible with the observation.
For the case of WD MS, we choose the parameters as and yr-1. The durations of the optical high state and of the optical low state are about 430 and 150 days, respectively. In this case, too, the calculated duration of the optical high state is much longer than that of the observation.
When the durations of the low states are set to be similar to those for , the duration of high states becomes much longer in the less massive white dwarfs. From the theoretical light curve shapes and the durations of optical high states, we may conclude that the WD mass in V Sge is somewhere between and . In what follows, we use as already adopted in equation (1).
6.3 Mass transfer rate of MS
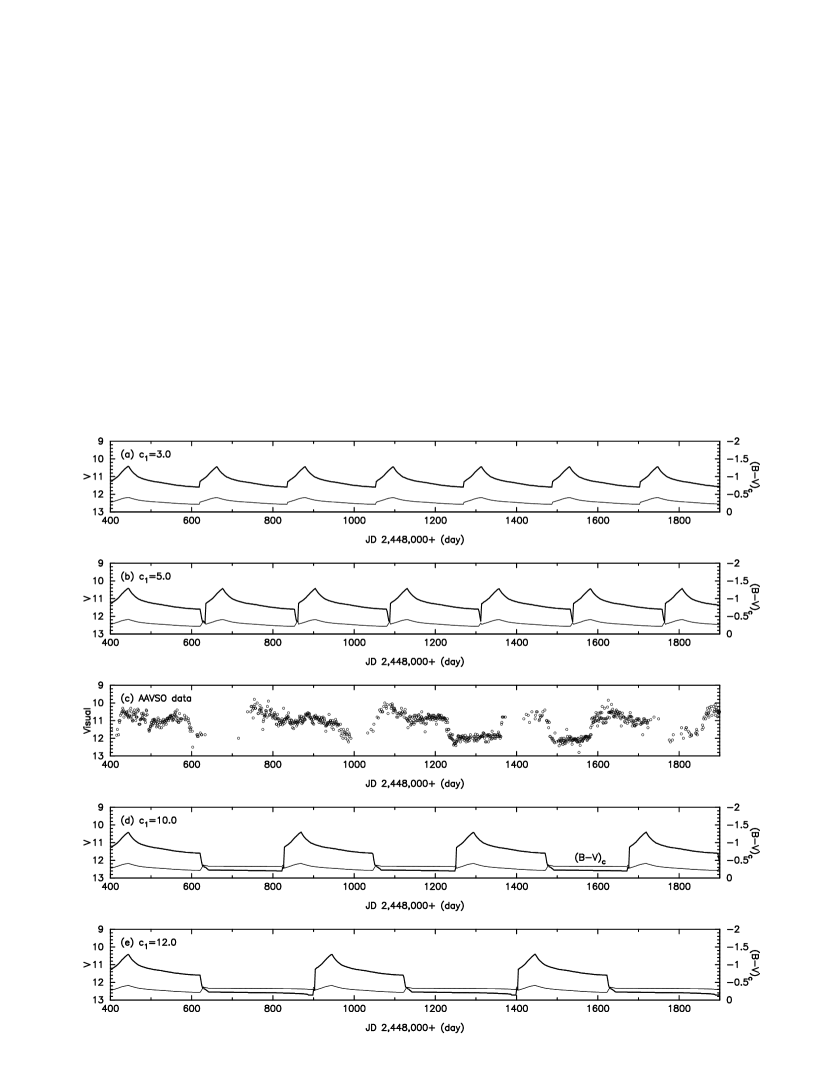
The mass transfer rate of the MS companion depends on its evolutionary stage and binary parameters (e.g., Li & van den Heuvel, 1997; Langer et al., 2000). Since we do not know the exact number of the mass transfer rate in V Sge, we have examined various values of the original mass transfer rate , i.e., , , , , , , (Fig. 9), and in units of yr-1 for the WD MS. Their results are summarized in Table 1 and the long-term light curves are shown in Figure 12. Here, we fix the other parameters, i.e., days and . The duration of optical high states becomes longer for the higher mass transfer rates of . On the other hand, the duration of the optical low state hardly changes.
As the mass transfer rate of increases, an optical peak at the head of the high state becomes more prominent. This is because the WD photosphere expands to as large as and both the irradiation effect by the disk and the WD brightness itself increase and contribute much to the -light. From this peak luminosity, we adopt the mass transfer rate of yr-1 for the case of WD MS.
6.4 Effect of viscous timescale
The viscous timescale of accretion disks is not theoretically determined yet. Therefore, we examine the dependency of the value of on our modeled light curves. Here, we adopt four other different values of days (27 rotation periods), days (54 rotation periods), days (108 rotation periods), and days (135 rotation periods), as summarized in Table 1 and shown in Figure 13. The other parameters are fixed, i.e., yr-1 and for the binary model of WD MS.
For the case of days, we have no low states because the rapid mass accretion resumes 13.9 days after the condition is satisfied. This time is before the wind stops. For the case of days, we have a short duration of low states, 30 days, much shorter than the observational ones.
On the other hand, for a relatively long timescale of days, we have a rather long duration of low states, 240 days, much longer than the observational ones. This is because the rapid mass accretion still continues during 55.5 days after the condition is fulfilled and, as a result, a massive and fast wind strips off the surface of the MS companion deeply, and it takes a much longer time to recover the level of zero in equation (17). For the case of days, we have a very long duration of low states, 340 days. The steady hydrogen shell-burning stops at 270 days in the low state, that is, 70 days before the optical high state starts.
6.5 Mass stripping effect
It is a difficult work to accurately estimate the effect of mass-stripping, that is, to determine the coefficient of in equation (13). Therefore, we calculate other four cases of , i.e., , , , and and examine how the light curves depend on the coefficient. It is obvious that strong modulation of the mass transfer rate never occurs for the case of because there is no case of . Our calculated models and their parameters are listed in Table 1.
For the case of shown in Figure 14, we have no optical low states, mainly because the mass-stripping effect is small and, as a result, the recovery time of the MS envelope is rather short. For the case of , the duration of optical low states is about 10 days, still because of small mass-stripping effect.
On the other hand, for the case of , the mass-stripping effect increases and the recovery time of the MS envelope becomes drastically longer. If we further increase the value of , the duration of low states reaches 280 days, where the steady hydrogen shell-burning stops at 270 days in the low state, i.e., 10 days before the optical high state starts.
6.6 Flat segment to active segment
In the long-term light curve behavior, there are periods with/without strong optical modulations. Šimon & Mattei (1999) called them active/flat segments, respectively. The active segments can be understood as a limit cycle of the optical high and low states as already shown in the previous subsections. Here, we interpret the nature of the flat segments. Šimon et al. (2001) pointed out that the flat segments finished by another decrease into a real low state and further suggested that the intermediate (medium) state is classified as the flat segment (see §6.1).
Our WD wind model provides a natural explanation of such behavior if the mass transfer rate from the MS companion varies in time together with the mass-stripping effect. In the calculation shown in Figure 15, we gradually increase from yr-1 to yr-1 in 1200 days and, at the same time, strengthen the mass-stripping effect from to 8.0. This may imply that the wind velocity (the mass-stripping effect) is relatively slow (small) at the low wind mass-loss rate regime but gradually increases proportionally to the wind mass-loss rate. No modulations appear when the mass stripping effect is as small as and the mass transfer rate is also as low as yr-1. This figure shows that modulation appears in the light curve as both the mass transfer rate and the mass stripping effect increase in time.
6.7 Dependence on the secondary mass and the inclination angle
The long-term light curve behavior depends also on the other various parameters. In this subsection, we examine the long-term light curves by changing the other system parameters. (1) The light curve also depends on the mass of the MS companion. We have calculated two other masses of and with the inclination angle of . The results are shown in Figure 16. The overall light curve features are not changed but the brightness becomes fainter in the less massive companion masses. (2) We have also checked the dependency of the light curve on the inclination angle, i.e., and as shown in Figure 16. The depth of the optical low state becomes much deeper at the lower inclination angles, that is, much deeper at than at .
7 DISCUSSION
7.1 The He II 4686 emission line in the high state
Phase-resolved spectra in the optical high state
have been observed
by several groups (Gies, Shafter, & Wiggs, 1998; Lockley & Wood, 1998; Robertson, Honeycutt, & Pier, 1997; Wood & Lockley, 1997).
Lockley (1998) presented high-quality, phase-resolved spectra
of He II 4686 and H emission lines
in the optical high state (see also, Lockley & Wood, 1998; Patterson et al., 1998; Wood & Lockley, 1997).
He showed six kinematic
components in the He II 4686 emission line.
Gies et al. (1998) summarized them as follows:
(1) A broad, flat-topped component with steep edges that
extend further to the red than the blue. This broad feature
also dominates H, and double-Gaussian fittings of
the extreme wind radial velocity variations are similar
in both He II and H (Gies et al., 1998; Robertson et al., 1997).
The phase-resolved behaviors of these two sharp edges, which are
attached by number “1”, are
shown in Figure 17. The left dashed-line
corresponds to the blue edge while the right dashed-line
does to the red edge.
(2) A central, narrow, nebular line. This component appears
stationary in both He II and H.
The H profiles appear double-peaked in both Gies et al. (1998)
and Robertson et al. (1997), because of the presence of both
He II 6560 and H. The H component
indicates an outflow with a velocity
of km s-1. The phase-resolved behavior of this
line is also shown in Figure 17, to which
number “2” is attached.
(3) An outer blue peak that accelerates blueward after
primary eclipse and attains minimum velocity near the
extreme blue wind just prior to phase 0.5, to which number “3”
is attached.
This feature is also seen in H.
(4) An outer red peak, to which number “4” is attached,
best seen near phase 0.7, that
moves along with the red sharp edge of the broad component 1.
(5) An inner red peak that appears near phase 0.6,
to which number “5” is attached, moves
redward from line center, and then disappears again near phase 0.1.
This feature is seen in H.
(6) An inner blue peak that emerges from the central nebular line
to follow the motion of star 1 (primary component),
to which number “6” is attached.
This is seen as a slight blueward extension of the H
peak in the radial velocity range 0 to km s-1
between phase 0.2 and 0.5.
With the above features, we presume three line formation regions of the He II 4686 in our WD optically thick wind model: the first one is the WD massive wind, the second one is the irradiated surface of the disk, and the third one is the irradiated side of the MS companion and the matter which is stripped off from the MS companion. The first and second regions are denoted by filled arrows and short outlined arrows, respectively, in Figure 18.
The red sharp edge (component 1 and 4) almost follows the motion of star 1 (the primary WD) with km s-1 but red-shifted by km s-1. It suggests that this component is originated from the WD wind with the velocity of km s-1. The sharp blue edge of emission component 1 is not consistent with this WD wind model because it does not show a sinusoidal feature of km s-1. This feature may be explained by the effect of self-absorption by the WD wind itself, although it is heavily contaminated by the C IIIN III complex in the blue edge over km s-1. The spectra of Lockley & Wood (1998) and Patterson et al. (1998) certainly show a weak feature of the C IIIN III complex.
Emission components 3 and 5 also have a similar km s-1 and follow the motion of star 1 with a smaller red shift of km s-1 for component 5 and a blue shift of km s-1 for component 3. This suggests the velocity of the disk surface flow as fast as km s-1 (see also Fig. 4).
For H emission, Gies et al. (1998) obtained a radial velocity curve of km s-1 by double-Gaussian fitting for the inner flat-topped structure with km s-1. This implies a bit faster disk surface outflow, which is reasonably explained if the line formation region of H is further out than that of He II 4686 and the disk surface flow there is more accelerated.
The central emission components 2 and 6 (dash-dotted lines in Fig. 17) show anti-phase motions of the other components. This feature indicates that components 2 and 6 are originating from star 2. As we have already discussed, the MS companion (star 2) loses matter stripped by the WD wind in the optical high state. This gas outflow is much slower compared with the WD wind and the disk surface flow, may be as slow as km s-1.
7.2 The He II 1640 emission line in the low state
The main features of the observed He II 1640 spectra in the optical low state (Wood & Lockley, 2000) are summarized as follows: (1) At phase zero the line is roughly symmetrical about its center although an excess in the red peak is seen. (2) As the binary phase increases, the emission on the blue side of the line increases until at phase with emission out to a velocity of km s-1. At this phase a sharper red edge appears at km s-1. (3) At phase 0.4 the line is roughly symmetric again. (4) Then, from phase 0.5 to 0.8, the situation is opposite to phase from 0.1 to 0.4, with the extended emission now occurring on the red side out to km s-1 and the sharper blue edge at km s-1.
Wood & Lockley (2000) explained the above features by the colliding winds. However, these features can be qualitatively explained even by our WD model. Fukue & Hachiya (1999) showed that a disk surface flow is driven up to km s-1 when the central WD is as luminous as the Eddington luminosity. The disk surface flow is line-driven, therefore, we see an optically thin wind going outward along the disk surface. When the disk edge is asymmetric as illustrated in Figure 19, the disk surface flow is also asymmetric because the elevated edge of the disk suppresses effective acceleration. (1) At phase zero, we can see both the elevated disk edge and the extended emission region in the angle between phase 0.1 and phase 0.4 (see Fig. 19). The emission region of the elevated disk edge contributes to an excess at the red side of the central peak. (2) As the binary phase increases, the blue side of the line becomes more prominent. During phase 0.1 to 0.4, the disk motion is toward us and its velocity is increasing to km s-1 at phase 0.25. This orbital motion makes the sharp red edge of the line blueward as shown in Figure 4 of Wood & Lockley (2000). (3) At phase 0.4 the line is roughly symmetric but with an small excess in the blue side. This is very consistent with the observed one. (4) From phase 0.5 to 0.8 the behavior of the line is opposite to that of phase 0.1 to 0.4 as easily understood from Figure 19. Since the disk goes away from us during this phase, the sharp blue edge of the line moves redward. This is also consistent with Figure 4 of Wood & Lockley (2000). At phase 0.9 the line is almost symmetric again but with a very small excess in the red side and this is also consistent with the observed line profiles.
7.3 The C IV doublet 1548 and 1551 in the low state
The observational features of the C IV spectra in the optical low states (Wood & Lockley, 2000) are summarized as follows: (1) At phase the blue absorption feature belonging to the blue member of the C IV doublet becomes largest with the P Cygni absorption reaching km s-1. (2) As the phase increases the extent decreases, reaching only km s-1 just prior to eclipse. (3) The extent of the absorption feature increases again after eclipse to phase 0.5 but the absorption itself is rather weak.
To explain the above behavior we assume that the line formation region of C IV doublet is much more extended compared with that of He II 1640. An illustrated configuration of our model is shown in Figure 20. In the direction of phase 0.4 to 0.9, the disk surface flow goes up along the elevated edge of the disk involving the disk matter dragged. Therefore, the disk surface flow crosses the line of sight and absorbs the C IV lines. On the other hand, in the direction of phase 0.9 to 0.4 the disk surface flow virtually does not cross the line of sight (see Fig. 20). As a result, the absorption is very weak. The disk surface flow has a large angle against the line of sight, for example, or so. Then, the extension of the the P Cygni absorption feature is limited at a smaller velocity like km s-1 even if its terminal velocity is as large as km s-1.
7.4 Other emission features in the low state
Phase-resolved spectra of the
He II and H
in the optical low states were obtained by Diaz (1999).
The radial velocities of the emission lines were
measured by a double-Gaussian convolution method. Their results
are summarized as follows:
(1) The radial velocity amplitudes of
He II and H agree with each other,
i.e., km s-1, by Gaussian components half-separated
by km s-1 for He II
and by km s-1 for H.
(2) Positive-to-negative velocity crossing occurs at phase 0.93,
that is, the largest positive velocity is reached at phase 0.68
and the smallest negative velocity is attained at phase 0.18.
(3) The H line flux presents a sharp maximum during phase
0.0, which indicates that the Balmer line formation region is not
eclipsed, while the He II line flux reaches
minimum at phase 0.0, indicating a partial eclipse of a highly
ionized region.
We attribute the He II line formation region to a relatively inner portion of the disk but the H line formation region both to an outer portion of the disk and the irradiated MS companion (see Fig. 19). The disk surface flow is accelerated by the central WD and its outflow velocity gradually increases outward. This tendency is roughly consistent with the Gaussian component velocities of km s-1 (inner portion of the He II line) and km s-1 (outer portion of the H).
The disk structure is asymmetric as shown in Figure 19, so that we observe the largest positive velocity at phase 0.65 (midpoint between phase 0.4 and 0.9) and the lowest negative velocity at phase 0.15 if the disk surface flow is much faster than the orbital motion. Adding the orbital motion of the WD to the disk outflow, the phase of the largest positive velocity should be shifted a bit later because the orbital motion reaches its largest velocity at phase 0.75. Therefore, phase 0.68 is reasonable. For the lowest negative velocity, the phase should also be delayed from phase 0.15 because the orbital motion of the WD component reaches the lowest negative value at phase 0.25. In this sense, phase 0.18 is also reasonable.
During phase 0.5 to 0.8, the blue shifted component of the disk flow is blocked by the elevated disk edge as seen in Figure 19, so that an extended blue wing is probably cut in the spectra as well as the self-absorption feature. Diaz (1999) showed contour maps of phase-resolved line intensities both for the He II and H lines. The above feature is clearly shown in Figures 4 and 5 of Diaz (1999) both for the He II and H lines.
Closely looking at the radial velocity change of the reddest contour in Figures 4 and 5 of Diaz (1999), we easily find that the radial velocity reaches maximum of km s-1 at phase and minimum of km s-1 at phase , which suggests an amplitude of km s-1 and an outflow velocity of km s-1. These kinematic velocities are consistent with our WD wind model. However, the bluest contour shows the minimum velocity of km s-1 at phase 0.2 and the maximum velocity of km s-1 at phase 0.6 for the He II line. This asymmetric feature is very similar to those of He II emission line in the optical high state (see Fig. 17), although the outflow velocity is smaller in the low state. It is therefore likely that the blue edges of these emission lines are self-absorbed even in the optical low state, unless it is significantly contaminated by C IIIN III complex in the blue edge over km s-1.
To summarize, our WD wind model possibly gives us natural explanations of the observational features, i.e., He II emission (together with H) in the optical high states and He II emissions, C IV doublet and 1551, and He II emission (together with H) in the optical low states, at least qualitatively.
7.5 Weak soft X-ray flux
Diaz & Steiner (1995) pointed out that soft X-ray flux of V Sge is too weak to be compatible with the typical supersoft X-ray sources, for example, at least two or three orders of magnitude lower than that of CAL 87. In this subsection, we try to resolve this problem. Our numerical results are summarized as follows: (1) the distance to V Sge is 3 kpc, (2) the temperature of the WD is between eV as seen in Figure 9, and (3) the bolometric luminosity is erg s-1. If we adopt the color excess of and the corresponding hydrogen column density of cm-1 (Gorenstein, 1975), the ROSAT/PSPC count rate is calculated to be larger than 2 counts s-1. However, the observed rate is only 0.02 counts s-1 (Greiner & van Teeseling, 1998), at least, two orders of magnitude smaller than that of our WD model.
The central WD is always occulted by the elevated disk edge in the CAL 87 model (model d) of Schandl et al. (1997). In this model, a substantial part of soft X-rays can penetrate the elevated edge of the disk, i.e., the spray is semi-transparent at short wavelength (see private communication of F. Meyer in Lederle & Kimeswenger, 2003). Very recently, Suleimanov, Meyer, & Meyer-Hofmeister (2003) formulated X-ray radiation reprocessing in the elevated edge of the disk. In their results, some fraction of soft X-rays leak from the elevated edge that consists of many small size cloud blobs and hot ( K) intercloud medium. The mass transfer rate in CAL 87 is estimated to be as small as yr-1 and two orders of magnitude smaller than that for our V Sge model. It is very likely that the density of spray is much (e.g., two orders of magnitude) larger in V Sge than in CAL 87. This much more opaque elevated disk edge results in a very low flux of soft X-rays even if the system configuration (orbital period and inclination) is almost the same between these two systems.
7.6 Galactic counterpart of RX J0513.96951
Greiner & van Teeseling (1998) concluded that the model suggested for RX J0513.96951 (catalog ) cannot explain the X-ray and optical variabilities of V Sge (catalog ). Their reasons are as follows: (1) both the transitions, from the faint to bright and the bright to faint, are very rapid, so that they may occur in within one day (compared to the smooth decline of several days in RX J0513.96951 (catalog )). (2) The expected optical eclipse would become deeper in the brighter state, opposite to what has been observed (Patterson et al., 1998).
Their assumed model for RX J0513.96951 (catalog ) is based on the photospheric expansion/contraction model of the WD envelope (e.g., Pakull et al., 1993; Reinsch et al., 1996, 2000). Their conclusions suggest only that the photospheric expansion/contraction model does not apply to V Sge (catalog ). As already shown in Hachisu & Kato (2003a, b), the photospheric expansion/contraction model cannot explain the X-ray variability even for RX J0513.96951 (catalog ) because the emergence/decay timescale of supersoft X-rays is also as short as days (Reinsch et al., 2000).
On the other hand, our model can naturally explain the above two observational features as follows: (1) the irradiated disk is a main source of the optical light and its flaring-up edge is very variable in a dynamical timescale, i.e., a day or so. This also naturally explain the optical variability from night to night (Lockley et al., 1999; Mader & Shafter, 1997). The difference in the optical variabilities between V Sge (catalog ) and RX J0513.96951 (catalog ) may come from the difference in the inclination angle, i.e., for V Sge (catalog ) but for RX J0513.96951 (catalog ) (Hutchings et al., 2002; Hachisu & Kato, 2003b). The irradiated area of the flaring-up disk viewed from the Earth varies much more largely in the binary system with a higher inclination angle. (2) As recently reported in Cowley et al. (2002), the eclipse depth of RX J0513.96951 (catalog ) is deeper in the optical low state than in the optical high state. This is the same as what has been observed in V Sge (catalog ). Our models can reproduce the orbital modulations both in the optical high and low states both for V Sge (catalog ) and RX J0513.96951 (catalog ). Thus, we may conclude that V Sge (catalog ) is essentially the same type of objects as RX J0513.96951 (catalog ), and its Galactic counterpart.
7.7 Relevance to Type Ia supernovae
Thus, our optically thick wind model of mass-accreting white dwarfs can reproduce many observational features of V Sge. We suggest that V Sge is the second example of accretion wind evolution, which is a key evolutionary process to Type Ia supernovae in a recently developed evolutionary scenario (Hachisu et al., 1996, 1999a, 1999b; Hachisu & Kato, 2001b). In the accretion wind evolution phase, the donor transfers mass to the white dwarf at a high rate of yr-1 or more. In an old picture, the white dwarf expands to a giant size to form a common envelope and results in merging. However, the white dwarf begins to blow a massive wind in such a high mass accretion rate instead of simply expanding. A formation of common envelope is avoided and the separation of the binary is almost unchanged. In the accretion wind evolution phase, the white dwarf accretes matter and burns hydrogen atop the white dwarf core. Then, the white dwarf can grow in mass at the critical rate, yr-1, up to the Chandrasekhar mass limit and explodes as a Type Ia supernova. With the first and second examples of accretion wind evolution RX J0513.96951 (catalog ) (Hachisu & Kato, 2003a, b) in the LMC and V Sge (catalog ) in our Galaxy, we may conclude that accretion wind evolution is established in the evolutionary scenario to Type Ia supernovae. In other words, accretion wind evolution commonly occurs in the supersoft X-ray sources when the mass transfer rate exceeds the critical rate of yr-1.
The life time of V Sge (catalog ) phenomena is as short as yr, because the mass transfer rate is as large as yr-1. V Sge (catalog ) belongs to the helium-rich supersoft X-ray source channel in the Type Ia supernova scenario of Hachisu et al. (1999b). This channel can produce about one Type Ia supernova per millennium, indicating that we have a chance to observe about a hundred V Sagittae stars in our Galaxy. Steiner & Diaz (1998) have already listed four V Sagittae (catalog ) stars in our Galaxy and discussed their similar properties. Although the mass of the companion star to the WD is not clearly identified yet, their orbital periods fall in the range of days, being very consistent with the orbital periods that the new scenario predicted (see Fig. 3 of Hachisu & Kato, 2001b).
8 CONCLUSIONS
We have proposed a model of long-term optical variations in the peculiar binary V Sge based on an optically thick wind model of mass-accreting white dwarfs. Our binary model, which is consisting of a mass-accreting white dwarf (WD), an accretion disk around the WD, and a lobe-filling main-sequence (MS) companion star, reproduces orbital light curves both for the optical high and low states. Moreover, our WD wind model naturally explains the transition between the optical high and low states.
Here, we summarize our main results:
1. When the mass accretion rate to the white dwarf
exceeds a critical rate, the white dwarf photosphere expands to
blow a fast and massive wind. The disk surface is blown in the wind
and optically thick parts of the disk extend to a large size
over the Roche lobe. The largely extended disk,
which is irradiated by a WD photosphere,
contributes much to the optical light. This corresponds to
the optical high states.
2. The fast and massive wind hits the donor star and strips off
the surface layer. The mass transfer rate from the
donor is attenuated. As a result, the wind gradually weakens and stops.
Then the disk shrinks to a size of
the Roche lobe. This (no wind) phase corresponds
to the optical low states because the disk irradiation area also
becomes small.
3. In the optical bright state, we are able to reproduce
the orbital light curves of V Sge (catalog )
with a large extension of the disk.
In the optical faint state, the orbital light curves
are reproduced with a small size (similar size to the Roche lobe)
of the disk having an elevated edge as seen in the supersoft X-ray
sources.
4. The massive wind easily shields supersoft X-rays.
Therefore, soft X-rays are not detected in the wind phase, i.e.,
in the optical high state. This is consistent with
the soft X-ray behavior found by Greiner & van Teeseling (1998).
Furthermore, our wind model also explain the hard X-ray
component during the optical high state if they are shock-origin
(Greiner & van Teeseling, 1998).
5. The observed radio flux indicates a wind mass loss rate of
yr-1 (Lockley et al., 1997). Our optically thick
wind model of mass-accreting white dwarfs
naturally explain such a high mass loss rate.
6. Various features of the emission lines both in the optical
high and low states are also naturally explained by our model.
7. Optically thick winds from mass-accreting WDs
play an essential role in a recently developed evolutionary
scenario of Type Ia supernovae (Hachisu et al., 1996, 1999a, 1999b).
This process is called accretion wind evolution.
V Sge is the second example of accretion wind evolution
with the first example of the LMC supersoft X-ray source
RX J0513.96951 (Hachisu & Kato, 2003a, b).
With these two examples of accretion wind evolution,
we may conclude that optical high/low states with
wind being on/off are a common physical feature
in the supersoft X-ray sources if the mass transfer rate
exceeds the critical rate of yr-1.
8. V Sge (catalog ) is a strong
candidate for Type Ia supernova progenitors.
References
- Alcock et al. (1996) Alcock, C. et al. 1996, MNRAS, 280, L49
- Bressan et al. (1993) Bressan, A., Fagotto, F., Bertelli, G., & Chiosi, C. 1993, A&AS, 100, 647
- Cowley et al. (2002) Cowley, A.P., Schmidtke, P.C., Crampton, D., & Hutchings, J.B. 2002, AJ, 124, 2233
- Cowley et al. (1993) Cowley, A. P., Schmidtke, P. C., Hutchings, J. B., Crampton, D., & McGrath, T. K. 1993, ApJ, 418, L63
- Crampton et al. (1996) Crampton, D., Hutchings, J. B., Cowley, A. P., Schmidtke, P. C., McGrath, T. K., O’Donoghue, D., & Harrop-Allin, M. K. 1996, ApJ, 456, 320
- Diaz (1999) Diaz, M. P. 1999, PASP, 111, 76
- Diaz & Steiner (1995) Diaz, M. P., & Steiner, J. E. 1995, AJ, 110, 1816
- Fukue & Hachiya (1999) Fukue, J., & Hachiya, M. 1999, PASJ, 51, 185
- Gänsicke et al. (1998) Gänsicke, B. T., van Teeseling, A., Beuermann, K., & de Martino, D. 1998, A&A, 333, 163
- Gies et al. (1998) Gies, D. R., Shafter, A. W., & Wiggs, M. S. 1998, AJ, 115, 2566
- Greiner & van Teeseling (1998) Greiner, J., & van Teeseling, A. 1998, A&A, 339, L21
- Gorenstein (1975) Gorenstein, P. 1975, ApJ, 198, 95
- Hachisu & Kato (2001a) Hachisu, I., & Kato, M. 2001a, ApJ, 553, L161
- Hachisu & Kato (2001b) Hachisu, I., & Kato, M. 2001b, ApJ, 558, 323
- Hachisu & Kato (2003a) Hachisu, I., & Kato, M. 2003a, ApJ, 588, 1003
- Hachisu & Kato (2003b) Hachisu, I., & Kato, M. 2003b, ApJ, 590, 445
- Hachisu et al. (1996) Hachisu, I., Kato, M., & Nomoto, K. 1996, ApJ, 470, L97
- Hachisu et al. (1999a) Hachisu, I., Kato, M., & Nomoto, K. 1999a, ApJ, 522, 487
- Hachisu et al. (1999b) Hachisu, I., Kato, M., Nomoto, K., & Umeda, H. 1999b, ApJ, 519, 314
- Hachisu et al. (2003) Hachisu, I., Kato, M., & Schaefer, B. E. 2003, ApJ, 584, 1008
- Herbig et al. (1965) Herbig, G. H., Preston, G. W., Smak, J., & Paczynski, B. 1965, ApJ, 141, 617
- Hoard et al. (1996) Hoard, D. W., Wallerstein, G., & Willson, L. A. 1996, PASP, 108, 81
- Hutchings et al. (2002) Hutchings, J. B., Winter, K., Cowley, A. P., Schmidtke, P. C., & Crampton, D. 2002, AJ, 124, 2833
- Kato (1983) Kato, M. 1983, PASJ, 35, 507
- Kato & Hachisu (1994) Kato, M., & Hachisu, I., 1994, ApJ, 437, 802
- Koch et al. (1986) Koch, R. H., Corcoran, M. F., Holenstein, B. D., McCluskey, G. E. Jr. 1986, ApJ, 306, 618
- Langer et al. (2000) Langer, N., Deutschmann, A., Wellstein, S., & Höflich, P. 2000, A&A, 362, 1046
- Lederle & Kimeswenger (2003) Lederle, C., & Kimeswenger, S. 2003, A&A, 397, 951
- Li & van den Heuvel (1997) Li, X.-D., & van den Heuvel, E. P. J. 1997, A&A, 322, L9
- Lockley (1998) Lockley, J. J. 1998, Ph. D. thesis, Univ. Keele
- Lockley et al. (1997) Lockley, J. J., Eyres, S. P. S., & Wood, Janet H. 1997, MNRAS, 287, L14
- Lockley & Wood (1998) Lockley, J. J., & Wood, J. H. 1998, in ASP Conf. Ser. 137, 13th North American Work Shop on Cataclysmic Variables, ed. S. Howell, E. Kuulkers, & C. Woodward (San Francisco: ASP), 461
- Lockley et al. (1999) Lockley, J. J., Wood, J. H., Eyres, S. P. S., Naylor, T., & Shugarov, S. 1999, MNRAS, 310, 963
- Mader & Shafter (1997) Mader, J., & Shafter, A. 1997, PASP, 109, 1351
- Pakull et al. (1993) Pakull, M. W., Moch, C., Bianchi, L., Thomas, H.-C., Guibert, J., Beaulieu, J. P., Grison, P., & Schaeidt, S. 1993, A&A, 278, L39
- Patterson et al. (1998) Patterson, J. et al. 1998, PASP, 110, 380
- Reinsch et al. (1996) Reinsch, K., van Teeseling, A., Beuermann, K., & Abbott, T. M. C. 1996, A&A, 309, L11
- Reinsch et al. (2000) Reinsch, K., van Teeseling, A., King, A. R., & Beuermann, K. 2000, A&A, 354, L37
- Ritter et al. (2000) Ritter, H., Zhang, Z.-Y., & Kolb, U. 2000, A&A, 360, 959
- Robertson et al. (1997) Robertson, J. W., Honeycutt, R. K., & Pier, J. R. 1997, AJ, 113, 787
- Schaeidt et al. (1993) Schaeidt, S., Hasinger, G., & Truemper, J. 1993, A&A, 270, L9
- Schandl et al. (1997) Schandl, S., Meyer-Hofmeister, E., & Meyer, F. 1997, A&A, 318, 73
- Shakura & Sunyaev (1973) Shakura, N. I., & Sunyaev, R. A. 1973, A&A, 24, 337
- Šimon (1996a) Šimon, V. 1996a, A&AS, 118, 421
- Šimon (1996b) Šimon, V. 1996b, A&A, 309, 775
- Šimon et al. (2002) Šimon, V., Hric, L., Petríc, K., Shugarov, S., Niarchos, P., & Marsakova, V. I. 2002, A&A, 393, 921
- Šimon & Mattei (1999) Šimon, V., & Mattei, J. A. 1999, A&AS, 139, 75
- Šimon et al. (2001) Šimon, V., Shugarov, S., Marsakova, V. I. 2001, A&A, 366, 100
- Smak (1995) Smak, J. I. 1995, Acta Astr., 45, 361
- Smak et al. (2001) Smak, J. I., Belczynski, K., & Zola, S. 2001, Acta Astr., 51, 117
- Southwell et al. (1996) Southwell, K. A., Livio, M., Charles, P. A., O’Donoghue, D., & Sutherland, W. J. 1996, ApJ, 470, 1065
- Steiner & Diaz (1998) Steiner, J. E., & Diaz, M. P. 1998, PASP, 110, 276
- Suleimanov et al. (2003) Suleimanov, V., Meyer, F., & Meyer-Hofmeister, E. 2003, A&A, 401, 1009
- van den Heuvel et al. (1992) van den Heuvel, E. P. J., Bhattacharya, D., Nomoto, K., & Rappaport, S. 1992, A&A, 262, 97
- Williams et al. (1986) Williams, G. A., King, A. R., Uomoto, A. K., & Hiltner, W. A. 1986, MNRAS, 219, 809
- Wood & Lockley (1997) Wood, J. H., & Lockley, J. J. 1997, in IAU Colloq. 163, Accretion Phenomena and Related Outflows, ed. D. T. Wickramasinghe, G. V. Bicknell, & L. Ferrario (ASP Conf. Ser. 121) (San Francisco: ASP), 457
- Wood & Lockley (2000) Wood, J. H., & Lockley, J. J. 2000, MNRAS, 313, 789
| high | low | light | comments | |||||
|---|---|---|---|---|---|---|---|---|
| yr | (day) | (days) | (days) | curve | ||||
| 0.8 | 2.5 | 5.0 | 13.9 | 10.0 | modulationaamass accretion rate is modulated by winds | |||
| 0.8 | 2.5 | 5.0 | 41.6 | 10.0 | modulation | |||
| 1.0 | 3.0 | 5.0 | 41.6 | 10.0 | modulation | |||
| 1.1 | 3.5 | 5.0 | 41.6 | 10.0 | 250 | 90 | ||
| 1.1 | 3.5 | 5.0 | 41.6 | 5.0 | modulation | |||
| 1.1 | 3.5 | 5.0 | 69.4 | 5.0 | 310 | 30 | ||
| 1.1 | 3.5 | 5.0 | 69.4 | 1.5 | modulation | |||
| 1.1 | 3.5 | 5.0 | 97.2 | 1.5 | modulation | |||
| 1.1 | 3.5 | 5.0 | 111. | 1.5 | 390 | 10 | ||
| 1.1 | 3.5 | 5.0 | 139. | 1.5 | 420 | 40 | ||
| 1.1 | 3.5 | 5.0 | 194. | 1.5 | 500 | 100 | ||
| 1.1 | 3.5 | 40. | 41.6 | 12.0 | 430 | 70 | ||
| 1.1 | 3.5 | 40. | 41.6 | 13.0 | 430 | 110 | ||
| 1.1 | 3.5 | 40. | 41.6 | 14.0 | 430 | 150 | Fig.11b | |
| 1.2 | 3.5 | 5.0 | 41.6 | 10.0 | 180 | 170 | ||
| 1.2 | 3.5 | 5.0 | 41.6 | 5.0 | 190 | 20 | ||
| 1.2 | 3.5 | 5.0 | 41.6 | 1.5 | modulation | |||
| 1.2 | 3.5 | 5.0 | 69.4 | 1.5 | 230 | 10 | ||
| 1.2 | 3.5 | 5.0 | 97.2 | 1.5 | 270 | 40 | ||
| 1.2 | 3.5 | 5.0 | 139. | 1.5 | 320 | 90 | ||
| 1.2 | 3.5 | 10. | 41.6 | 10.0 | 230 | 170 | ||
| 1.2 | 3.5 | 10. | 41.6 | 7.0 | 230 | 60 | ||
| 1.2 | 3.5 | 10. | 41.6 | 5.0 | modulation | |||
| 1.2 | 3.5 | 20. | 41.6 | 10.0 | 270 | 150 | ||
| 1.2 | 3.5 | 20. | 41.6 | 9.0 | 270 | 110 | ||
| 1.2 | 3.5 | 20. | 41.6 | 7.0 | 270 | 40 | ||
| 1.2 | 3.5 | 20. | 41.6 | 5.0 | modulation | |||
| 1.2 | 3.5 | 30. | 41.6 | 9.0 | 280 | 100 | ||
| 1.2 | 3.5 | 30. | 41.6 | 10.0 | 290 | 140 | Fig.10b | |
| 1.2 | 3.5 | 40. | 41.6 | 10.0 | 300 | 140 | ||
| 1.2 | 3.5 | 40. | 41.6 | 9.0 | 300 | 100 | ||
| 1.2 | 3.5 | 40. | 41.6 | 7.0 | 300 | 20 | ||
| 1.2 | 3.5 | 40. | 41.6 | 5.0 | modulation | |||
| 1.25 | 2.5 | 25. | 41.6 | 8.0 | 220 | 130 | Fig.16a | |
| 1.25 | 3.0 | 25. | 41.6 | 8.0 | 220 | 130 | Fig.16b,d,e | |
| 1.25 | 3.5 | 0.64 | 41.6 | 8.0 | 70 | 130 | Fig.12a | |
| 1.25 | 3.5 | 1.0 | 41.6 | 1.5 | no modulationbbmass accretion rate is slightly attenuated but not modulated largely by winds, so that it is almost constant in time | |||
| 1.25 | 3.5 | 1.0 | 41.6 | 8.0 | 80 | 120 | Fig.12b | |
| 1.25 | 3.5 | 2.0 | 41.6 | 8.0 | 100 | 130 | Fig.12c | |
| 1.25 | 3.5 | 5.0 | 41.6 | 8.0 | 150 | 140 | Fig.12d | |
| 1.25 | 3.5 | 10. | 41.6 | 8.0 | 190 | 130 | Fig.12e | |
| 1.25 | 3.5 | 20. | 41.6 | 8.0 | 220 | 120 | Fig.12f | |
| 1.25 | 3.5 | 25. | 13.9 | 8.0 | Fig.13a | modulation | ||
| 1.25 | 3.5 | 25. | 27.8 | 8.0 | 200 | 30 | Fig.13b | |
| 1.25 | 3.5 | 25. | 41.6 | 1.5 | modulation | |||
| 1.25 | 3.5 | 25. | 41.6 | 3.0 | Fig.14a | modulation | ||
| 1.25 | 3.5 | 25. | 41.6 | 5.0 | 220 | 10 | Fig.14b | |
| 1.25 | 3.5 | 25. | 41.6 | 8.0 | 220 | 130 | Fig.9b | |
| 1.25 | 3.5 | 25. | 41.6 | 8.0 | 230 | 120 | ||
| 1.25 | 3.5 | 25. | 41.6 | 10.0 | 220 | 210 | Fig.14d | |
| 1.25 | 3.5 | 25. | 41.6 | 12.0 | 220 | 280 | Fig.14e | |
| 1.25 | 3.5 | 25. | 55.5 | 8.0 | 240 | 240 | Fig.13d | |
| 1.25 | 3.5 | 25. | 69.4 | 8.0 | 260 | 340 | Fig.13e | |
| 1.25 | 3.5 | 30. | 41.6 | 9.0 | 220 | 160 | ||
| 1.25 | 3.5 | 40. | 41.6 | 8.0 | 230 | 130 | Fig.12h | |
| 1.3 | 3.5 | 0.7 | 41.6 | 7.0 | 60 | 120 | ||
| 1.3 | 3.5 | 1.0 | 41.6 | 7.0 | 70 | 100 | ||
| 1.3 | 3.5 | 2.0 | 41.6 | 7.0 | 90 | 130 | ||
| 1.3 | 3.5 | 5.0 | 41.6 | 10.0 | 130 | 220 | ||
| 1.3 | 3.5 | 5.0 | 41.6 | 7.0 | 130 | 140 | ||
| 1.3 | 3.5 | 5.0 | 41.6 | 5.0 | 130 | 80 | ||
| 1.3 | 3.5 | 5.0 | 41.6 | 1.5 | 130 | 20 | ||
| 1.3 | 3.5 | 5.0 | 69.4 | 1.5 | 160 | 40 | ||
| 1.3 | 3.5 | 5.0 | 125. | 1.5 | 220 | 100 | ||
| 1.3 | 3.5 | 10. | 41.6 | 10.0 | 150 | 240 | ||
| 1.3 | 3.5 | 10. | 41.6 | 7.0 | 150 | 140 | ||
| 1.3 | 3.5 | 10. | 41.6 | 5.0 | 150 | 70 | ||
| 1.3 | 3.5 | 10. | 41.6 | 1.5 | 150 | 10 | ||
| 1.3 | 3.5 | 20. | 41.6 | 10.0 | 170 | 250 | ||
| 1.3 | 3.5 | 20. | 41.6 | 7.0 | 170 | 130 | Fig.8b | |
| 1.3 | 3.5 | 20. | 41.6 | 5.0 | 170 | 60 | ||
| 1.3 | 3.5 | 20. | 41.6 | 1.5 | 170 | 10 | ||
| 1.3 | 3.5 | 40. | 41.6 | 10.0 | 180 | 260 | ||
| 1.3 | 3.5 | 40. | 41.6 | 7.0 | 180 | 140 | ||
| 1.3 | 3.5 | 40. | 41.6 | 5.0 | 180 | 60 | ||
| 1.3 | 3.5 | 40. | 41.6 | 1.5 | 180 | 10 |