INFRARED SPECTROSCOPY OF 15 RADIO GALAXIES AT
Abstract
Near-infrared spectra of 15 high-redshift radio galaxies (HzRGs) located at were obtained by the OH Airglow Suppressor spectrograph mounted on the Subaru telescope. The UV-optical line ratio diagnostic diagrams indicate that half of the observed HzRGs have extended emission-line regions with low metal abundance, photoionized by a flat-continuum active galactic nucleus such as a quasar. We also found two probable correlations between radio and rest-optical parameters: (1) HzRGs with massive hosts tend to have a redder rest-optical continuum, and (2) HzRGs with smaller radio sizes also show a redder optical continuum. On the basis of the correlations, the nature of HzRGs at is discussed.
1 INTRODUCTION
High redshift radio galaxies (HzRGs) have been studied as progenitors of the present massive galaxies. Their rest-UV morphologies usually show a clumpy structure with a bright nucleus (Rush et al., 1997; Pentericci et al., 1999), aligned with the axis of the radio sources in the so-called alignment effect. The major cause of the alignment effect is considered to be one of the following three mechanisms: (1) induced star formation by the passage of the radio jet (McCarthy et al., 1987; Chambers, Miley, & van Breugel, 1987), (2) scattered light from a hidden active galactic nucleus (AGN: di Serego Alighieri et al. 1989; Cimatti et al. 1993), and (3) the nebular continuum (Dickson et al., 1995). These stellar, AGN, and nebular components make a nearly equal contribution to the UV continuum at the nucleus region of intermediate-redshift radio galaxies (Tadhunter et al., 2002). The rest-optical imaging of HzRGs shows the morphological evolution of host galaxies: multiple components spread over 100 kpc at , a single compact structure dominating at , and an elliptical profile with a de Vaucouleurs r1/4 law formed at (van Breugel et al., 1998; Pentericci et al., 2001). The morphologies of the extended emission-line regions (EELRs) indicate the existence of a photoionization cone or shock-ionized region extended to several tens of kiloparsecs (Armus et al., 1998; Motohara et al., 2000; Egami et al., 2003). They strongly support the unification model between radio loud quasars and radio galaxies.
The characteristics of HzRGs have been investigated by rest-UV spectroscopy. An HzRG with a smaller radio size has dense H I clouds surrounding the inner Ly emitting region with a large turbulent velocity, probably because of the environmental effect on the radio size (van Ojik et al., 1997). The total (nucleus+EELR) ionization mechanism of UV emission lines is well explained by photoionization with a power-law index of (Villar-Martín, Tadhunter, & Clark, 1997), except for C II], which is enhanced by shock (De Breuck et al., 2000), and N V, which indicates an overabundance of nitrogen (Villar-Martín et al. 1999, 2001; Vernet et al. 2001) Concerning the physical conditions of the EELR, the existence of a metallicity gradient (Overzier et al., 2001) and the contribution of shock in the outer halo (Taniguchi et al., 2001) were reported, but the general mechanisms are still unknown. The contribution of the scattered AGN light to the UV continuum varies from object to object, between and , estimated by spectropolarimetry (Vernet et al., 2001).
On the other hand, rest-optical spectra of HzRGs show strong [O III] emission lines whose intensity has a correlation with the radio luminosity (Eales & Rawlings, 1993, 1996; Iwamuro et al., 1996; Evans, 1998). Reddened quasar light (or broad H) has also been detected from a few HzRGs (Larkin et al., 2000; Fosbury, 2000). The emission line ratios of individual knots around the nucleus indicate that shock or starburst is the major ionization mechanism of these off-nuclear knots (Carson et al., 2001). Although the rest-optical spectra of HzRGs became observable within a reasonable exposure time by the newly built infrared instruments on the large telescopes, the published data are not sufficient to make statistical studies.
In this paper we present the rest-optical spectra of 15 HzRGs at obtained by the OH Airglow Suppressor (OHS) spectrograph (Iwamuro et al., 2001) mounted on the Subaru telescope. The typical wavelength coverage of 3400–5400 Å includes major emission lines of AGNs, such as [O II] 3727, He II 4686, H, and [O III] 5007. In we describe the observations and the reduction procedure of the 15 HzRGs. In , after we summarize the observed emission-line properties, we examine the major ionization mechanisms using UV-optical line ratio diagnostic diagrams. In we discuss the nature of HzRGs on the basis of the probable correlations between several observed parameters, and we present our conclusions in .
Throughout the paper we adopt a cosmology with km s-1 Mpc-1, , and .
2 OBSERVATIONS AND DATA REDUCTION
A total of 15 well-known HzRGs with redshifts at were observed during five test observation runs of the OHS mounted on the Subaru telescope in 2000 May, July, September, and December and 2001 August. For many targets, the rest-UV (and a part of the rest-optical) spectra and Hubble Space Telescope (HST) and Very Large Array images are available from the past literature. The rest-optical spectroscopy was carried out with the slit along the radio axis. The typical exposure sequence is 1000 s in four positions, in which the object is moved about 10″ along the slit by nodding the telescope after every exposure. The limiting magnitude is =21.1 (S/N=5 for 4000 s) at best with this sequence. A nearby Smithsonian Astrophysical Observatory (SAO) star with a spectral type of A or F was observed just after this exposure sequence and was used as a spectroscopic standard to remove telluric atmosphere absorption features and to correct the instrumental response. The - (1.108–1.353 m) and -band (1.477–1.804 m) spectra were simultaneously obtained with a spectral resolution of 210. A slit width of 1″ corresponds to 9 pixels on a pixel scale of 0111 in the case of the optical secondary mirror of the telescope, which was generally used during these observations. Since the typical seeing size of 07 is smaller than the slit width, we must take the morphology of the object within the slit into account when we consider the velocity structure of the emission lines. The observation log is summarized in Table 1.
All data reduction was performed using IRAF as follows:
-
1.
Sky subtraction for a pair of spectroscopic images taken at different positions.
-
2.
Flat-fielding using a standard -band flat image (for correction of the local variations in the quantum efficiency).
-
3.
Correction of unexpected hot pixels and cosmic-ray events.
-
4.
Straightening of residual-airglow emission lines along column pixels.
-
5.
Residual-airglow subtraction by fitting to each column excluding object positions (plus and minus images).
-
6.
Shift-and-add of all images.
-
7.
Correction of atmospheric absorption features and instrumental responses using the spectrum of the SAO star taken just after pointing at the object (where correction has already been applied to the hydrogenous absorption features and the intrinsic slope in the SAO spectrum).
-
8.
Straightening of the object spectrum along line pixels.
-
9.
Extraction of the object spectrum using a one-dimensional Gaussian mask with an FWHM of 3″, except for TXS 0211122, B3 0731438, 4C +10.48, 4C +10.48 (FWHM of 4″), and 4C +23.56 (FWHM of 2″).
The resulting one-dimensional spectrum was calibrated using the photometric results of the -band slitless imaging frame taken just before the spectroscopic observation. As a result, the average flux of the -band spectrum corresponds to the -band magnitude within an aperture diameter of 22 (20 pixels).
3 RESULTS
3.1 Line Fluxes and Continuum Levels
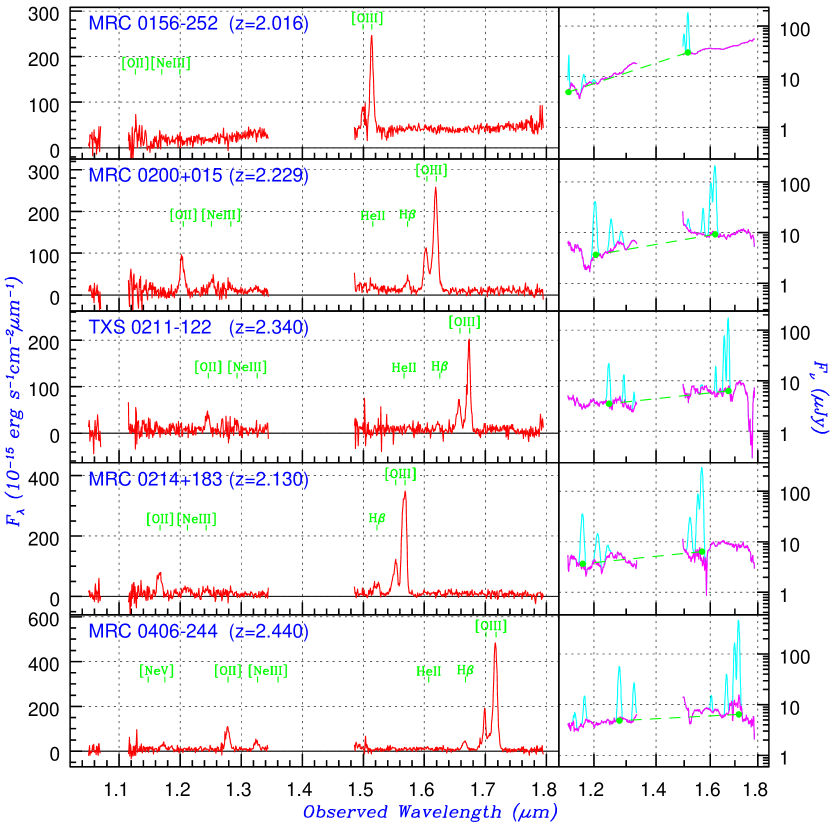
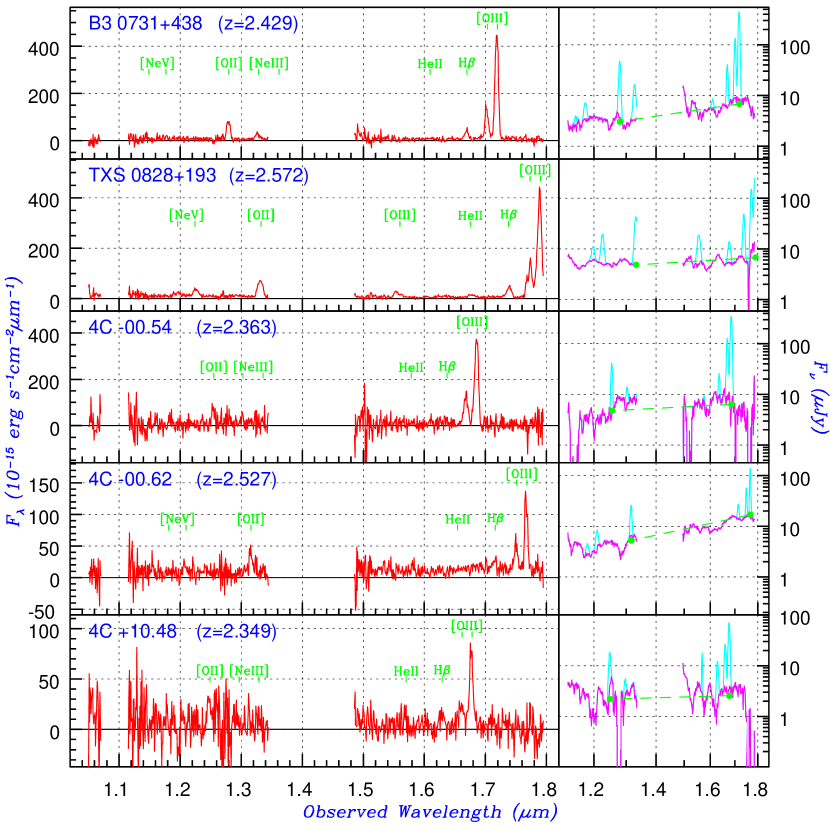
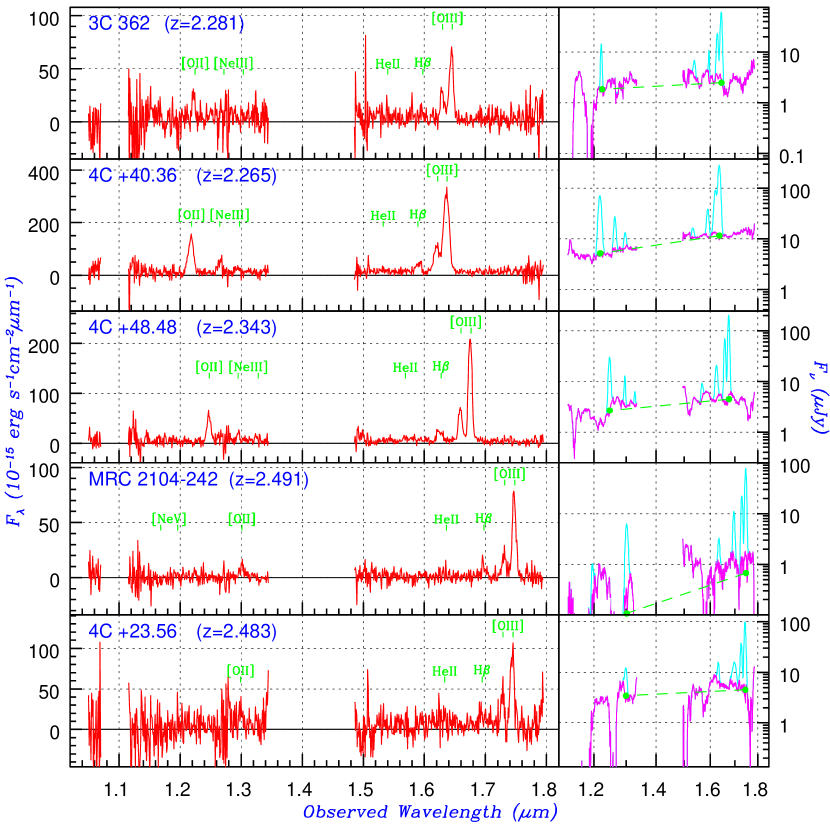
The final flux-calibrated spectra are presented in Figure 1. The right panels of this figure show the continuum profiles with 30 pixel smoothing, after fitting and subtraction of the emission lines with Gaussian functions. In this fitting procedure, each emission line is restored, fitted again, and subtracted individually to improve the estimation of the local continuum level (which is often affected by the residuals of neighboring emission lines). In order to achieve higher fitting accuracy, we assume a constant line ratio as well as the same FWHM and redshift for the following neon doublets: 3.32 for [Ne III] 3869, 3967 and 2.74 for [Ne V] 3426, 3346, which are calculated by CLOUDY94 (Ferland, 2000). Since both doublets are emitted by the transition from the to level, these ratios are expected to be invariable. For faint emission lines, we assume that the redshift is the same as that for [O III] 5007 and that the FWHM is the instrumental value of 75 Å. The emission line properties and the continuum levels are listed in Table 2.
3.2 Emission Line Ratios
3.2.1 UV-optical diagnostic diagrams
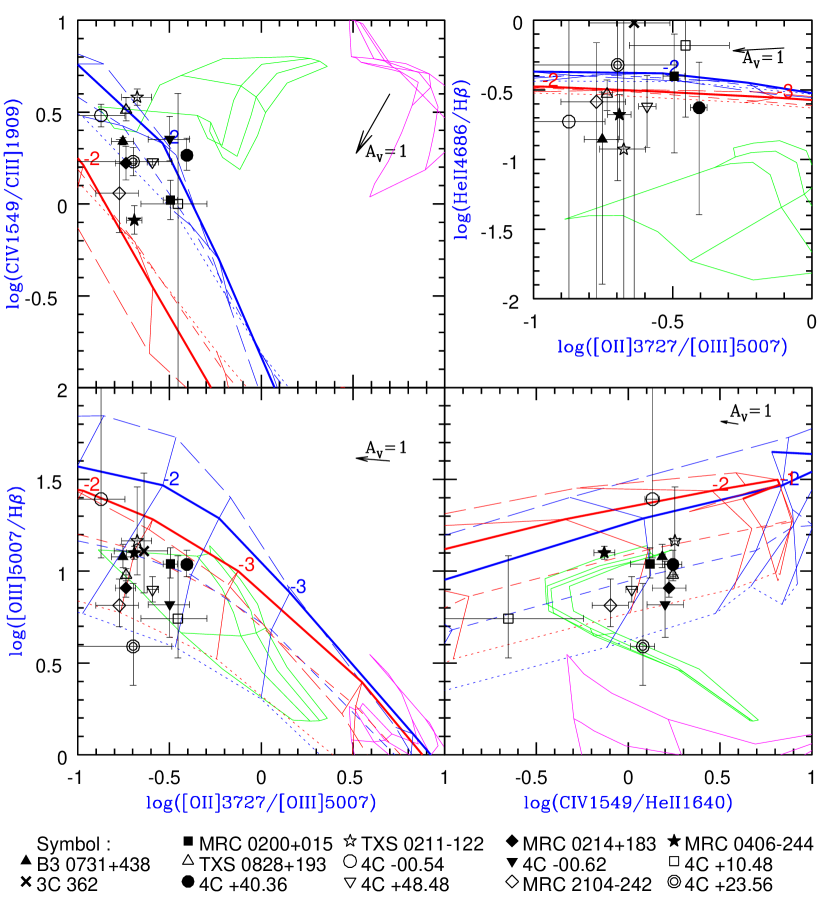
The UV line fluxes of C IV 1549, He II 1640, and C III] 1909 are available for 13 out of 15 HzRGs from the past literature (Table 3). We combine these data with the optical line flux in Table 2 to examine the major ionization mechanisms of HzRGs. Figure 2 shows the UV-optical line ratio diagnostic diagrams. We calculated photoionization sequences with CLOUDY94 (Ferland, 2000) with power-law spectral indexes and , metal abundances and 3.0 , and hydrogen densities and cm-3. The case of cm-3 is plotted in Figure 2. Since the contribution of the hydrogen density to the emission line ratio is smaller than that of the other parameters, we can estimate the rough trend of and only from this case. The grid of the shock(+precursor) models (Dopita & Sutherland, 1995; Allen et al., 1999; De Breuck et al., 2000) is also plotted in Figure 2.
The [O II]/[O III] vs. [O III]/H diagram in Figure 2 is one of the most useful diagnostic diagrams for estimating the ionization parameter log, while the [O II]/[O III] vs. C IV/C III] and C IV/He II vs. [O III]/H diagrams have advantages for estimating and , respectively. The degeneracy of the parameters can be solved by these diagrams, indicating , , and log for our sample. On the other hand, the shock+precursor models are completely separated from the photoionization models in the [O II]/[O III] vs. He II/H diagram. The majority of our samples seem to agree with the photoionization models; however, we cannot rule out the shock+precursor models for several objects only by this figure. The dust extinction, which may have a significant effect on the scatter of the data in the top left diagram of Figure 2, is expected to be small, because (1) the sizes of the EELRs are very large (10–30 kpc), and (2) the color of the rest-UV continuum (Röttgering et al., 1997; Vernet et al., 2001) is blue.
3.2.2 Best fit parameters
To determine the best-fit parameters for each object, we considered a nine-dimensional line ratio diagnostic diagram, which consists of all the UV/UV combinations of three UV lines (C IV, He II, and C III]: three combinations) and all the optical/optical combinations of four optical lines ([O II], H, He II, and [O III]: six 6 combinations). Here we did not use any UV-optical line ratios, which may be affected by the differences of the instruments and the other observation parameters. In this nine-dimensional diagnostic diagram, the model grids as shown in Figure 2 were divided into 10 subgrids at even intervals. After the most probable subgrid giving the minimum value was found, the nearest subgrids were divided into 10 sub-subgrids in order to search the most probable sub-subgrids again. The best-fit model with parameters was determined by iteration of the above calculation, as listed in Table 4. More than half of the objects can be explained by a photoionization model with a flat ionizing continuum and low metallicity, consistent with the distribution of the data in Figure 2. On the other hand, four objects are (also) in good agreement with the shock+precursor model, while three objects cannot be explained by a single-photoionization or shock+precursor model with a significant confidence level.
4 DISCUSSION
4.1 Correlations between Parameters
Before we discuss the nature of HzRGs, we review the correlations between the radio parameters (size, power, and spectral index) and the observed rest-optical parameters (continuum brightness, spectral index, [O III] luminosity, and FWHM). The significance levels at which the null hypothesis of zero correlation is disproved are listed in Table 5 together with the correlation coefficients. Values marked with an asterisk in Table 5 indicate the probable correlations. In we discuss these correlations individually.
4.2 Probable Correlations
4.2.1 Correlation between and
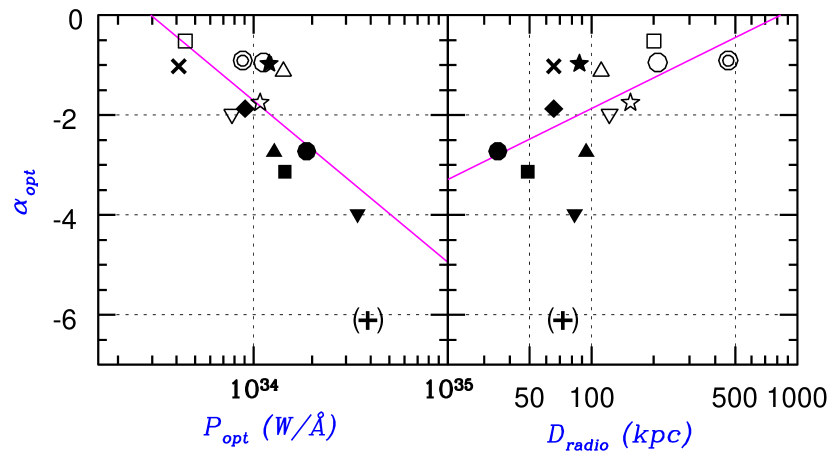
The correlation of the rest-optical continuum slope between [O II] 3727 and [O III] 5007 (; see Figure 1) with the continuum brightness at the rest-5007 Å wavelength () is shown in the left panel of Figure 3. Here roughly represents the mass of the host galaxy, because most of the continuum flux at the rest-5007 Å wavelength is expected to be of stellar origin (e.g., Fosbury 2000). With this taken into account, the - correlation indicates that a HzRG with a massive host has a redder optical color. For reference, the values of the instantaneous starburst model change from 0.2 (10 Myr) via 1.7 (100 Myr) to 4.1 (1 Gyr) without dust extinction, while the value of the scattered AGN light is expected to be 0.
4.2.2 Correlation between and
The correlations of with the radio size () are shown in the right panel of Figure 3. A radio source with a smaller is usually thought to have a younger age of radio activity (Blundell & Rawlings, 1999) or/and have dense gas clouds that interrupt the expansion of the radio jet (O’Dea 1998 and references therein). On the basis of the former idea, the older radio source should inhabit the bluer host galaxy, which seems difficult to explain. The latter idea indicates that the redder HzRG not only has a massive host (see ) but also tends to be surrounded by dense gas clouds. Although the significance level of the - correlation does not reach a high confidence level (see Table 5), this inverse correlation does not conflict with this idea. The age of the radio source probably contributes to the scatter in these correlations.
4.3 Nature of HzRGs at
From the UV-optical diagnostic diagrams and the probable correlations discussed above, the nature of HzRGs located at is summarized as follows: The HzRGs with massive hosts show a redder optical color, indicating that the scattered light of the AGNs or massive blue stellar population does not make a significant contribution to their rest-optical spectra. These galaxies are also surrounded by dense gas clouds that interrupt the expansion of the radio jet. The radio activities do not have a large effect on these massive hosts, because the ages of the host galaxies expected from their red optical color (100 Myr) are older than the ages of typical radio activities (10 Myr). On the other hand, the HzRGs with less massive hosts are not surrounded by dense gas clouds, corresponding to a larger radio size. The considerable contribution of the scattered light of the AGNs or massive blue stellar population makes their optical color blue. From the results of rest-UV spectropolarimetry reported by Vernet et al. (2001), the scattered light is the dominant contribution to these blue HzRGs with larger radio sizes (while massive red HzRGs such as B3 0731438 and 4C +40.36 have a smaller contribution from scattered light). The ages of the host galaxies expected from their blue optical color (100 Myr) are almost comparable to the ages of radio activities, implying that the current radio activities are closely related to the formation of the host galaxies.
The EELRs of HzRGs are usually photoionized by a flat-continuum AGN such as a quasar (), and the metal abundance is expected to be subsolar (). In a few objects, shock+precursor is the dominant ionization mechanism of the EELR, and three out of 13 objects cannot be explained by the single-ionization mechanism. A likely explanation is that the ionization mechanism of the EELR varies regionally, which requires further investigation into the spatial variation of the emission line ratios as well as the combination of photoionization and shock+precursor models (De Breuck et al., 2000; Moy & Rocca-Volmerange, 2002) to fit the entire EELR spectra.
5 CONCLUSIONS
The nature of HzRGs located at was investigated using their rest-optical spectra obtained by the OHS mounted on the Subaru telescope. We found two probable correlations between the radio and rest-optical parameters of the observed HzRGs as well as the characteristics of their ionization condition using UV-optical diagnostic diagrams.
-
1.
Correlation of -.— HzRGs with massive hosts tend to have a redder optical continuum, indicating that the contribution of the scattered light of the AGNs or massive blue stellar population to the rest-optical spectra of these massive HzRGs is quite small. The contribution of the scattered light becomes larger for less massive objects, making their color blue.
-
2.
Correlation of -.— HzRGs with smaller radio sizes also show a redder optical continuum. Together with the above correlation, HzRGs with massive hosts are surrounded by dense gas clouds, which interrupt the expansion of the radio jets. The radio activities do not have a large effect on these massive hosts, while they are closely related to the formation of the smaller host galaxies.
-
3.
UV-optical diagnostic diagrams.— More than half of the examined HzRGs are photoionized by a flat-continuum AGN such as a quasar (), which supports the unification model between HzRGs and quasars. In this case, the metal abundance of the EELR is subsolar (). The shock+precursor models can explain a few cases, being expected to contribute to three other cases, which cannot be fitted by a single model.
Appendix A Notes on Particular Objects
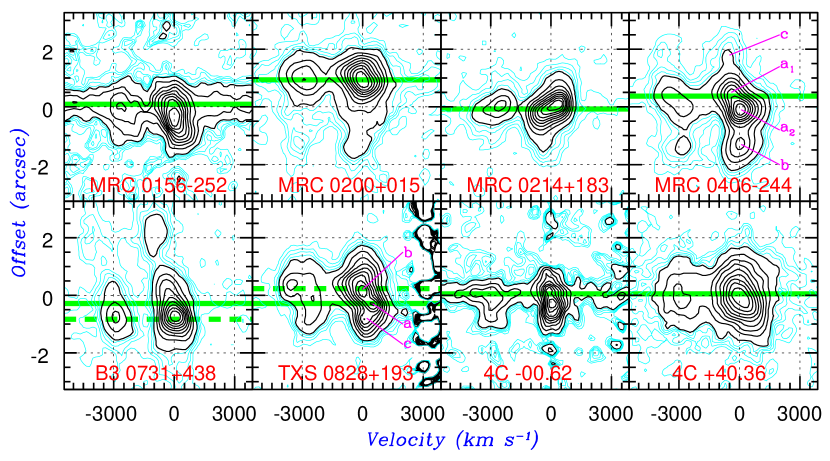
Although most objects have a compact nucleus surrounded by an EELR, some of them show knotlike components or significant velocity structure. In this appendix, we show the two-dimensional spectra of these particular objects (Figures 4 and 5) and discuss their features individually.
A.1 MRC 0156252
This spectrum consists of a compact red continuum and [O III] emission lines. Since the position angle of the slit (50∘) is almost the same as the position angle of the -band morphology of this galaxy taken by HST/NICMOS (Pentericci et al., 2001), the origin of the tilt of the [O III] emission lines is not a morphological effect within the slit but a redshifted velocity structure of 500 km s-1. This [O III] jet extends southwest along the slit from the nucleus. Our result is consistent with the dusty-quasar nature of this object reported by Eales & Rawlings (1996).
A.2 MRC 0200+015
This galaxy has an [O III] knot separated 22 south-southeast from the nucleus, which probably corresponds to the south radio lobe of this object (Carilli et al., 1997).
A.3 MRC 0214+183
The detailed morphology of this galaxy is unknown. If the inclination of emission lines is due to the velocity difference, this galaxy has bipolar jets with velocities of approximately +400 and 600 km s-1 to the north and south directions, respectively.
A.4 MRC 0406244
This spectrum shows multiple components of emission lines with a single continuum. The main body of this galaxy consists of two components in the optical and near-infrared images taken by HST (Rush et al., 1997; Pentericci et al., 2001), which correspond to components a1 and a2 in Figure 5. Component a1 is located at the ridge of the continuum emission of the host galaxy. Component a2 is a redshifted knot with a velocity of 500 km s-1. The other two knots (components b and c in Figure 5) are parts of the outer EELR of this galaxy.
A.5 B3 0731+438
The knotlike structure of the [O III] emission lines are a part of the ionization cone of this galaxy (Motohara et al., 2000). The velocity offset of this component is not real but due to the morphological structure within the slit. Most of the line emission comes from the southern ionization cone, where a faint blue continuum is marginally detected, indicating the existence of a blue stellar population rather than scattered AGN light (Vernet et al., 2001).
A.6 TXS 0828+193
This galaxy has the most complicated spectrum in our sample. The [O III] emission lines consist of three components, which correspond to the knots b, a, and c in Figure 5 of Steinbring, Crampton, & Hutchings (2002) from top to bottom. We cannot confirm a velocity structure of [O III] emission lines, because it is probably caused by a morphological effect within the slit. The continuum emission shows two components: one is a bluer northern component including [O III] knot b, and the other is a redder southern component including [O III] knot a. These results strongly support the idea that the northern component is the scattered light from a hidden AGN in the southern host galaxy (Pentericci et al. 1999; Steinbring et al. 2002).
A.7 4C 00.62
The EELR of this galaxy extends along the radio jet to the west-southwest direction (Pentericci et al., 2000).
A.8 4C +40.36
This spectrum shows the most broad [O III] emission-line width in our sample, which is more than 1400 km s-1 after the instrumental contribution is subtracted. The distortion of emission lines is probably due to the morphological structure of this object (Egami et al., 2003).
References
- Allen et al. (1999) Allen, M. G., Dopita, M. A., Tsvetanov, Z. I., & Sutherland, R. S. 1999, ApJ, 511, 686
- Armus et al. (1998) Armus, L., Soifer, B. T., Murphy, T. W., Neugebauer, G., Evans, A. S., & Matthews, K. 1998, ApJ, 495, 276
- Blundell & Rawlings (1999) Blundell, K. M. & Rawlings, S. 1999, Nature, 399, 330
- Carilli et al. (1997) Carilli, C. L., Röttgering, H. J. A., van Ojik, R., Miley, G. K., & van Breugel, W. J. M. 1997, ApJS, 109, 1
- Carson et al. (2001) Carson, J. E. et al. 2001, ApJ, 563, 63
- Chambers, Miley, & van Breugel (1987) Chambers, K. C., Miley, G. K., & van Breugel, W. 1987, Nature, 329, 604
- Cimatti et al. (1993) Cimatti, A., di Serego-Alighieri, S., Fosbury, R. A. E., Salvati, M., & Taylor, D. 1993, MNRAS, 264, 421
- De Breuck et al. (2000) De Breuck, C., Röttgering, H., Miley, G., van Breugel, W., & Best, P. 2000, A&A, 362, 519
- Dickson et al. (1995) Dickson, R., Tadhunter, C., Shaw, M., Clark, N., & Morganti, R. 1995, MNRAS, 273, L29
- di Serego Alighieri et al. (1989) di Serego Alighieri, S., Fosbury, R. A. E., Tadhunter, C. N., & Quinn, P. J. 1989, Nature, 341, 307
- Dopita & Sutherland (1995) Dopita, M. A. & Sutherland, R. S. 1995, ApJ, 455, 468
- Eales & Rawlings (1993, 1996) Eales, S. A. & Rawlings, S. 1993, ApJ, 411, 67
- Eales & Rawlings (1996) Eales, S. A. & Rawlings, S. 1996, ApJ, 460, 68
- Egami et al. (2003) Egami, E., Armus, L., Neugebauer, G., Murphy, T. W., Soifer, B. T., Matthews, K., & Evans, A. S. 2003, AJ, 125, 1038
- Evans (1998) Evans, A. S. 1998, ApJ, 498, 553
- Ferland (2000) Ferland, G. J. 2000, Revista Mexicana de Astronomia y Astrofisica Conference Series, 9, 153
- Fosbury (2000) Fosbury, R. A. 2000, Proc. SPIE, 4005, 76
- Iwamuro et al. (1996) Iwamuro, F., Oya, S., Tsukamoto, H., & Maihara, T. 1996, ApJ, 466, L67
- Iwamuro et al. (2001) Iwamuro, F., Motohara, K., Maihara, T., Hata, R., & Harashima, T. 2001, PASJ, 53, 355
- Larkin et al. (2000) Larkin, J. E. et al. 2000, ApJ, 533, L61
- McCarthy et al. (1987) McCarthy, P. J., van Breugel, W., Spinrad, H., & Djorgovski, S. 1987, ApJ, 321, L29
- Motohara et al. (2000) Motohara, K. et al. 2000, PASJ, 52, 33
- Moy & Rocca-Volmerange (2002) Moy, E. & Rocca-Volmerange, B. 2002, A&A, 383, 46
- O’Dea (1998) O’Dea, C. P. 1998, PASP, 110, 493
- Overzier et al. (2001) Overzier, R. A., Röttgering, H. J. A., Kurk, J. D., & De Breuck, C. 2001, A&A, 367, L5
- Pentericci et al. (1999) Pentericci, L., Röttgering, H. J. A., Miley, G. K., McCarthy, P., Spinrad, H., van Breugel, W. J. M., & Macchetto, F. 1999, A&A, 341, 329
- Pentericci et al. (2000) Pentericci, L., Van Reeven, W., Carilli, C. L., Röttgering, H. J. A., & Miley, G. K. 2000, A&AS, 145, 121
- Pentericci et al. (2001) Pentericci, L., McCarthy, P. J., Röttgering, H. J. A., Miley, G. K., van Breugel, W. J. M., & Fosbury, R. 2001, ApJS, 135, 63
- Röttgering et al. (1997) Röttgering, H. J. A., van Ojik, R., Miley, G. K., Chambers, K. C., van Breugel, W. J. M., & de Koff, S. 1997, A&A, 326, 505
- Rush et al. (1997) Rush, B., McCarthy, P. J., Athreya, R. M., & Persson, S. E. 1997, ApJ, 484, 163
- Steinbring, Crampton, & Hutchings (2002) Steinbring, E., Crampton, D., & Hutchings, J. B. 2002, ApJ, 569, 611
- Tadhunter et al. (2002) Tadhunter, C., Dickson, R., Morganti, R., Robinson, T. G., Wills, K., Villar-Martin, M., & Hughes, M. 2002, MNRAS, 330, 977
- Taniguchi et al. (2001) Taniguchi, Y. et al. 2001, ApJ, 559, L9
- van Breugel et al. (1998) van Breugel, W. J. M., Stanford, S. A., Spinrad, H., Stern, D., & Graham, J. R. 1998, ApJ, 502, 614
- van Ojik et al. (1997) van Ojik, R., Röttgering, H. J. A., Miley, G. K., & Hunstead, R. W. 1997, A&A, 317, 358
- Vernet et al. (2001) Vernet, J., Fosbury, R. A. E., Villar-Martín, M., Cohen, M. H., Cimatti, A., di Serego Alighieri, S., & Goodrich, R. W. 2001, A&A, 366, 7
- Villar-Martín, Tadhunter, & Clark (1997) Villar-Martin, M., Tadhunter, C., & Clark, N. 1997, A&A, 323, 21
- Villar-Martín et al. (1999) Villar-Martín, M., Fosbury, R. A. E., Binette, L., Tadhunter, C. N., & Rocca-Volmerange, B. 1999, A&A, 351, 47
- Villar-Martín et al. (2001) Villar-Martín, M., Fosbury, R., Vernet, J., Cohen, M., Cimatti, A., & di Serego Alighieri, S. 2001, Astrophysics and Space Science Supplement, 277, 571
| Exposure | Slit P.A. | Seeing | |||||
|---|---|---|---|---|---|---|---|
| Common Name | IAU Name | -magaaObserved -band magnitudes by OHS imaging observations with a 22-diameter aperture. Typical photometric errors are 0.05 mag. | Redshift | Date | Time (s) | (degree) | (arcsec) |
| MRC 0156252 (catalog ) | 0156252 | 18.45 | 2.016 | 2000 Sep 15 | 4000 | 50 | 0.6 |
| MRC 0200015 (catalog ) | 0200015 | 19.26 | 2.229 | 2001 Jul 31 | 3000 | 24 | 0.6 |
| TXS 0211122 (catalog ) | 0211122 | 19.82 | 2.340 | 2000 Dec 18 | 4000 | 78 | 0.7 |
| MRC 0214183 (catalog ) | 0214183 | 19.19 | 2.130 | 2001 Aug 01 | 5000 | 2 | 0.6 |
| MRC 0406244 (catalog ) | 0406244 | 19.11 | 2.440 | 2000 Sep 15 | 6000 | 48 | 0.6 |
| B3 0731438 (catalog ) | 0731438 | 19.35 | 2.429 | 2000 Dec 17 | 4000 | 18 | 0.6 |
| TXS 0828193 (catalog ) | 0828193 | 19.40 | 2.572 | 2000 Dec 18 | 4000 | 38 | 0.7 |
| 4C 00.54 (catalog ) | 1410001 | 19.48 | 2.363 | 2000 May 20 | 3000 | 47 | 0.6 |
| 4C 00.62 (catalog ) | 1558003 | 19.69 | 2.527 | 2000 May 21 | 4000 | 76 | 0.6 |
| 4C +10.48 (catalog ) | 1707105 | 20.72 | 2.349 | 2001 Aug 01 | 4000 | 52 | 0.8 |
| 3C 362 (catalog ) | 1744183 | 20.67 | 2.281 | 2000 May 22 | 3000 | 51 | 0.7 |
| 4C +40.36 (catalog ) | 1809407 | 18.93 | 2.265 | 2000 May 23 | 3200 | 82 | 0.8 |
| 4C +48.48 (catalog ) | 1931480 | 19.86 | 2.343 | 2000 Jul 24 | 4000 | 29 | 1.0 |
| MRC 2104242 (catalog ) | 2104242 | 21.13 | 2.491 | 2000 Sep 14 | 4000 | 17 | 0.8 |
| 4C +23.56 (catalog ) | 2105233 | 20.22 | 2.483 | 2000 Jul 24 | 1000bbThe exposure sequence was terminated by instrument trouble with the telescope. | 51 | 0.8 |
| Wavelength | Line | Equivalent | FWHMa,da,dfootnotemark: | Continuum | |||
|---|---|---|---|---|---|---|---|
| Common Name | Lines | (m) | RedshiftaaFor faint emission lines represented by an ellipsis, we assume that the redshift is the same as that for [O III] 5007 and that the FWHM is the instrumental value of 75 Å. | FluxbbThe flux with 1 errors, in units of 10-16 erg s-1 cm-2. | WidthccThe rest-frame equivalent width. The signal-to-noise ratios are almost the same as that of the flux. (Å) | (km s-1) | LeveleeThe flux density of the continuum at the line position in units of 10-15 erg s-1 cm-2 m-1. |
| MRC 0156252 | [O III] 5007 | 1.5139 | 2.0237 | 13.020.52 | 109 | 1213 | 39.57 |
| [Ne III] 3869 | 1.1699 | … | 0.840.52 | 20 | … | 13.94 | |
| [O II] 3727 | 1.1276 | 2.0256 | 1.550.76 | 44 | 784 | 11.75 | |
| MRC 0200015 | [O III] 5007 | 1.6184 | 2.2322 | 21.600.34 | 630 | 1628 | 10.60 |
| H | 1.5722 | 2.2342 | 1.970.34 | 51 | 1402 | 12.00 | |
| He II 4686 | 1.5157 | 2.2346 | 0.780.52 | 17 | 1492 | 13.86 | |
| [Ne III] 3869 | 1.2522 | 2.2365 | 2.600.42 | 97 | 2189 | 8.27 | |
| [O II] 3727 | 1.2033 | 2.2286 | 6.920.52 | 282 | 2045 | 7.59 | |
| TXS 0211122 | [O III] 5007 | 1.6727 | 2.3407 | 12.180.31 | 545 | 1164 | 6.69 |
| H | 1.6220 | 2.3367 | 0.830.40 | 35 | 889 | 7.10 | |
| He II 4686 | 1.5655 | … | 0.100.36 | 4 | … | 7.66 | |
| [Ne III] 3869 | 1.2922 | 2.3399 | 0.910.43 | 42 | 1092 | 6.40 | |
| [O II] 3727 | 1.2449 | 2.3402 | 2.570.42 | 114 | 1622 | 6.74 | |
| MRC 0214183 | [O III] 5007 | 1.5671 | 2.1299 | 32.690.32 | 1346 | 1673 | 7.76 |
| H | 1.5221 | 2.1313 | 4.030.44 | 187 | 2272 | 6.88 | |
| [Ne III] 3869 | 1.2109 | 2.1299 | 2.440.51 | 91 | 2571 | 8.55 | |
| [O II] 3727 | 1.1663 | 2.1293 | 5.990.71 | 237 | 2019 | 8.06 | |
| MRC 0406244 | [O III] 5007 | 1.7161 | 2.4274 | 37.790.34 | 1677 | 1340 | 6.57 |
| H | 1.6658 | 2.4269 | 3.000.21 | 121 | 1389 | 7.23 | |
| He II 4686 | 1.6046 | 2.4243 | 0.630.18 | 24 | 1208 | 7.60 | |
| [Ne III] 3869 | 1.3252 | 2.4251 | 2.890.39 | 95 | 1659 | 8.93 | |
| [O II] 3727 | 1.2778 | 2.4285 | 7.690.67 | 252 | 1786 | 8.91 | |
| [Ne V] 3426 | 1.1723 | 2.4216 | 1.590.29 | 52 | 1661 | 9.01 | |
| B3 0731438 | [O III] 5007 | 1.7183 | 2.4319 | 31.360.43 | 1319 | 1135 | 6.93 |
| H | 1.6690 | 2.4335 | 2.610.34 | 110 | 1179 | 6.94 | |
| He II 4686 | 1.6097 | 2.4352 | 0.370.33 | 17 | 1907 | 6.25 | |
| [Ne III] 3869 | 1.3269 | 2.4296 | 2.150.43 | 125 | 2059 | 5.01 | |
| [O II] 3727 | 1.2792 | 2.4324 | 5.540.69 | 290 | 1508 | 5.56 | |
| [Ne V] 3426 | 1.1751 | 2.4300 | 0.820.52 | 36 | 2334 | 6.72 | |
| TXS 0828193 | [O III] 5007 | 1.7888 | 2.5726 | 35.640.36 | 1571 | 1434 | 6.35 |
| H | 1.7388 | 2.5770 | 3.740.24 | 165 | 1448 | 6.32 | |
| He II 4686 | 1.6773 | 2.5793 | 1.100.20 | 53 | 2060 | 5.84 | |
| H+[O III] | 1.5553 | 2.5746ffThe average redshift for H and [O III] 4363. | 2.350.24 | 105 | 2465 | 6.24 | |
| [O II] 3727 | 1.3314 | 2.5723 | 6.550.23 | 223 | 2134 | 8.22 | |
| [Ne V] 3426 | 1.2257 | 2.5776 | 2.850.30 | 76 | 2302 | 10.43 | |
| 4C 00.54 | [O III] 5007 | 1.6852 | 2.3657 | 28.280.96 | 1251 | 1298 | 6.72 |
| H | 1.6356 | 2.3647 | 1.151.16 | 42 | 1021 | 8.10 | |
| He II 4686 | 1.5772 | … | 0.211.48 | 8 | … | 8.29 | |
| [Ne III] 3869 | 1.3022 | … | 1.101.34 | 29 | … | 11.28 | |
| [O II] 3727 | 1.2540 | 2.3648 | 3.791.15 | 123 | 1166 | 9.18 | |
| 4C 00.62 | [O III] 5007 | 1.7666 | 2.5282 | 6.540.59 | 114 | 856 | 16.29 |
| H | 1.7153 | 2.5287 | 0.990.36 | 19 | 1185 | 14.47 | |
| He II 4686 | 1.6533 | … | 0.000.50 | 0 | … | 12.67 | |
| [O II] 3727 | 1.3155 | 2.5295 | 2.070.35 | 65 | 1301 | 9.08 | |
| [Ne V] 3426 | 1.2088 | … | 0.860.41 | 30 | … | 8.13 | |
| 4C +10.48 | [O III] 5007 | 1.6766 | 2.3486 | 5.620.42 | 615 | 1309 | 2.73 |
| H | 1.6288 | 2.3508 | 1.020.52 | 91 | 1466 | 3.34 | |
| He II 4686 | 1.5685 | 2.3472 | 0.670.36 | 55 | 647 | 3.65 | |
| [Ne III] 3869 | 1.2956 | … | 0.430.66 | 33 | … | 3.95 | |
| [O II] 3727 | 1.2476 | 2.3475 | 1.980.64 | 140 | 1589 | 4.22 | |
| 3C 362 | [O III] 5007 | 1.6442 | 2.2839 | 5.350.28 | 587 | 1397 | 2.78 |
| H | 1.5954 | 2.2820 | 0.420.25 | 38 | 766 | 3.33 | |
| He II 4686 | 1.5388 | … | 0.400.44 | 29 | … | 4.11 | |
| [Ne III] 3869 | 1.2705 | … | 0.020.52 | 2 | … | 4.25 | |
| [O II] 3727 | 1.2221 | 2.2790 | 1.230.34 | 101 | 1099 | 3.71 | |
| 4C +40.36 | [O III] 5007 | 1.6360 | 2.2675 | 35.290.59 | 832 | 1987 | 12.98 |
| H | 1.5905 | 2.2720 | 3.240.48 | 74 | 1723 | 13.33 | |
| He II 4686 | 1.5328 | 2.2709 | 0.760.61 | 17 | 1823 | 13.91 | |
| [Ne III] 3869 | 1.2640 | 2.2670 | 3.100.81 | 89 | 1741 | 10.64 | |
| [O II] 3727 | 1.2179 | 2.2677 | 13.890.73 | 406 | 2390 | 10.47 | |
| 4C +48.48 | [O III] 5007 | 1.6749 | 2.3452 | 15.570.21 | 978 | 1243 | 4.76 |
| H | 1.6246 | 2.3422 | 1.960.28 | 111 | 1795 | 5.28 | |
| He II 4686 | 1.5676 | … | 0.470.20 | 25 | … | 5.60 | |
| [Ne III] 3869 | 1.2953 | 2.3479 | 0.830.22 | 44 | 1044 | 5.58 | |
| [O II] 3727 | 1.2473 | 2.3467 | 3.980.24 | 232 | 1693 | 5.12 | |
| MRC 2104242 | [O III] 5007 | 1.7469 | 2.4889 | 5.730.18 | 2486 | 1220 | 0.66 |
| H | 1.6968 | 2.4907 | 0.880.23 | 307 | 1423 | 0.82 | |
| He II 4686 | 1.6349 | … | 0.230.22 | 76 | … | 0.87 | |
| [O II] 3727 | 1.3012 | 2.4913 | 0.970.22 | 1459 | 1982 | 0.19 | |
| [Ne V] 3426 | 1.1953 | … | 0.140.25 | …ggThe continuum level becomes a negative value. | … | …ggThe continuum level becomes a negative value. | |
| 4C +23.56 | [O III] 5007 | 1.7440 | 2.4832 | 7.330.58 | 474 | 1258 | 4.44 |
| H | 1.6985 | 2.4941 | 1.880.96 | 102 | 3047 | 5.27 | |
| He II 4686 | 1.6322 | … | 0.900.70 | 44 | … | 5.93 | |
| [O II] 3727 | 1.2982 | … | 1.470.74 | 69 | … | 6.13 |
| Common Name | C IV 1549aaThe flux with 1 errors, in units of 10-16 erg s-1 cm-2. | He II 1640aaThe flux with 1 errors, in units of 10-16 erg s-1 cm-2. | C III] 1909aaThe flux with 1 errors, in units of 10-16 erg s-1 cm-2. | Reference |
|---|---|---|---|---|
| MRC 0200015 (catalog ) | 4.20.5 | 3.20.4 | 4.00.5 | 1 |
| TXS 0211122 (catalog ) | 2.820.10 | 1.570.03 | 0.740.05 | 2 |
| MRC 0214183 (catalog ) | 3.00.3 | 1.80.2 | 1.80.2 | 1 |
| MRC 0406244 (catalog ) | 4.00.3 | 5.40.3 | 4.90.5 | 3,4 |
| B3 0731438 (catalog ) | 4.650.10 | 3.040.05 | 2.120.05 | 2 |
| TXS 0828193 (catalog ) | 18.170.45 | 10.380.14 | 5.590.68 | 2 |
| 4C 00.54 (catalog ) | 2.910.20 | 2.150.05 | 0.960.07 | 2 |
| 4C 00.62 (catalog ) | 2.70.3 | 1.70.2 | 1.20.2 | 1 |
| 4C +10.48 (catalog ) | 0.20.2 | 0.90.2 | 0.20.1 | 1 |
| 4C +40.36 (catalog ) | 13.610.51 | 7.770.56 | 7.391.18 | 2 |
| 4C +48.48 (catalog ) | 5.550.05 | 5.320.35 | 3.280.10 | 2 |
| MRC 2104242 (catalog ) | 2.40.3 | 3.00.3 | 2.10.9 | 5,6 |
| 4C +23.56 (catalog ) | 1.800.15 | 1.500.10 | 1.060.10 | 2 |
References. — (1) Röttgering et al. 1997; (2) Vernet et al. 2001; (3) Rush et al. 1997; (4) Taniguchi et al. 2001; (5) Villar-Martín et al. 1999; (6) Overzier et al. 2001.
Note. — The UV line flux taken from the past literature. The typical slit width is , and the spatial extent of the aperture is large enough to cover all the flux of emission lines.
| Single-Photoionization Model | Shock+Precursor model | |||||||
|---|---|---|---|---|---|---|---|---|
| Common Name | aaThe value for the best fit parameters of each model, photoionization () or shock+precursor (), respectively. | log | logbbThe hydrogen density, which is not as sensitive to the emission line ratio compared to the other parameters (see ). | aaThe value for the best fit parameters of each model, photoionization () or shock+precursor (), respectively. | ||||
| MRC 0200015 (catalog ) | 2.94 | 0.615 | 0.260 | 2.415 | 2.00 | 41.8 | … | … |
| TXS 0211122 (catalog ) | 30.3 | … | … | … | … | 6.45 | 0.245 | 500ccMaximum or minimum value of the domain of the parameter. |
| MRC 0214183 (catalog ) | 2.94ddNo correction has been made for the instrumental width of 75 Å, which corresponds to 1400 km s-1 at 1.60 m and 1800 km s-1 at 1.25 m. Note that the typical seeing size () is smaller than the slit width (1″), causing smaller line width than the instrumental value. | 0.500 | 0.183 | 2.269 | 3.47 | 34.6ddDegree of freedom is smaller than the others because He II 4686 was out of the observed range for this object. | … | … |
| MRC 0406244 (catalog ) | 14.2 | 1.176 | 0.530 | 2.323 | 1.00ccMaximum or minimum value of the domain of the parameter. | 115 | … | … |
| B3 0731438 (catalog ) | 41.0eeThe best fit models were rejected for these results. | … | … | … | … | 154 | … | … |
| TXS 0828193 (catalog ) | 117eeThe best fit models were rejected for these results. | … | … | … | … | 251 | … | … |
| 4C 00.54 (catalog ) | 2.40 | 0.896 | 3.000ccMaximum or minimum value of the domain of the parameter. | 1.699 | 1.00ccMaximum or minimum value of the domain of the parameter. | 1.42 | 0.013 | 481 |
| 4C 00.62 (catalog ) | 6.18 | 0.172 | 0.131 | 2.070 | 3.00 | 7.15 | 0.637 | 500ccMaximum or minimum value of the domain of the parameter. |
| 4C +10.48 (catalog ) | 4.41 | 1.250 | 1.762 | 2.477 | 2.00 | 21.2 | … | … |
| 4C +40.36 (catalog ) | 17.4 | 0.402 | 0.278 | 2.272 | 2.00 | 19.7 | … | … |
| 4C +48.48 (catalog ) | 57.8eeThe best fit models were rejected for these results. | … | … | … | … | 162 | … | … |
| MRC 2104242 (catalog ) | 2.94 | 0.660 | 0.147 | 2.554 | 4.00ccMaximum or minimum value of the domain of the parameter. | 6.64 | 0.000ccMaximum or minimum value of the domain of the parameter. | 440 |
| 4C +23.56 (catalog ) | 0.06 | 0.566 | 0.175 | 2.283 | 3.21 | 26.0 | … | … |
| Correlating Value | logaaContinuum brightness at the position of [O III] 5007 emission line. | bbContinuum slope between [O II] 3727 and [O III] 5007 (see Figure 1). MRC 2104242 is not included in this column because the observed -band continuum is too faint to determine the reliable color. | log | logFWHMccFWHM of [O III] emission line without correction of the instrumental width. |
|---|---|---|---|---|
| logddRadio power at rest-178 MHz, interpolated from the observed-408 MHz and 1.4 GHz fluxes. | 0.797(+0.08) | 0.355(0.28) | 0.838(0.06) | 0.781(0.08) |
| logeeRadio size (Carilli et al., 1997; Pentericci et al., 1999, 2000). | 0.164(0.39) | 0.040(+0.57) | 0.214(0.35) | 0.089(0.47) |
| 0.385(0.25) | 0.521(+0.20) | 0.498(0.20) | 0.484(0.20) | |
| log | … | 0.003(0.75) | 0.055(+0.52) | 0.871(0.05) |
| … | … | 0.760(0.09) | 0.558(+0.18) | |
| log | … | … | … | 0.173(+0.39) |
Note. — The significance level at which the null hypothesis of zero correlation is disproved. Smaller value indicates a significant correlation (bold values). Values in parentheses are the correlation coefficients. MRC 0156252 is not included in these calculations because this object is expected to be a dusty quasar, showing different characteristics from the other sample (see Appendix A.1.).