SMC-Type Interstellar Dust in the Milky Way
Abstract
It is well known that the sightline toward HD 204827 in the cluster Trumpler 37 shows an UV extinction curve that does not follow CCM. However, when a dust component, foreground to the cluster, is removed, the residual extinction curve is identical to that found in the SMC within the uncertainties. The curve is very steep and has little or no 2175 Å bump. The position of HD 204827 in the sky is projected onto the edge of the Cepheus IRAS Bubble. In addition, HD 204827 has an IRAS bowshock indicating that it may be embedded in dust swept up by the supernova that created the IRAS Bubble. Shocks due to the supernova may have led to substantial processing of this dust. The HD 204827 cloud is dense and rich in carbon molecules. The 3.4 m feature indicating a C-H grain mantle is present in the dust toward HD 204827. The environment of the HD 204827 cloud dust may be similar to the dust associated with HD 62542 which lies on the edge of a stellar wind bubble and is also dense and rich in molecules. This sightline may be a Rosetta Stone if its environment can be related to those in the SMC having similar dust.
1 Introduction
The Cardelli, Clayton, & Mathis (1989, hereafter CCM) average Milky Way extinction relation, Aλ/AV, is applicable to a wide range of interstellar dust environments, including lines of sight through diffuse dust and dark cloud dust, as well as dust associated with star formation. However, the CCM relation does not usually apply beyond the Milky Way, even in other Local Group galaxies such as the Magellanic Clouds and M31 (e.g., Clayton & Martin 1985; Fitzpatrick 1985, 1986; Clayton et al. 1996; Bianchi et al. 1996; Gordon & Clayton 1998; Misselt, Clayton, & Gordon 1999). There is some evidence that it may apply along some sightlines in the Large Magellanic Cloud (Gordon et al. 2003). It is important to understand why dust in these other galaxies is different since many extragalactic environments seem to contain interstellar dust that is better represented by dust in the SMC than the Milky Way (e.g., Gordon, Calzetti, & Witt 1997; Pitman, Clayton, & Gordon 2000). Real deviations from CCM are seen for a few sightlines in the Galaxy (Cardelli & Clayton 1991; Mathis & Cardelli 1992). Sightlines such as those toward HD 62542, HD 204827, and HD 210121 show weak bumps and anomalously strong far-UV extinction for their measured values of RV. Other steep far-UV, weak bump dust was found along some low density, low extinction sightlines (Clayton, Gordon, & Wolff 2000). The extinction along these sightlines resembles those seen in the LMC but none approach the extreme properties of the SMC sightlines. Nevertheless, studying these anomalous Galactic sightlines may be a key to relating the differing extinction characteristics to various dust environments seen in the Milky Way and other galaxies.
The ultraviolet extinction properties of dust toward 18 stars in Trumpler 37, including HD 204827, were studied more than 15 years ago (Clayton & Fitzpatrick 1987, hereafter CF). At that time, the UV extinction, in this region of the sky, was referred to as anomalous as it was generally steeper than the average Galactic extinction curve. This extinction in the Trumpler 37 region is no longer considered anomalous. The extinction curves, with one exception, fit the CCM relation with RV values less than the Galactic average of 3.1. The exception is HD 204827, which has an extinction curve significantly steeper than the appropriate CCM curve.
In this paper, we take advantage of improved IUE data along with infrared data from 2MASS and IRAS to re-investigate the dust associated with HD 204827 and Trumpler 37.
2 UV Extinction Curves
IUE spectra for all eighteen stars in Trumpler 37, previously studied by CF, were obtained from the Multimission Archive at Space Telescope (MAST). The archive spectra were reduced using NEWSIPS and then recalibrated using the method developed by Massa & Fitzpatrick (2000). The signal-to-noise of the NEWSIPS IUE spectra have been improved by 10-50% over those used by CF (Nichols & Linsky 1996). Low dispersion LWR/LWP and SWP spectra were selected, from either aperture. Multiple spectra from one camera were averaged and then the long and short-wavelength segments were merged at the shortest wavelength of the SWP. The wavelength coverage is 1200 – 3200 Å. The sample stars and their IUE spectra are listed in Table 1.
The standard pair method, in which a reddened star is compared with an unreddened one of the same spectral type, was used to construct each sightline’s extinction curve (Massa, Savage, & Fitzpatrick 1983). The unreddened comparison stars were selected from Cardelli, Sembach, & Mathis (1992). The spectral matches were made on the basis of comparing the UV spectra of pairs of stars rather than matching their visible spectral types. RV was estimated from the JHK colors as described in Fitzpatrick (1999). AV was found using RV and E(B-V). The extinction curves are normalized to AV. Table 1 lists the sources of the UBV photometry. Photometry in the JHK bands was availabale for all the stars in the sample from the 2MASS database (Cutri et al. 2003). Table 2 lists the spectral type, reddening, and calculated RV for each star in the sample. In general, our UV spectral classifications are in good agreement with those of CF. The resulting extinction curves were fit with the Fitzpatrick-Massa (FM) parameterization (Fitzpatrick & Massa 1990). The fit has been limited to the wavelength range 2700 – 1250 Å (3.7-8.0 m-1), as it is not reliable longward of 2700 Å (E. Fitzpatrick 2002, private communication), and the 1250 Å cut-off excludes the Ly feature at 1215 Å. The normalization of the FM parameters was converted from E(B-V) to AV. The parameters are listed in Table 3. In Figure 1, the extinction curve and corresponding CCM curve for each sightline are shown.
The Cep OB2 association is a complex system with several distinct regions. Previous studies have placed it at a distance of around 800 pc (e.g., Garrison & Kormendy 1976; Georgelin & Georgelin 1976) though an analysis of Hipparcos parallaxes have placed Cep OB2 much closer, at 615 pc (de Zeeuw et al. 1999). Most of the stars in our sample are probably members of the Trumpler 37 association (Marschall & van Altena 1987; de Zeeuw et al. 1999). The possible exceptions are HD 239724, which has been placed at about 3 kpc (Simonson 1968) and HD 204827, placed at about 500 pc (CF). However, de Zeeuw et al. (1999) give a probability of 66% that HD 204827 is a member of Cep OB2, and Marschall & van Altena (1987)give a 93% probability that HD 239724 is a member of Trumpler 37. The distance to HD 204827 is uncertain since it is a spectroscopic binary (Petrie & Pearce 1961; Mason et al. 1998).
With the exception of HD 204827 and HD 239722, the reddenings of all the sample stars lie between E(B-V) of 0.4 and 0.6 mag. This reddening is primarily due to dust foreground to Trumpler 37. Using the average reddening per kpc in the Galaxy, we would expect 0.4-0.5 mag in front of Trumpler 37 if it lies at a distance of 600-800 pc (Spitzer 1973). Therefore, only the sightlines toward HD 204827 (E(B-V) = 1.10) and HD 239722 (E(B-V)=0.93) seem to contain significant amounts of additional dust that may be associated with Trumpler 37 itself.
The calculated values of RV for the sample stars tend to be smaller than 3.1 although almost all the estimated RV values are within 2 of 3.1. Averaging the sixteen stars in the sample having low to moderate reddening, we get E(B-V) = 0.530.01 mag and RV = 2.840.07. As can be seen in Figure 1, with the exception of HD 204827, none of the Trumpler 37 extinction curves deviates more than 2 from its corresponding CCM curve. The dust foreground to the Trumpler 37 appears to be normal diffuse interstellar dust adhering to the CCM relation.
In an effort to separate the effects of the foreground dust and dust local to the cloud, we partially dereddened the IUE spectra and UBVJHK photometry for HD 204827 and HD 239722. A CCM-type extinction corresponding to E(B-V)= 0.55 mag and RV = 2.84 was removed. Extinction curves were then recalculated for these two sightlines using these partially dereddened spectra, their corrected colors, and their original UV comparison spectra. The residual reddening toward HD 204827 from Trumpler 37 dust is E(B-V) 0.55 mag and toward HD 239722 it is E(B-V) 0.4 mag. The new HD 239722 curve is not significantly different from the original curve with the foreground included. They differ by only 1. However, the new HD 204827 curve is significantly different. See Figure 2. It is now extremely steep and has almost no 2175 Å bump. In fact, it is indistinguishable within the uncertainties from the average SMC bar extinction curve (Gordon et al. 2003). This has also been plotted in Figure 2. The two curves lie within 1 of each other.
The FM parameters for HD 204827’s partially unreddened curve were also found. These are listed in Table 3, as are the average values for the SMC Bar (Gordon et al. 2003). They were found with the same method Gordon et al. (2003) used to find FM parameters for the SMC Bar sightlines. This required holding x0 and fixed at 4.60 and 1.00, respectively, while varying the other parameters such that was minimized. Again, these values are within each other’s uncertainties.
2.1 IR Emission
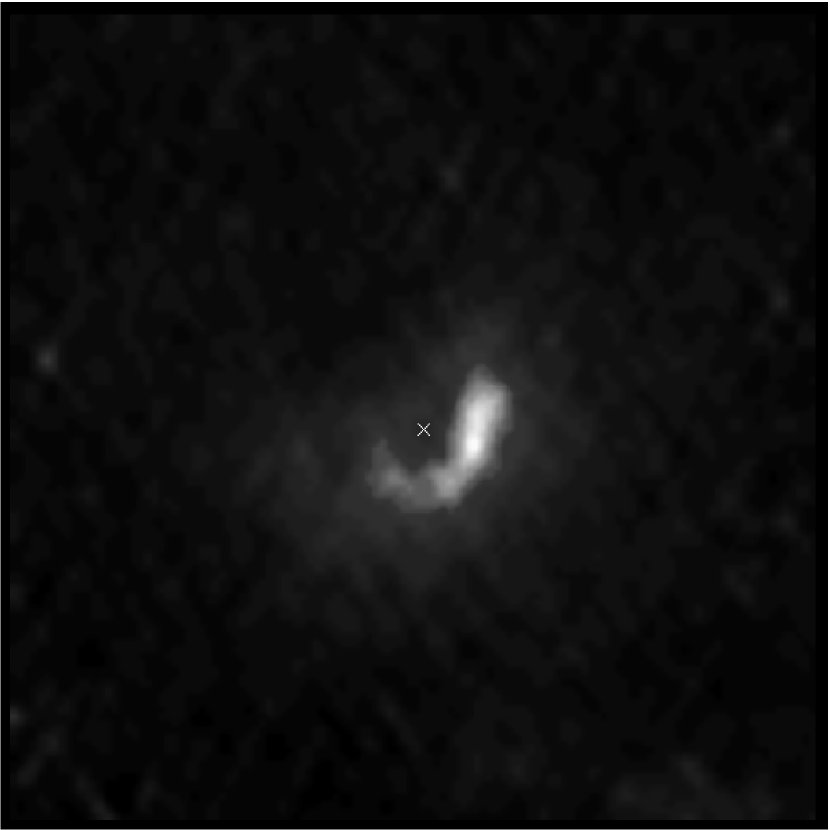
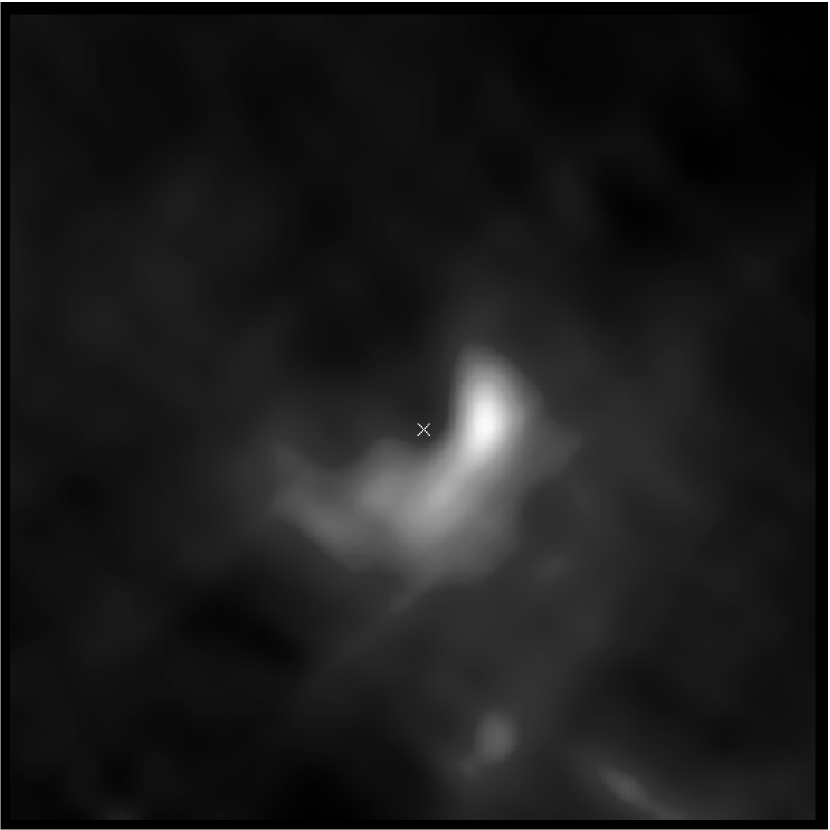
Figure 3 shows 0.5 IRAS HiRes images centered on HD 204827 in the 25 and 60 m bands (Aumann, Fowler & Melnyk 1990). IRAS HiRes images have spatial resolution better than 1′ and fluxes good to 20%. HD 204827 shows an apparent bow shock in the 25 and 60 µm images (van Buren & McCray 1988). Integrated fluxes in Janskys were found over a square aperture of 25′ on each side. The background flux was also found and removed. The measured fluxes are listed in Table 4 along with the color temperatures estimated from the flux ratios (Ward-Thompson & Robson 1991). These are similar to in bow shocks found elsewhere (Ward-Thompson & Robson 1991; van Buren & McCray 1988). We also fit the IRAS fluxes with a blackbody curve. A temperature of 75 K yielded the best fit for the data.
Bow shocks are generally associated with early-type runaway stars having peculiar space velocities in excess of 30 km s-1 (Blauuw 1961). Using the observed radial velocity of HD 204827 (Gies 1987) and its Hipparcos proper motions, we calculate the peculiar space velocity km/s. Since the uncertainty in the velocity is rather large, we can only say that the velocity HD 204827 is consistent with being a runaway star. The standoff distance of the HD 204827 bow shock (4.5′ or 0.9 pc at a distance of 650 pc) seen in Figure 3 is also consistent with this velocity and the standard assumptions made in Van Buren & McCray (1988).
2.2 IR Spectroscopy
In 2001 and 2002 August, IR spectra of HD 204827 and HD 239722 (the other highly reddened cluster member) were obtained with the SpeX instrument at the NASA Infrared Telescope Facility (IRTF). SpeX is a medium resolution spectrograph which can cover a wavelength range from 0.8 to 5.5 m. For this investigation, the 1.9-4.2 m, cross-dispersed mode was used. These data were reduced using version 2.0 of the associated SpexTool software (Cushing, Vacca, & Rayner 2003; Rayner et al. 2003). To remove telluric lines, the spectrum of a ratioing G star was obtained at the same time, with observations bracketing those of the program star. The difference in airmass between the target and the G star averaged 0.02 and they were separated by less than one degree on the sky. The reduced target spectrum was then multiplied by a solar spectrum scaled to match the G star so that the stellar lines introduced by the division would be removed. The resulting spectrum then had a blackbody curve removed, corresponding to the effective temperature of the UV spectral classification. Optical depth plots were then derived following the method of Sandford et al. (1991), by fitting and removing a linear baseline to the reduced spectrum between 3.23 and 3.64 m. For HD 204827, the feature’s optical depth was then measured at 3.42 m (Pendleton et al. 1994), yielding = 0.01390.0036.
HD 204827’s optical depth plot is shown in Figure 4 (top), overlayed with the spectrum of the Murchison meteorite (de Vries et al. 1993) and a zero line for easier comparison. The 3.4 m aliphatic C-H stretch is weak, but present. The middle panel of Figure 4 shows the optical plot with the scaled Murchison spectrum subtracted for emphasis. This feature arises from an organic carrier in the diffuse ISM. Pendleton et al. (1994) used a sample of sightlines, with A 3.9 mag, to show that there is a correlation between AV and the feature’s optical depth , with the average value of AV/ = 27040 in the diffuse ISM. Our value of AV/ = 20563 is in agreement with their results. Thus, the sightline toward HD 204827 sets a new lower limit on the extinction (AV = 2.84) at which the feature has been detected. There is no detectable 3.1 m water ice feature (Pendleton et al. 1994 and references therein). HD 239722 does not show a significant 3.4 µm feature, with = 0.0100.006, though this sightline has a similar amount of extinction (AV=2.660.18 mag) to HD 204827. Accordingly, HD 239722’s AV/ ( = 266178) is not significant. Its spectrum is shown in Figure 4 (bottom), again with a zero line for contrast.
3 Discussion
The residual sightline toward HD 204827 with the foreground dust component removed is unique in the Galaxy. About 400 hundred sightlines in the Galaxy have measured UV extinction curves and no other sightline in the Galaxy shows an extinction curve resembling that seen in the SMC bar (Gordon & Clayton 1998; Valencic et al. 2003). This includes the sightlines near to HD 204827 in the sky which are seen in Figure 1. So the HD 204827 sightline is sampling dust not seen along the nearby sightlines toward Trumpler 37 and Cep OB2. For the purposes of this discussion, we shall refer to this dust as HD 204827 cloud dust. Using a similar method, Whittet et al. (2003) find a bumpless residual dust component but with a flatter UV extinction toward HD 283809 in the Taurus Cloud.
HD 204827 lies in the the outer part of the Trumpler 37 cluster, away from any bright rims or areas of nebulosity, north northwest of IC 1396. Its projected position also lies right on the edge of the Cepheus IRAS Bubble (Patel et al. 1998). The IRAS 100 m image reveals that the position of HD 204827 is projected on the edge of a peninsula of higher optical depth (Abraham, Balazs, & Kun 2000). The presence of the bow shock around HD 204827, indicates that the star may lie in or near the material swept up in the formation of the bubble. It formed through a combination of stellar winds and a supernova explosion from the first generation of star formation in the region, NGC 7160 which occurred about 7 Myr ago (Patel et al. 1998). The Trumpler 37 cluster formed about 5 Myr ago perhaps induced by the formation of the Cepheus Bubble. Shocks such as those in supernovae ejecta will produce a dust grains size distribution skewed toward smaller grains. This will lead to a steeper far-UV extinction but should also lead to a stronger 2175 Å bump since this feature is also believed to result from a population of small grains. (O’Donnell & Mathis 1997).
The four sightlines in the SMC that show extinction similar to that seen toward the HD 204827 dust cloud have quite small reddenings (E(B-V)0.2 mag). In addition, they are low density diffuse ISM sightlines where the dust could have easily been subjected to processing by UV radiation and shocks (Gordon & Clayton 1998; Gordon et al. 2003). A group of similar sightlines in the Galaxy sampling very low density ISM, showed weak bumps and steep non-CCM far-UV extinction (Clayton et al. 2000). But the weakness of the bumps and the steepness of the far-UV extinction of these sightlines do not approach that seen in the SMC. These Galactic sightlines are more similar to the those associated with LMC2 superbubble (Misselt et al. 1999; Gordon et al. 2003).
The environment of the dust in the HD 204827 cloud is quite different from that seen in the SMC sightlines. The column density of the dust (E(B-V)=0.55 mag) in the HD 204827 dust cloud is larger but the cloud also has a much higher density. The HD 204827 dust cloud resembles a molecular cloud more than the diffuse ISM. The cloud is very rich in carbon molecules, showing large column densities of C2, C3, CH, and CN (Oka et al. 2003; Thorburn et al. 2003). In this respect, the HD 204827 cloud dust is quite similar to the sightline toward HD 62542 (Cardelli & Savage 1988). This sightline shows a severely non-CCM sightline with a broad bump and steep far-UV extinction. Its dust is also rich in carbon molecules. The projected position of HD 62542 lies on the edge of material swept up by a stellar wind bubble. Three other non-CCM, weak bump, steep far-UV sightlines in the Galaxy, HD 283809, HD 29647, and HD 210121, are also associated with dense clouds (Cardelli & Savage 1988; Larson, Whittet, & Hough 1996; Cardelli & Wallerstein 1989; Gordon et al. 2003). The dust in the molecular cloud associated with HD 210121 is likely to have been processed as it was propelled into the halo during a Galactic fountain or other event. The other two sightlines toward HD 29647 and HD 283809 seem to be sampling dust in quiescent dense clouds. These two sightlines show a strong 3.1 µm ice feature and a weak 3.4 µm feature similar to the one seen in the HD 204827 cloud dust (Goebel 1983; Smith, Sellgren, & Brooke 1993). The steep far-UV extinction in these clouds helps shield the molecules in these clouds from dissociating UV radiation leading to larger column densities than might be found in clouds with less steep far-UV extinction (Mathis 1990).
So the conditions for producing SMC-type extinction exist in our own galaxy. Those conditions are not necessarily associated with low reddening, low density, diffuse ISM environments. Also, metallicity differences between the Galaxy and the SMC may not be a determining factor. This supports results that find SMC-type extinction in starburst galaxies having a wide range of metallicities (Calzetti, Kinney, & Storchi-Bergmann 1994; Gordon et al.1997).
References
- Abraham et al. (2000) Abraham, P., Balazs, L. G., & Kun, M. 2000, A&A, 354, 645
- Aumann et al. (1990) Aumann, H. H., Fowler, J. W., & Melnyk, M. 1990, AJ, 99, 1674
- Bianchi et al. (1996) Bianchi, L., Clayton, G. C., Bohlin, R. C., Hutchings, J. B., & Massey, P. 1996, ApJ, 471, 203
- Blaauw (1961) Blaauw, A. 1996, BAN, 15, 265
- Calzetti et al. (1994) Calzetti, D., Kinney, A. L., & Storchi-Bergmann, T. 1994, ApJ, 429, 582
- Cardelli & Clayton (1991) Cardelli, J. & Clayton, G. 1991, AJ, 101, 1021
- Cardelli et al. (1989) Cardelli, J., Clayton, G., & Mathis, J. 1989, ApJ, 345, 245
- Cardelli & Savage (1988) Cardelli, J. & Savage, B. 1988, ApJ, 325, 864
- Cardelli et al. (1992) Cardelli, J., Sembach, K. R., & Mathis, J. S. 1992, AJ, 104, 1916
- Cardelli & Wallerstein (1989) Cardelli, J. & Wallerstein, G. 1989, AJ, 97, 1099
- Clayton et al. (1987) Clayton, G. C. & Fitzpatrick, E. L. 1987, AJ, 93, 157
- Clayton et al. (2000) Clayton, G. C., Gordon, K. D., & Wolff, M. J. 2000, ApJ, 129, 147
- Clayton et al. (1996) Clayton, G. C., Green, J., Wolff, M., Zellner, N., Code, A., Davidsen, A., WUPPE Science Team, & HUT Science Team, 1996, ApJ, 460, 313
- Clayton et al. (1985) Clayton, G. C. & Martin, P. G. 1985, ApJ, 288, 558
- Cushing et al. (2003) Cushing, M., Vacca, W., & Rayner, J. 2003, PASP, submitted
- Cutri et al. (2003) Cutri, R.M., et al. 2003, 2MASS Second Incremental All Sky Point Source Catalog
- de Vries et al. (1993) De Vries, M. S., Reihs, K., Wendt, H. R., Golden, W., Hunziker, H., Flemming, R., Peterson, E., & Chang, S. 1993, Geochim. Cosmochim. Acta, 57, 933
- de Zeeuw (1999) De Zeeuw, P. T., Hoogerwerf, R., de Bruijne, J. H. J., Brown, A. G. A., & Blaauw, A. 1999, AJ, 117, 354
- Federman & Lambert (1988) Federman, S. R. & Lambert D. L. 1988, ApJ, 328, 777
- Fitzpatrick (1985) Fitzpatrick, E. L. 1985, ApJS, 59, 77
- Fitzpatrick (1986) Fitzpatrick, E. L. 1986, AJ, 92, 1068
- Fitzpatrick (1999) Fitzpatrick, E. L. 1999, PASP, 111, 63
- Fitzpatrick & Massa (1990) Fitzpatrick, E. & Massa, D. 1990, ApJS, 72, 163
- Garrison & Kormendy (1976) Garrison, R. F. & Kormendy, J. 1976, PASP, 88, 865
- Georgelin & Georgelin (1976) Georgelin, Y. M. & Georgelin, Y. P. 1976, A&A, 49, 57
- Gies (1987) Gies, D. R. 1987, ApJS, 64, 545
- Gordon et al. (1997) Gordon, K., Calzetti, D., & Witt, A. 1997, ApJ, 487, 625
- Gordon & Clayton (1998) Gordon, K. & Clayton, G. 1998, ApJ, 500, 816
- Gordon et al. (2003) Gordon, K., Clayton, G., Misselt, K., Landolt, A., & Wolff, M. 2003, preprint (astro-ph/0305257)
- Hiltner (1956) Hiltner, W. A. 1956, ApJS, 2, 389
- Larson et al. (1996) Larson, K. A., Whittet, D. C. B., & Hough, J. H. 1996, ApJ, 472, 755
- Marschall & van Altena (1987) Marschall, L.A., & van Altena, W.F. 1987, AJ, 94, 71
- Mason (1998) Mason, B. D., Gies, D. R., Hartkopf, W. I., Bagnuolo, W. G. Jr., Brummelaar, T. T., & McAlister, H. A. 1998, AJ, 115, 821
- Massa, D., & Fitzpatrick (2000) Massa, D., & Fitzpatrick, E. L. 2000, ApJS, 126, 517
- Massa et al. (1983) Massa, D. Savage, B. D. & Fitzpatrick, E. L. 1983, ApJ, 266, 662
- Mathis (1990) Mathis, J. 1990, ARA&A, 28, 37
- Mathis & Cardelli (1992) Mathis, J. & Cardelli, J. 1992, AJ, 104, 1916
- Misselt, Clayton & Gordon (1999) Misselt, K. Clayton, G. & Gordon, K. 1999, ApJ, 515, 128
- Nichols & Linsky (1996) Nichols, J.S. & Linsky, J.L. 1996, AJ, 111, 517
- Nicolet (1978) Nicolet, B. 1978, A&AS, 34, 1 1996, AJ, 111, 517
- O’Donnell & Mathis (1997) O’Donnell, J. E. & Mathis, J. S. 1997, ApJ, 479, 806
- Oka (2003) Oka, T., Thorburn, J. A., McCall, B. J., Friedman, S. D., Hobbs, L. M., Sonnentrucker, P., Welty, D. E., & York, D. G. 2003, ApJ, 582, 339
- Patel et al. (1998) Patel, N. A., Goldsmith, P. F., Heyer, M. H., Snell, R. L., & Pratap, P. 1998, ApJ, 507, 241
- Pendleton et al. (1994) Pendleton, Y. J., Sandford, S. A., Allamandola, L. J., Tielens, A. G. G. M. & Sellgren, K. 1994, ApJ, 437, 683
- Petrie & Pearce (1961) Petrie, R. M. & Pearce, J. A. 1961, PDAO, 12, 1
- Pitman et al. (2000) Pitman, K. M., Clayton, G. C., & Gordon, K. D. 2000, PASP, 112, 537
- Rayner et al. (2003) Rayner, J. T., Toomey, D. W., Onaka, P. M., Denault, A. J., Stahlberger, W. D., Vacca, M. C., Cushing, M. C., & Wang, S. 2003, PASP, 155, 362
- Sandford et al. (1991) Sandford, S. A., Allamandola, L. J., Tielens, A. G. G. M., Sellgren, K., Tapia, M., & Pendleton, Y. 1991, ApJ, 371, 607
- Simonson (1968) Simonson, S. C. 1968, ApJ, 154, 923
- Smith (1993) Smith, R. G., Sellgren, K., & Brooke, T. Y. 1993, MNRAS, 263, 749
- Spitzer (1978) Spitzer, L. 1978, Physical Processes in the Interstellar Medium, (New York: John Wiley & Sons, Inc.)
- Thorburn et al. (2003) Thorburn, J. A., Hobbs, L. M., McCall, B. J., Oka, T., Welty, D. E., Friedman, S. D., Snow, T. P., Sonnentrucker, P., York, D. G. 2003, ApJ, 584, 339
- Valencic (2003) Valencic, L. A. Ph.D. Thesis
- Van Buren & McCray (1988) Van Buren, D. & McCray, R. 1988, ApJ, 329, L9
- Ward (1991) Ward-Thompson, D. & Robson, E. I. 1991, MNRAS, 248, 670
- Whittet (1992) Whittet, D. C. B. 1992, Dust In the Galactic Environment, (New York: IOP Publishing Ltd.)
- Whittet (2003) Whittet, D. Senoy, S. Clayton, G. Gordon, K. 2003, in Astrophyics of Dust, in press
Table 1
IUE Spectra and Photometry Sources of Program Stars
| HD/BD | SWP | LWP/LWR | UBV Source |
|---|---|---|---|
| 204827 | 11131, 14530 | 09761, 11104 | 1 |
| 205794 | 23119 | 03451 | 2 |
| 205948 | 23122 | 03453 | 2 |
| 206267 | 26011 | 06057, 17971 | 2 |
| 239683 | 23130 | 03460 | 2 |
| 239689 | 23138 | 03466 | 2 |
| 239693 | 23131 | 03463 | 2 |
| 239710 | 17470 | 13757 | 2 |
| 239722 | 23125 | 03456 | 3 |
| 239724 | 23118 | 03450 | 2 |
| 239725 | 23136 | 03464 | 2 |
| 239729 | 13451 | 10114 | 2 |
| 239738 | 23123 | 03454 | 3 |
| 239742 | 23129 | 03459 | 4 |
| 239745 | 23128 | 03458 | 2 |
| 239748 | 23137 | 03465 | 4 |
| +57 2395B | 23132 | 03461 | 3 |
| +58 2292 | 23139 | 03467 | 3 |
NOTE. – (1) Hiltner 1956, (2) Nicolet 1978, (3) Garrison & Kormendy 1976, (4) Simonson 1968. All JHK photometry is from 2MASS.
Table 2
Properties of Program Stars
| HD/BD | Sp Type | UV Sp Type | E(B-V) | RV |
|---|---|---|---|---|
| 204827 | B0 V | B0 V | 1.100.05 | 2.580.12 |
| 205794 | B5 V | B0.5 V | 0.620.05 | 3.090.26 |
| 205948 | B2 V | B1 V | 0.500.04 | 2.900.27 |
| 206267 | O6 V | O7 V | 0.520.04 | 2.820.22 |
| 239683 | B5 V | B2 IV | 0.540.04 | 2.760.22 |
| 239689 | B5 V | B1 V | 0.450.04 | 2.700.29 |
| 239693 | B5 V | B4 IV | 0.410.04 | 2.370.27 |
| 239710 | B3 V | B1 V | 0.620.07 | 3.020.32 |
| 239722 | B5 V | B1 V | 0.930.05 | 2.860.17 |
| 239724 | B1 III | B1.5 III | 0.620.04 | 3.180.24 |
| 239725 | B5 V | B1 V | 0.520.04 | 3.140.28 |
| 239729 | B0 V | O9 V | 0.660.04 | 3.190.19 |
| 239738 | B5 V | B2 V | 0.510.05 | 2.900.32 |
| 239742 | B5 V | B4 IV | 0.380.04 | 2.360.31 |
| 239745 | B5 V | B1.5 V | 0.540.07 | 2.660.34 |
| 239748 | B5 V | B1 V | 0.430.04 | 2.930.31 |
| +57 2395B | B5 V | B2 V | 0.640.04 | 2.440.19 |
| +58 2292 | B5 V | B2 V | 0.570.03 | 3.000.26 |
Table 3
FM Parameters of Program Stars
| HD/BD | c1/RV | c2/RV | c3/RV | c4/RV | x0 | |
|---|---|---|---|---|---|---|
| 204827 | 1.080.38 | 0.380.03 | 0.660.13 | 0.360.06 | 4.660.02 | 0.910.03 |
| 205794 | 1.270.40 | 0.170.03 | 1.050.19 | 0.140.04 | 4.570.01 | 0.880.02 |
| 205948 | 1.360.43 | 0.160.03 | 1.170.25 | 0.180.04 | 4.590.01 | 0.910.03 |
| 206267 | 1.170.45 | 0.270.04 | 1.020.20 | 0.220.05 | 4.590.01 | 0.910.03 |
| 239683 | 1.210.43 | 0.230.04 | 1.590.39 | 0.240.07 | 4.590.03 | 1.180.04 |
| 239689 | 0.840.27 | 0.280.04 | 1.290.18 | 0.180.03 | 4.570.005 | 0.960.02 |
| 239693 | 1.160.43 | 0.230.05 | 1.130.26 | 0.200.06 | 4.570.95 | 0.900.03 |
| 239710 | 1.560.49 | 0.150.04 | 0.710.18 | 0.200.06 | 4.600.02 | 0.820.03 |
| 239722 | 0.880.34 | 0.320.04 | 1.280.21 | 0.220.04 | 4.590.01 | 1.040.03 |
| 239724 | 1.090.35 | 0.210.03 | 1.070.19 | 0.140.03 | 4.600.01 | 0.940.03 |
| 239725 | 1.160.42 | 0.220.03 | 0.870.16 | 0.210.04 | 4.560.01 | 0.910.03 |
| 239729 | 1.110.25 | 0.220.02 | 1.010.16 | 0.250.04 | 4.610.01 | 1.080.03 |
| 239738 | 1.000.01 | 0.240.04 | 1.170.28 | 0.200.06 | 4.550.01 | 1.030.03 |
| 239742 | 0.570.33 | 0.380.11 | 1.840.58 | 0.150.07 | 4.580.02 | 1.030.04 |
| 239745 | 1.120.28 | 0.220.04 | 1.360.31 | 0.190.05 | 4.540.004 | 0.930.02 |
| 239748 | 1.210.41 | 0.200.04 | 1.080.25 | 0.250.06 | 4.570.01 | 0.880.03 |
| +57 2395B | 1.280.41 | 0.350.05 | 1.290.24 | 0.310.06 | 4.570.01 | 0.970.03 |
| +58 2292 | 0.940.29 | 0.250.04 | 1.080.18 | 0.140.03 | 4.580.01 | 0.920.02 |
| 204827 | -1.850.54 | 0.820.15 | 0.240.09 | 0.110.04 | 4.600.00 | 1.000.00 |
| (partially dereddened) | ||||||
| SMC Bar average | -1.810.16 | 0.830.15 | 0.140.05 | 0.170.02 | 4.600.00 | 1.000.00 |
Table 4
IRAS Fluxes and Color Temperatures
| F(12m) | F(25m) | F(60m) | F(100m) | T12/25 | T25/60 | T60/100 | |
|---|---|---|---|---|---|---|---|
| (Jy) | (Jy) | (Jy) | (Jy) | (K) | (K) | (K) | |
| HD 204827 | .14 | 27.84 | 170.27 | 146.03 | 70 | 55 | 38 |
| 0.08 | 1.11 | 4.43 | 14.84 | 7 | 1 | 3 |