First INTEGRAL Observations of Eight Persistent Neutron Star Low Mass X-ray binaries††thanks: Based on observations with INTEGRAL, an ESA project with instruments and science data centre funded by ESA member states (especially the PI countries: Denmark, France, Germany, Italy, Spain, and Switzerland), Czech Republic and Poland, and with the participation of Russia and the USA
Early results from the INTEGRAL Core Program, for a sample of eight persistently bright neutron star low mass X-ray binaries in the energy range from 5 keV to 200 keV are presented. It is shown that INTEGRAL efficiently detects sources and that spectra may be obtained up to several hundreds of keV by combining data from three of the four INTEGRAL instruments: JEM-X, IBIS and SPI. For the source GX 17+2 it is shown that the spectrum extends well above 100 keV with a flattening of the spectrum above 30 keV. This might suggest a non-thermal comptonisation emission, but uncertainties in the current data reduction and background determination do not allow firm conclusions to be drawn.
Key Words.:
stars: neutron – binaries: close – X-rays: binaries –INTEGRAL sources1 Introduction
Since its launch in October 2002, the International Gamma-Ray Astrophysics Laboratory, INTEGRAL, has been providing a large amount of interesting data. The combination of the two wide field of view (FoV) instruments, the imager IBIS (15 keV – 10 MeV, partially coded FoV, Ubertini et al. 2003) and the spectrometer SPI (20 keV – 8 MeV, partially coded hexagonal FoV, Vedrenne et al. 2003) coaligned with the JEM–X (Lund et al. 2003) and OMC (Mas-Hesse et al. 2003) monitors, allows large areas of the sky to be observed and monitored in one pointing in a wide frequency range from the optical to the -ray domain. Such a capability is fully exploited during the INTEGRAL Core Program (a series of successive scans of the Galactic Plane (GPS; Winkler et al. 2003) and Galactic Centre (GCDE)) which is regularly producing large amounts of data, in particular on persistently bright sources.
The aim of this paper is to report preliminary results from early measurements on eight persistent bright Low Mass X-ray binaries (LMXRB) hosting a neutron star. The sample has been selected from a larger set observed during the Core Program Observation scans on the Galactic Plane executed so far. The sources are listed in Tab. 1. Given the type of sources involved (about hundred of mCrabs in the 2–10 keV band, Liu et al. 2001) and the pointing exposures of about 2000 s, for single pointing spectral extraction, JEM–X for soft photons (5–20 keV) and the low energy IBIS detector, ISGRI (Lebrun et al. 2003) for harder photons (20–200 keV) were chosen. PICsIT, the hard photon IBIS detector (Di Cocco et al. 2003), has its peak sensitivity above 200 keV while the LMXRB are considered to display a rather steep spectrum and consequently have fluxes below PICsIT detectability. The spectrometer SPI has been used to extract the hard energy spectra (20-200 keV) averaged on longer time scales.
The combination of JEM-X, IBIS and SPI data provides a complete soft to hard energy coverage, allowing a regular monitoring of source behaviour. Special attention is given to the hard emission ( 50 keV) monitoring for which INTEGRAL will give unprecedented continuous coverage.
Sec. 2 of this paper gives an overview of the state of the art studies on LMXRBs containing a weakly magnetized neutron star and a short description of the INTEGRAL Core Program selected sample. Sec. 3 contains details of the relevant INTEGRAL observations and data reduction methods used. Preliminary results are summarised in the last Section.
2 Bright LMXRBs in the INTEGRAL Core Program
2.1 LMXRBs with weakly magnetised neutron stars
LMXRBs hosting a weakly magnetised neutron star can be broadly classified into two classes (van der Klis, 1995): high luminosity/Z sources and Atoll sources covering a much wider range in luminosity. Z sources describe an approximate “Z”-shape (horizontal, normal, and flaring branch) in the colour-colour (CC) and X-ray hardness intensity diagrams while Atoll sources are characterised by an upwardly curved branch. Two recent studies (Muno et al. 2002 and Gierliński & Done 2002) suggest that the clear Z/Atoll distinction on the CC diagram is an artifact due to incomplete sampling: Atoll sources, if observed long enough, do exhibit a Z shape in the CC as well. Many differences, however, remain: Atoll sources have weaker magnetic fields (about to G versus 108–109 G of Z sources), are generally fainter (– versus ), can exhibit harder spectra, trace out the Z shape on longer time scales than typical Z-sources and have a different correlated timing behaviour along with the position on the Z. Thus the distinction, at least from a practical point of view, still makes sense.
Recent broad band studies, mainly with BeppoSAX, have shown that many Z sources display a variable hard power-law shaped component, dominating their spectra at keV (Di Salvo & Stella disalvo1 (2002); D’Amico et al. damico (2001); Di Salvo et al. disalvo2 (2000), and references therein). This power-law has been explained as non-thermal Comptonisation. As previously said, lower luminosity systems (Atolls) can display much harder spectra which can be well described with a simple power-law with photon indices of about 1.5–2.5. Hard X-ray components extending up to a few hundred keV have been seen in about 20 neutron star LMXRB of the Atoll class. These sources usually display an exponential cut-off between many tens and a few hundred keV. This component is interpreted as unsaturated thermal Comptonisation and is known as the “hard state” of Atoll sources.
The long term X-ray variability of those sources has been extensively studied in the 2–12 keV band with the RXTE All Sky Monitor, as well as during RXTE dedicated pointings till about 40 keV (van der Klis klis3 (2000); Swank swank (2001)). On the other side, BeppoSAX pointings have shown the presence of the hard tails mentioned above showing that Neutron Star systems, as well as Black Hole ones, are capable of producing such hard photons.
The combination of regular monitoring in the hard X-rays and -rays has not been done before and this is where INTEGRAL will give a major contribution to understanding the behaviour of bright Low Mass X-ray binaries from 5 keV up to about 200 keV.
2.2 The INTEGRAL Core Program sample
Thirtyfive per cent of INTEGRAL observing time, the Core Program, is time reserved for the institutes that developed and delivered the instruments, for the INTEGRAL Science Data Centre (ISDC; Courvoisier et al. 2003) and for the Russian scientists in return for providing the Proton rocket which put INTEGRAL in orbit.
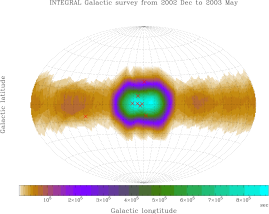
Fig. 1 shows the exposure map for a total of six months of this program. As can be seen, the centre of our Galaxy has been heavily covered, with the total observing time decreasing as we move away from it. From the overall list of about 70 persistent and transient LMXRBs, the 8 sources detected primarily by IBIS/ISGRI and then by JEM-X in at least 20 pointings, have been selected. At the time of writing OMC data on these sources is still quite sparse and, therefore, will not be included in this paper. The red crosses in Fig. 1 show the position of those sources in the Galaxy while in Table 1 the complete list is presented.
| Name | l | b | Type | ||
|---|---|---|---|---|---|
| Sco X-1 | 359.09 | 23.78 | Z | 11420 1875 | 439 4.1 |
| 1822-371 | 356.85 | -11.29 | ADC | 25 29 | 33 2.0 |
| GX 31 | 2.29 | 0.79 | AB | 390 64 | 34 1.9 |
| GX 99 | 8.51 | 9.04 | A | 265 44 | 31 2.1 |
| GX 91 | 9.08 | 1.15 | A | 495 75 | 34 3.1 |
| GX 51 | 5.08 | -1.02 | Z | 913 137 | 77 1.8 |
| GX 172 | 16.43 | 1.28 | ZB | 603 104 | 56 2.9 |
| Cyg X-2 | 87.33 | -11.32 | ZB | 440 80 | 35 6.9 |
The exposure per source depends on its position relative to the scan path and will differ from instrument to instrument due to their different FoV.
3 Data reduction and analysis
A large fraction of the Galactic Centre Deep Exposure (GCDE) has already been completed. One scan of the GPS is performed every 12 days on average.
We have analysed most of the Core Program data currently available with the standard INTEGRAL Data Analysis System (IDAS). The following 3 subsections provide the instrument specific analysis details.
3.1 SPI analysis
The analysis of the SPI data is based on GCDE observations taken from revolution 47 up to 62, i.e. between March 3rd and April 19th, 2003. 544 dithering pointings used in the analysis combine a total exposure time of 958 ksec. As the instrumental resolution of SPI is about , source confusion can affect the results. The ISGRI data have been used as a reference to check for sources which might interfere in the SPI data. GX 5-1 is separable by 40 arcmin from the black hole candidate GRS 1758-258. In this case both sources will influence the results of source extraction of each other and fluxes and spectra can only be taken as tentative. In the vicinity of GX 17+2 two sources can be detected, 4U1812-12 and AX J1820.5-1434, at and angular separation, respectively. In these cases the SPI Iterative Removal Of Sources (SPIROS) program (Skinner & Connell, 2003) is able to disentangle the sources fairly well as the closer one is rather faint, though minor effects cannot be excluded. SAX J1805.5-2031 is located away from GX 9+1.
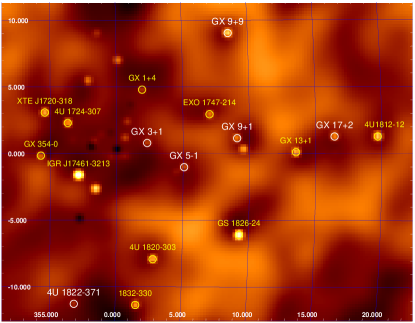
As both sources appear to have similar fluxes in the studied energy range, the spectrum of GX 9+1 derived from the SPI data might therefore be affected. In the case of GX 3+1, two faint sources, SLX 1735-269 and SAX J1747.0-2858, are at and angular separation, respectively. As both sources are weak compared to GX 3+1, significant effects on the spectral extraction of GX 3+1 are unlikely. Fig. 2 shows an image extracted from the SPI data in the 40–100 keV region. In the very dense region of the Galactic Centre, the extraction of sources seems to fail, while for more isolated sources, like e.g. GS 1826-24 and GX 13+1, the results are consistent with the ISGRI data (see Fig. 3). For spectral extraction twenty logarithmic energy bins in the 20–200 keV energy range have been applied to the data (Fig. 4). The instrumental response function used for the analysis, has been derived from on-ground-calibration and corrected after the in orbit Crab calibration observation. Source fluxes in the 20–40 keV band have been computed by comparison with results from Crab observation and are therefore given directly in Crab units (see Tab. 1). Fluxes in the 1.5–12 keV energy band have been extracted from the RXTE/ASM data base. The fluxes have been averaged over the same time period as the SPI data in order to have comparable results. In the case of 4U 1822–371 only the measurements for which the flux added to the error is larger than have been taken into account, so that only reliable data are recognized.
3.2 ISGRI
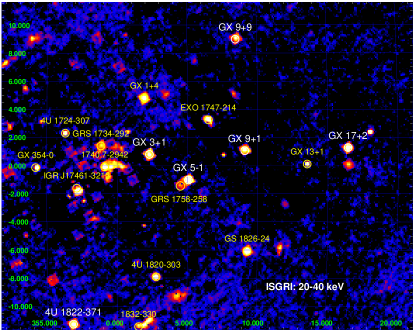
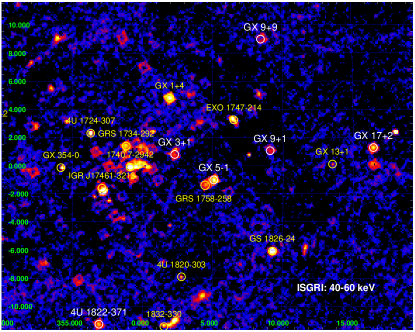
The analysis of ISGRI data is based on GCDE and GPS data from revolution 30 to 64 i.e. January 11th to April 22nd, 2003. One thousand pointings (for a total of about 2 Msec exposure111This is the total exposure time. The single source (point) exposure is much less as can be seen in Fig. 1) have been analysed separately and then combined in the mosaicked image shown in Fig. 3: a zoom in the Center of the Galaxy in the 20–40 keV and 40–60 keV bands.
Given the ISGRI sensitivity (5 detection in the 20–40 keV band for a 20 mCrab source in one pointing of 2200 sec; Rodriguez et al. 2003, possible systematic errors are not taken into consideration) and the brightness of the sources of our sample, we can extract a source spectrum using (unlike for SPI) only data from one pointing. The ISGRI spectrum for a single pointing from revolution 54 for GX 17+2 is shown in Fig. 4.
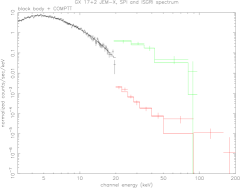
3.3 JEM-X
The set of data taken from the same position for the same exposure time used for ISGRI has also been analysed for JEM-X using the standard software. Only JEM-X2 data have been available during the observations performed so far. The statistics for a bright LMXRB like GX 17+2 is of course even better than in ISGRI (1 pointing from revolution 54 extraction) and the result is shown in Fig. 4.
Light-curves have also been extracted for each source and for each pointing and a 1 day lightcurve for GX 3+1 is shown as an example in Fig. 5 for two different energy bands (5–12 keV and 12–20 keV). For comparison the Crab pulsar shows a count rate in JEM-X of and in the 5–12 keV and 12–20 keV energy band, respectively. Gaps in the data mean that for those periods the source was out of JEM-X FoV, the narrowest of INTEGRAL high energy instruments, thus there is no detection.

4 Results
Since its launch, INTEGRAL has been producing a huge amount of interesting data. Quite naturally at this early stage of the mission, however, it is not possible to exploit them at best mainly because instrument response functions are still under development and calibrations on-going. More time is required before one can present long and fast time scale variabilities in different energy bands as well as detailed spectral behaviour of the sources. Nonetheless some main conclusions can be already drawn. First of all, the combined spectrum in Fig. 4 shows the INTEGRAL mission wide energy band allows the emission of the binary system to be displayed all the way to the hard tail. There seems to be no evidence for a cut-off below 100 keV. In this case the combined spectrum can be represented by a simple model, including a blackbody plus a comptonisation component. The statistical quality of the fit does not justify adding an additional power law component. However, the present model flux is much below the measured one in the channel centered on 100 keV. This is a possible indication of the presence of a high energy tail on top of the blackbody Comptonised by thermal electrons. Physically, this can be realized if the electrons have a hybrid distribution, with a Maxwellian and a high energy tail. This appears to be the case in a number of black hole binaries (e.g., Gierliński et al. 1999; Zdziarski et al. 2001).
Furthermore, based on one pointing only, JEM-X and ISGRI give a significant spectrum up to 100 keV for a source of . This will allow the study of the spectral time evolution on a pointing by pointing basis, i.e. monitoring the spectral slope and cut-off on an hourly basis. In this energy region the SPI sensitivity is much lower when compared to ISGRI. The spectrograph can then be used to derive high energy spectra based on longer observations. Though the spectrum is in this case an average over the different stages of the LMXRB cycle, it can reveal high energy tails, as seen in Fig. 4 up to . This capability is also seen in the high energy (40 – 100 keV) image as shown in Fig. 2.
In addition, note that the ISGRI FoV is about the size of the image in Fig. 3 so the amount of information one can obtain from one ISGRI pointing is evident. Besides, its excellent angular resolution (12’ FWHM) allows the emission from close-by sources to be separated. See for instance GX 5-1 and the 40 arcmin distant Black Hole Candidate GRS 1758-258, for which possible SPI source confusion has been pointed out.
Another result of this study is the comparison of the SPI derived fluxes to the RXTE/ASM fluxes as shown in Tab. 1. As both flux values have been extracted over a long time period of 1.5 months, they represent the mean status of the LMXRBs, i.e. averaged over all positions in the colour-colour diagram. While the Z and Atoll sources of the sample show a steep spectral slope between the 1.5–12 keV and the 20–40 keV band, the 0.59 second pulsar 4U 1822–371 (Jonker & van der Klis 4U1822 (2001)) exhibits a comparably flat spectrum with a photon index of between the RXTE and SPI data. This hard spectrum has been reported before (e.g. Parmar et al. 4U1822hard (2000)), but further investigations are necessary in order to understand the nature of this illusive source.
Finally, though the X-ray monitor JEM-X covers a smaller area than the two main instruments, Fig. 5 shows that monitoring of the X-ray flux on short (several minutes) and long (days and months) time scale is possible. This will allow to monitor outburst and the dipping behaviour of 4U 1822-371.
Acknowledgements.
We would like to thank Mike Revnivtsev for providing the mosaic tool for the ISGRI images. We also thank P. Laurent and M. Cadolle-Bel for kindly providing preliminary corrected ISGRI response matrices and the SPI colleagues for advice on how to handle SPI data. OV and DH acknowledge the Academy of Finland, TEKES, and the Finnish space research program ANTARES for financial. J.R., acknowledges financial support from the French Space Agency (CNES). A.A.Z., aknowledges KBN grants 5P03D00821, 2P03C00619p1,2, PBZ-054/P03/2001 and the Foundation for Polish Science. AP, AB, FF, AS, & GGCP acknowledge ASI and CNR for financial support.References
- (1) Courvoisier, T.J.-L., Walter, R., Beckmann, V., et al. 2003, A&A, this volume
- (2) D’Amico, F., Heindl, W. A., Rothschild, R. E., Gruber, D.E. 2001, ApJ 547, L147
- (3) Di Cocco, G., Caroli, E., Celesti, E., et al. 2003, A&A, this volume
- (4) Di Salvo, T., Stella, L., Robba, N. R., et al. 2000, ApJ 544, L119
- (5) Di Salvo, T.,& Stella, L. 2002, Proc. XXII Moriond Astroph. Meeting, p. 67, astro-ph/0207219
- (6) Gierliński, M., Zdziarski, A. A., Poutanen, J., et al. 1999, MNRAS 309, 496
- (7) Gierliński, M., & Done, C. 2002, MNRAS 331, L47
- (8) Jonker, P. G., & van der Klis, M. 2001, ApJ 553, L43
- (9) Lebrun, F., Leray, J. P., Lavocat, P., et al. 2003, A&A, this volume
- (10) Liu, Q. Z., van Paradijs, J., van den Heuvel, E. P. J. 2001, A&A 368, 1021
- (11) Lund, N., Brandt, S., Budtz-Jorgensen, C., et al. 2003, A&A, this volume
- (12) Mas-Hesse, J. M., Gimenez, A., Culbane, L., et al. 2003, A&A, this volume
- (13) Muno, M. P., Remillard, R. A., Chakrabarty, D. 2002, ApJ 568, 35
- (14) Parmar, A. N., Oosterbroek, T., Del Sordo, S., et al. 2000, A&A 356, 175
- (15) Rodriguez, J., Del Santo, M., Lebrun, F., et al. 2003, A&A, this volume
- (16) Skinner, G. K., & Connell, P. H. 2003, A&A, this volume
- (17) Swank, J. H. 2001, AIP Conf. Proc. 575, p. 261
- (18) Ubertini, P., Lebrun, F., Di Cocco, G., et al. 2003, A&A, this volume
- (19) van der Klis, M. 1995, Proc. NATO-ASI Workshop on Neutron Stars
- (20) van der Klis, M. 2000, ARA&A 38, 717
- (21) Vedrenne, G., Roques, J.-P., Schönfelder, V., et al. 2003, A&A, this volume
- (22) Zdziarski, A. A., Grove, J. E., Poutanen, J., et al. 2001, ApJ 554, L45