Chandra observations of the NGC 1550 galaxy group — implication for the temperature and entropy profiles of 1 keV galaxy groups
Abstract
We present a detailed Chandra study of the galaxy group NGC 1550. For its temperature (1.370.01 keV) and velocity dispersion ( 300 km s-1), the NGC 1550 group is one of the most luminous known galaxy groups (Lbol = 1.651043 erg s-1 within 200 kpc, or 0.2 ). We find that within kpc, where the gas cooling time is less than a Hubble time, the gas temperature decreases continuously toward the center, implying the existence of a cooling core. The temperature also declines beyond 100 kpc (or 0.1 ). There is a remarkable similarity of the temperature profile of NGC 1550 with those of two other 1 keV groups with accurate temperature determination. The temperature begins to decline at 0.07 - 0.1 , while in hot clusters the decline begins at or beyond 0.2 . Thus, there are at least some 1 keV groups that have significantly different temperature profiles from those of hot clusters, which may reflect the role of non-gravitational processes in ICM/IGM evolution. NGC 1550 has no isentropic core in its entropy profile, in contrast to the predictions of ‘entropy-floor’ simulations. We compare the scaled entropy profiles of three 1 keV groups (including NGC 1550) and three 2 - 3 keV groups. The scaled entropy profiles of 1 keV groups show much larger scatter than those of hotter systems, which implies varied pre-heating levels. We also discuss the mass content of the NGC 1550 group and the abundance profile of heavy elements.
1 Introduction
In the simplest structure formation model, the thermodynamic properties of the intracluster medium (ICM) are simply governed by shock heating in gravitational infall. Thus, self-similar relations, between mass, temperature and luminosity, can be expected for different halos. However, X-ray observations show the observed Lx - T relation of clusters, which is approximately Lx T2.6 (e.g., Markevitch 1998), is not consistent with the predictions of the self-similar model (Lx T2). The Lx - T relation for galaxy groups may be even steeper than that of clusters (e.g., Helsdon & Ponman 2000, HP00 hereafter). Ponman, Cannon & Navarro (1999) and Lloyd-Davies, Ponman & Cannon (2000) found that the central entropy of galaxy groups is higher than predicted by self-similar scaling. These deviations from the self-similar model imply departures from scale-free relations in actual ICM evolution.
The general consensus is that some non-gravitational processes must be included in ICM evolution. Three ideas are currently discussed in the literature: pre-heating (or star-formation feedback), radiative cooling, and galaxy formation efficiency. For detailed descriptions of the current understanding of these processes in galaxy clusters and groups, see Tozzi & Norman (2001, TN01 hereafter), Babul et al. (2002) and Ponman et al. (2003). Galaxy groups are ideal targets to study non-gravitational effects since the implied non-gravitational energy is comparable to the gravitational energy in these cool systems. However, pre-Chandra measurements generally have large uncertainties (e.g., Ponman et al. 1999; Lloyd-Davies et al. 2000; Finoguenov et al. 2002). The launch of Chandra and XMM-Newton provide much stronger tools to achieve precise measurement of temperature, abundance and density profiles with which mass and entropy profiles can be derived and Lx - T, M - T and S - T relations can be better constrained. These well-established relations, in combination with simulations, can reveal the roles of non-gravitational processes in ICM evolution. Among observational properties of galaxy groups, the temperature profile is the most important but is still poorly constrained. It not only is crucial to derive the mass and entropy profiles, but also reflects the roles of non-gravitational processes and serves as an important test of simulations (e.g., Muanwong et al. 2002; Dav et al. 2002).
We present in this Paper a detailed analysis of the NGC 1550 group, reported as a group by Garcia (1993). NGC 1550 was selected as a candidate “Over Luminous Elliptical Galaxy” (OLEG, Vikhlinin et al. 1999) from a sample of early-type galaxies based on the ROSAT All-Sky Survey (Beuing et al. 1999). NGC 1550 (or NGC 1551, UGC 3012) is a lenticular galaxy at z=0.0124. It was detected as a bright X-ray source in the ROSAT All-Sky Survey. The follow-up ROSAT HRI observation revealed a very extended halo ( 15′ in radius), implying the existence of a galaxy group/cluster. However, NGC 1550 dominates the optical light. There was no previous information on the temperature of the system. NGC 1550 is a weak radio source (16.61.6 mJy at 20 cm) with a lobe-like extension to the west revealed by the NRAO VLA Sky Survey (NVSS). Thus, the nuclear radio output may not be important for the group thermodynamics at the current stage. We will only discuss the global properties of the NGC 1550 group in this paper, with emphasis on the temperature profile and the comparison with other groups/clusters and simulations. The central region will be discussed in detail in a subsequent paper.
The plan of this paper is as follows: in 2 we describe the Chandra observations and data analysis, including the global and radial properties of the NGC 1550 group. In 3 we describe its optical properties. 4 discusses the mass profiles. 5 is the discussion and 6 is the conclusion. Throughout this paper we assume H0 = 70 km s-1 Mpc-1, M=0.3, and =0.7. At a redshift z=0.01239, the luminosity distance to NGC 1550 is dL = 53.7 Mpc, and 1′′=0.254 kpc. All physical scales, luminosities, densities, entropies, gas masses, stellar masses, and total masses scale as d, d2, d-1/2, d1/3, d5/2, d2, and d, respectively, where d=dL/53.7 Mpc.
2 Chandra data analysis
NGC 1550 was observed on January 8, 2002 by Chandra with the Advanced CCD Imaging Spectrometer (ACIS). The observations were divided into two ACIS-I pointings (Obs 3186 and 3187), with exposure times of 10.1 ks and 9.8 ks, respectively. NGC 1550 was placed near the center of the I3 and I1 chips (Obs 3186 and 3187). In each pointing, the aimpoint was moved along the detector Y axis to be closer to the target. This provides 1′′ resolution at the center of NGC 1550 and good coverage of the group emission out to 200 kpc. The data were telemetered in Very Faint mode, which can significantly reduce the soft particle background. ASCA grades 1, 5 and 7 were excluded. We applied the CXC correction on charge transfer inefficiency (CTI). The slow gain changes in ACIS CCDs I0-I3 were also corrected using the program ‘corr_tgain’ by A. Vikhlinin 111http://cxc.harvard.edu/contrib/alexey/tgain/tgain.html. Known bad columns, hot pixels, and CCD node boundaries also were excluded. We investigated the background light curves from chip S2. No background flares were found in either observation.
2.1 Background subtraction & spectral fitting
Background subtraction is critical for the analysis of extended sources. In our analysis we used period D blank field background data (CTI corrected by M. Markevitch222http://cxc.harvard.edu/contrib/maxim/bg/index.html). The particle background level was measured in PHA channels 2500-3000 ADU for all CCDs. We found that the particle background levels were 4.8% and 5.6% higher for Obs 3186 and 3187 respectively than that of the period D background data. This is within the uncertainties of the background files. Thus, we increased the background normalization by 5.6% and 4.8% to fit the particle background level at the time of the NGC 1550 observation (see Markevitch et al. 2003). We also verified that the ROSAT soft sky background flux at the position of NGC 1550 matches quite well with the average value of soft sky background in the Chandra background fields (within 1%). A 10% uncertainty of background is included in the spectral fitting.
CALCARF and CALCRMF were used to generate response files. The spatial non-uniformity of the CCD quantum efficiency (QE) was included in ancillary response files (ARFs). Two corrections were further made to the ACIS low energy quantum efficiency (QE). The first corrects for the QE degradation, which increases with time and is uniform in the detector plane. The second corrects the QE by an empirical factor of 0.93 below 1.8 keV in the FI CCDs to improve the cross-calibration with the BI CCDs333http://asc.harvard.edu/cal/Links/Acis/acis/Cal_prods/qe/12_01_00/ (see Markevitch & Vikhlinin 2001 for details). Throughout the paper, we use the Galactic absorption of 1.141021 cm-2. With this absorption value, the soft band spectra (0.6 - 1.0 keV) can be well fit. To fit the NGC 1550 spectra in large regions, we generally used the 0.7 - 6 keV energy band. In some regions, there is hard X-ray excess in the spectrum of Obs 3186 but it only has a very small effect on the spectral fitting. The calibration files used correspond to CALDB 2.21 from the CXC. The uncertainties quoted in this paper are 90% confidence intervals unless specified. The solar photospheric abundances of Anders & Grevesse (1989) are used in the spectral fits.
2.2 X-ray morphology and surface brightness
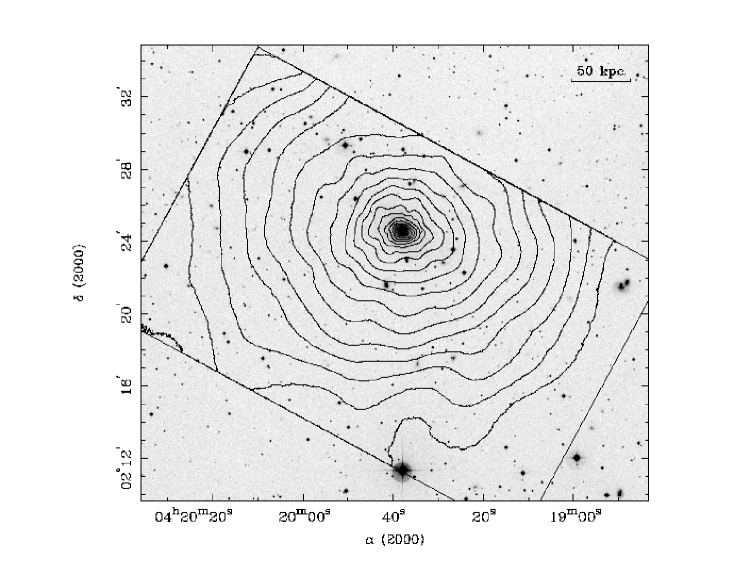
The two Chandra pointings of NGC 1550 were combined and the 0.5 - 3 keV image (background-subtracted and exposure-corrected) was produced. The X-ray contours of the image superposed on the DSS II image are shown in Fig. 1. All point sources are replaced by surrounding averages. The image reveals some asymmetry in the center, but is more relaxed than several other bright 1 keV groups, e.g., NGC 5044 (Buote et al. 2003a) and NGC 507 (Kraft et al. 2003). The diffuse X-ray emission can be traced to the edge of the Chandra field. The X-ray surface brightness profile of NGC 1550 is shown in Fig. 2. Beyond the central 40 kpc, the surface brightness is approximately characterized by a power-law with a slope corresponding to =0.46. If the surface brightness profile is fit by a single -model, the central excess is quite significant and the fit cannot well describe the measured profile at radii larger than 100 kpc (Fig. 2). Even a double -model cannot reproduce the excess in the central 1 kpc, but the fit to radii larger than 1 kpc is much better than the single -model fit. The more diffuse component has a core radius of 26 kpc and = 0.48, which is consistent with the results based on ROSAT observations (HP00) and simulations by Muanwong et al. (2002), but smaller than the medians of simulations by Dav, Katz & Weinberg (2002) ( 0.66) and TN01 ( 0.9). However, the limited fitting range in the Chandra observations and the degeneracy between the core radius and bias to small values. Based on the ROSAT All-Sky Survey data, we find the surface brightness steepens beyond 200 kpc. The surface brightness can be characterized by a power-law with a slope corresponding to =0.70 between 200 kpc and 450 kpc.
We also performed 2-D fits to the Chandra image of the NGC 1550 group using Sherpa. The results agree with those of the 1-D fits. No significant offset component was found. From small scales (e.g., 10 kpc) to large scales (e.g., 200 kpc), the X-ray emission is somewhat elongated in the E-W direction with ellipticities ranging from 0.1 to 0.2.
2.3 Average temperature and abundances
The integrated 0.72 - 6 keV spectra of Obs 3186 and 3187 within 200 kpc were fit by a MEKAL model. Two pointings yield same results: T=1.37 keV and abundance = 0.260.02 for Obs 3186, and T=1.38 keV and abundance = 0.270.02 for Obs 3187. Simultaneous fits yield: T=1.38 keV and abundance = 0.27 (=279.0/236). The Fe-L blend and S He- lines can be clearly seen in the integrated spectra (see Fig. 3). To determine the abundance of individual elements, we also fit the spectrum with a VMEKAL model. Following Finoguenov, Arnaud & David (2001), we divide heavy elements into five groups for fitting: Ne; Mg; Si; S and Ar; Ca, Fe, and Ni. The best-fit values are: T=1.370.01 keV, Ne0.11, Mg=0.08, Si=0.28, S=0.41, and Fe=0.330.02 (=247.0/232). The integrated spectra, as well as the best VMEKAL fits, are plotted in Fig. 3.
We use the empirical relation derived in Evrard, Metzler & Navarro (1996, EMN96 hereafter) to estimate the virial radius:
| (1) |
This scaling relation may not apply for cool groups (e.g., Sanderson et al. 2003), but can be used for comparison with other groups. Thus, for NGC 1550, = 1.01 Mpc.
2.4 Radial temperature & abundance profiles
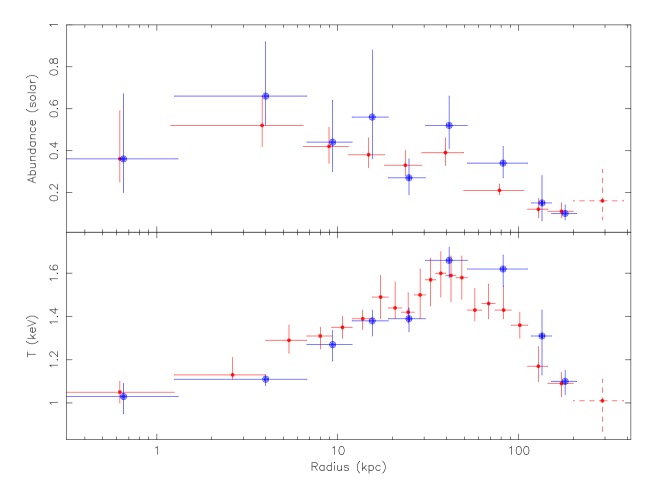
Although in X-rays, the NGC 1550 group is not perfectly azimuthally symmetric, it is useful to derive radially averaged profiles of some physical properties to compare with other groups and simulations. We took the center for all annuli at R.A. = 04h19m37s.9, decl. = 02 24 35, which is the peak of the X-ray distribution and coincides with the optical galaxy center. We required each annulus to contain 1500 - 2000 source counts from the two pointings. Point sources are excluded. In the outermost bin (radius 9.5′ - 13.1′), the group emission still contributes 60% of the total counts in the 0.7 - 4 keV energy band. Each annulus was fit by a MEKAL model, with the temperature and abundance as free parameters. The spectral fits from the two pointings separately agree with each other very well in all annuli. Thus, we made simultaneous fits to the two pointings. values range from 0.7 to 1.17 (for 23 - 156 degrees of freedom). The derived temperature and abundance profiles are shown in Fig. 4. The temperature increases from keV at the center to keV at - 100 kpc, then decreases to 1.0 keV at 200 kpc. The heavy element abundance decreases from 0.5 solar at the center to 0.1 solar at 200 kpc. The average abundance of 0.27 is typical for galaxy groups (Mulchaey & Zabludoff 1998).
We also extracted the spectra of regions outside 200 kpc or 13.1′ (mostly from the S2 chip in Obs 3187). The Chandra observations only cover 8% of the projected area between radii of 200 - 380 kpc. The best-fit temperature and abundance are 1.01 keV and 0.16 respectively. This implies that the temperature is either flat or still decreasing beyond 200 kpc (Fig. 4).
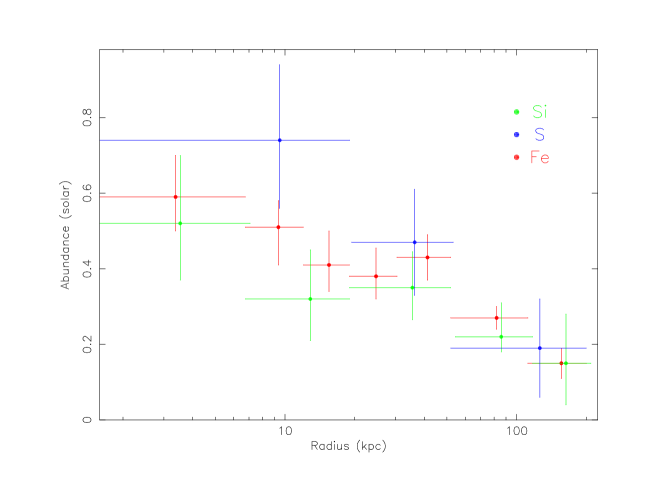
In view of the strong line emission in the spectra of the NGC 1550 group, we can constrain the radial abundance distribution of Si, S and Fe. The radial profiles of Si, S and Fe abundances, shown in Fig. 5, are obtained from an absorbed VMEKAL model fit. Abundances of Si, S and Fe decrease with radius. Si/Fe is close to 1 in all bins. The abundances of Ne and Mg are poorly constrained and are not shown.
2.5 Total X-ray luminosity
We estimate the total X-ray luminosity of the NGC 1550 group from the spectral fits of the integrated spectra within 200 kpc. The missing parts of the group (due to chip edges, chip gaps and point sources) are included based on the measured surface brightness profile (double -model fit). Both pointings yield results within 1.5 % and we average them to obtain, the rest-frame 0.5 - 2 keV luminosity of 7.661042 erg s-1 and bolometric luminosity of 1.651043 erg s-1 within 200 kpc (or 0.20 ). If we extrapolate the surface brightness to (or 650 kpc) and (or 1.01 Mpc) based on the ROSAT All-Sky Survey data, the bolometric luminosities are 2.0 and 2.31043 erg s-1 respectively. For its temperature (1.37 keV) and velocity dispersion ( 300 km s-1), the NGC 1550 group is among the X-ray brightest galaxy groups in the sky (HP00; Mulchaey et al. 2003).
2.6 Deprojection analysis
Assuming spherical symmetry, we performed a spectral deprojection analysis to obtain the 3D temperature and abundance profiles. Nine radial bins were chosen to do the spectral deprojection. We used the standard ‘onion peeling’ technique (e.g., Sun et al. 2003). The projected emission measure from the outer annuli on the inner annuli is estimated. The missing emission volume in each annulus because of the chip edges, gaps and point sources is derived by Monte Carlo simulations and included in the computation. The deprojected temperatures and abundances are shown in Fig. 4.
The electron density profile can be obtained by deprojecting the surface brightness profile. This technique, starting in the largest annulus, converts the observed surface brightness to electron density and then determines the density at progressively smaller radii, after removing the projected emission from larger radii. The projected flux contribution from regions beyond the outermost bin is also subtracted based on the ROSAT All-Sky Survey data. A 0.5 - 3 keV background-subtracted and exposure-corrected surface brightness profile of NGC 1550 is derived in 28 radial bins. With the knowledge of the group emissivity in these bins, we can derive electron densities. In the temperature range appropriate to the NGC 1550 group ( 1 keV), the X-ray emissivity is sensitive to the heavy element abundance and temperature. Thus, we need to model both the temperature and abundance profiles. The deprojected temperature and abundance profiles can be well fit by fifth-order polynomials. Repeated fitting 1000 times, we obtain the temperature and abundance values in each radial bin, as well as uncertainties. With these values, we can derive the 0.5 - 3 keV emissivity profile in the 28 bins from 1000 XSPEC simulations, as well as the corresponding uncertainties. We can then use the standard ‘onion peeling’ technique to convert the surface brightness to electron density, where the conversion factor in each bin is determined by the X-ray emissivity in this bin. The uncertainties of the electron densities were obtained from the 1000 Monte Carlo simulations.
The derived electron density profile is shown in Fig. 6. It can be fit well by a -model if the innermost bin is excluded ( = 28.2/24). The small core radius (r0=2.49 kpc) and (0.3640.008) imply that n r-1.09±0.02 between 10 kpc and 200 kpc. This density profile is much flatter than those measured in clusters, generally n r-2 beyond several core radii. With the deprojected temperature and electron density profiles, we also derived the cooling time and entropy profiles (defined as ) (Fig. 7). The cooling time is less than 108 yr in the very center and less than a Hubble time ( 1010 yr) within the central 60 kpc. Thus, the decrease of temperature towards the center within the central 40 kpc can be explained by radiative cooling.
3 Optical properties of the NGC 1550 group
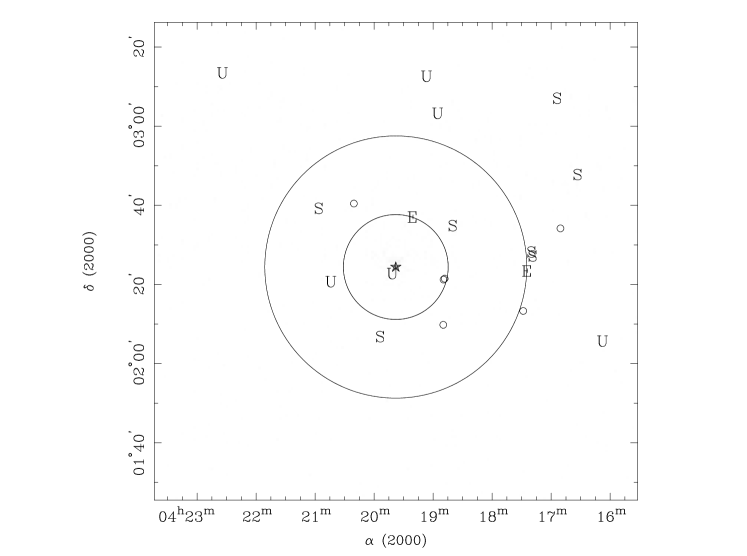
NGC 1550 was shown to be a dominant galaxy of a group by Garcia (1993) and Giuricin et al. (2000), but the listed information is very limited. we studied the galaxy distribution using data extracted from NASA/IPAC Extragalactic Database (NED) within 1 Mpc (the virial radius) of NGC 1550. The velocity information is complete to B 15.5 mag. There are 15 galaxies that have similar redshifts to NGC 1550. We plot the distribution of these galaxies in Fig. 8. These galaxies accumulate in a loose way that there is no concentration at the core (e.g., 0.2 ). Using robust estimators of location and scale (Beers, Flynn & Gebhardt 1990), we obtain a mean velocity of 3694 km s-1 and a velocity dispersion of 31151 km s-1. The mean velocity is essentially same as the velocity of NGC 1550 (371423 km s-1), which may imply the small peculiar velocity of NGC 1550. The velocity dispersion of NGC 1550 implies it has a low (m/kT) of 0.48, which is very similar to the other two well-studied 1 keV groups NGC 2563 ( = 0.52) and NGC 4325 ( = 0.42) (Mushotzky et al. 2003, M03 hereafter). This value is also consistent with the simulation results in Dav et al. (2002). The of NGC 1550 is also similar to its within 200 kpc (0.41 - 0.48 depends on single or double -model fits).
Within 0.5 (or 33.1′) of NGC 1550, there are five bright group members other than NGC 1550 (3 UGC galaxies and 2 CGCG galaxies). At least three of them are brighter than RcD+2, where RcD is the R magnitude of the cD. Thus, the NGC 1550 group is not a “fossil group”.
The optical properties of the cD galaxy — NGC 1550 are important for us to understand the group properties. We have used the Danish 1.54m telescope at La Silla, Chile, to obtain a (mosaic) B-band image (600 sec) and an R-band image (450 sec) of NGC 1550. Standard optical data reduction is followed. The optical light profile within 60 kpc can be well fit by a de Vaucouleurs r1/4 profile with a half light radius of 9.1 kpc. There is 20% excess beyond 35 kpc. The measured R-band magnitude of NGC 1550 within 60 kpc is 10.97 mag after Galactic extinction correction and K correction, which corresponds an R-band luminosity of 6.04 1010 L⊙. The galaxy is slightly elongated in the NE-SW direction and the ellipticity is small (0.10 - 0.17). There is a dwarf galaxy concentration within 5′ of NGC 1550. NGC 1550 has a normal absorption line late-type galaxy spectrum (from the CfA database).
4 Mass profile & M-T relation
4.1 X-ray Gas Mass and Total Gravitating Mass
The gas density and temperature profiles can be used to derive the total gravitational mass profile under the assumption of hydrostatic equilibrium:
| (2) |
To overcome the difficulty of deriving the logarithmic derivative of the gas temperature profile, we fit the observed temperature data to a fifth order polynomial since the temperature profile was not well fit by any simple function. To constrain the temperature gradient at kpc, we included the measured temperature value between 200 and 380 kpc from the small region in that annulus (see 2.5) and increased its uncertainty by a factor of two. The fit is very good ( = 8.7/5). To derive the temperature and temperature gradients at the grid points corresponding to the more accurately measured gas density, we performed Monte Carlo simulations. In each run, the temperatures are scattered with the measured uncertainties around the measured values. Each simulated temperature profile is then fit by a fifth-order polynomial. Repeating this procedure 1000 times, we obtain the temperature and temperature gradient in each radial bin, as well as uncertainties. The electron density profile is well fit by a -model except for the central point (Fig. 6) and a similar method is applied to derive the density gradient and its uncertainties. Thus, through a series of Monte Carlo simulations, we derive the total mass profile (eq. 2) outside the central 2 kpc. The gas mass profile can be derived from the deprojected density and abundance profiles.
Both the total mass and gas mass profiles are shown in Fig. 9, along with the gas mass fraction profile. To explore the gas fraction at even larger radii, we estimate the total mass and the gas mass to about kpc based on the S2 chip temperature and the surface brightness measured from the ROSAT All-Sky Survey data. The estimates are also plotted in in Fig. 9. The gas mass fraction increases rapidly with radius to at 200 kpc. Beyond 200 kpc, uncertainties remain large and require additional data to define its behaviour.
4.2 Stellar Contribution to the Baryon Fraction and the Mass-to-Light Ratio
Since much of the baryon matter in the core of the NGC 1550 group arises from stellar matter in galaxies, we have estimated the stellar light profile to 300 kpc. Most of stellar light within 200 kpc is contributed by NGC 1550, while the contributions from other member galaxies become almost comparable to that of NGC 1550 at 300 kpc. Since the light profile of NGC 1550 can be well fit by a de Vaucouleurs profile, we use the deprojection table (Young 1976) assuming an R-band mass-to-light ratio of (Kauffman et al. 2003). With these assumptions, we find a total stellar mass of NGC 1550 within 60 kpc of . We also can estimate the total stellar mass of NGC 1550 from its K-band luminosity by assuming a K-band mass-to-light ratio of (Cole et al. 2001). This yields a total stellar mass of , consistent with our R-band estimate under the uncertainties of both mass-to-light ratios. We also include the optical light from other group member galaxies and half that of dwarf galaxies (in projection without measured velocities) in the light profile at their projected radii. Since we do not have R-band CCD data for galaxies beyond the central 190 kpc, we derive their stellar mass contributions from their K-band magnitudes measured from the Two Micron All Sky Survey (2MASS). We increase these measured values by 20% to derive the total galaxy light (Kochanek et al. 2001) along with an assumed K-band mass-to-light ratio of 1.
The derived stellar mass profile, as well as the baryon fraction profile, are shown in Fig. 9. As expected, baryonic matter dominates in the core of NGC 1550. The baryon fraction reaches at 190 kpc. The R-band mass-to-light ratio of the group increases with radius and reaches at 190 kpc. A similar value of M/L is found in the V band. This value is similar to those found at 0.2 of clusters and groups (e.g., David et al. 1995; Pratt & Arnaud 2003). Beyond 190 kpc, there are some bright member galaxies (7 UGC galalxies + others) and M/L is not expected to change much beyond 0.2 (e.g., Pratt & Arnaud 2003). Thus, The NGC 1550 group is not an OLEG.
4.3 Comparison of the Total Mass Distribution to Models and the Relation
Using the derived total mass distribution, we can test numerical models of the growth of dark matter halos (e.g., Navarro, Frenk, & White 1997; Moore et al. 1998). However, the two parameters in these profiles, (central overdensity) and (characteristic radius), are highly degenerate in fitting the accumulating mass profile. This, in combination with the limited range of the measured mass profile, makes it impossible to derive a global dark matter model for the NGC 1550 group. Nevertheless, we fit the total mass profile within 200 kpc to obtain an estimate of the concentration parameter. For an NFW profile, we obtain best-fit parameters of and kpc ( = 38.7/25). The Moore profile better describes the mass profile of NGC 1550 ( = 13.5/25), especially within the central 10 kpc with = 8.5 (3.7 - 17.5) 103 and rs = 105 (70 - 170) kpc (note the large degeneracy between the two fitted parameters). The corresponding concentration is 6.2, which implies a halo mass of 1013 M⊙. It would be most interesting to compare the theoretical models to more accurate mass profile extending over a larger range of radii to critically test their similarities and differences in low mass systems.
Allen, Schmidt & Fabian (2001) derived an relation for hot clusters within . If cool groups also follow this relation, we expect for NGC 1550. Since, for NGC 1550, is slightly beyond 200 kpc, we extrapolated the mass profile to . The Moore profile fit predicts = 208 - 237 kpc and = 1.5 - 1.8 M⊙, which is smaller than the value expected from the relations of hot clusters.
5 Discussion
5.1 The temperature profiles of 1 keV galaxy groups
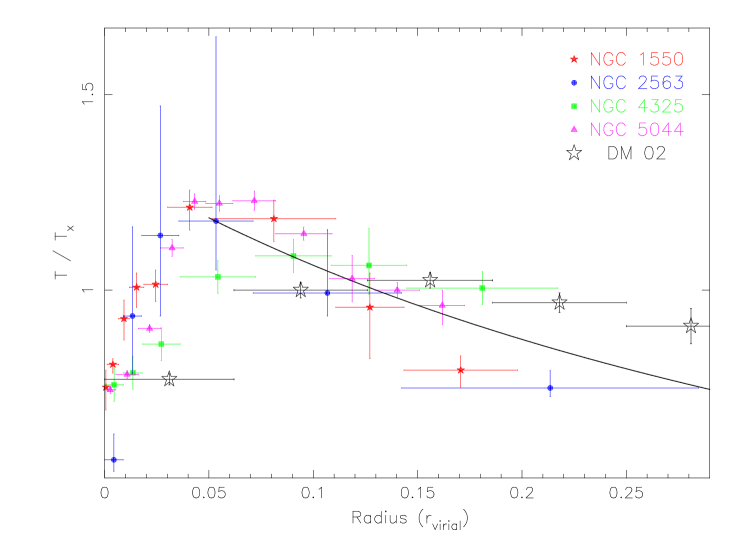
NGC 1550 exhibits a unique temperature profile and shows similarities to other cool groups with accurate measured profiles. In Fig. 10, we show deprojected temperature profiles of the four groups NGC 1550, NGC 2563, NGC 4325 and NGC 5044 with accurate temperature profiles measured with Chandra and XMM-Newton (M03; Buote et al. 2003a, see David et al. 1994 for the outer profile of NGC 5044 measured with ROSAT). To compare different groups, we rescaled the radii by the virial radius for each group (computed from eq. 1) and rescaled the temperatures by the mean group temperature. Remarkably, the temperature profiles of NGC 1550, NGC 2563 and NGC 5044 are very similar with a temperature peak or plateau between =0.04 and 0.08, and temperature declines, with similar slopes, beyond . NGC 4325 seems to have a rather flatter temperature profile, but still shows a decline beyond .
The ROSAT and ASCA temperature profiles of keV groups, although with much poorer statistical precision show similar average features. The four keV groups studied by HP00 with the best measured temperature profiles, NGC 741, NGC 4065, NGC 4761, and NGC 5846, all show similar temperature declines beyond . Similar temperature profile of NGC 4761 (or HCG 62) was also found by Mulchaey & Zabludoff (1998) and Buote (2000). Similarly, nine galaxy groups observed with ASCA also generally show temperature declines at large radii (from 0.1 - 0.2 ) (see Finoguenov et al. 2002). However, all these temperature profiles have large uncertainties and insufficient angular resolution to directly compare with the precisely measured Chandra and XMM-Newton profiles shown in Fig. 10.
In summary, the current knowledge of 1 keV galaxy groups suggests that at least some of them have a rather common temperature profile with temperatures declining beyond , and the temperature at 0.2 is % of the temperature at 0.05 . However, there also seem to exist a class of 1 keV galaxy groups with very flat temperature profiles including NGC 2300 (Davis et al. 1996) and NGC 4325 (M03). This may reflect different roles of non-gravitational processes (including cD heating) or different formation histories in different groups. More high-quality temperature profiles from Chandra and XMM-Newton are needed to fully understand the origin of temperature structure of cool groups.
5.2 Comparison to temperature profiles of hot clusters
Hot galaxy clusters show some of the same temperature profile characteristics as seen for NGC 1550, but with an important difference. Based on the analysis of ASCA data, Markevitch et al. (1998; M98 hereafter) argued that hot clusters exhibit a universal temperature profile, with the temperature at 0.5 declining to only % of the temperature at 0.1 . De Grandi & Molendi (2002; DM02 hereafter) using BeppoSAX data found good agreement with M98 beyond 0.2 and a flat profile from the cooling radius to 0.2 . Despite the agreement between DM02 and M98, the behavior of cluster temperature profiles beyond 0.2 remains controversial with cluster showing flat profiles to 0.4 - 0.7 (e.g., A2390, A1795, A1835 and A2163) (Allen, Ettori & Fabian 2001; Arnaud et al. 2001; Pratt, Arnaud & Aghanim 2001; Majerowicz, Neumann & Reiprich 2002). However, some clusters do show temperature declines at large radii (e.g., A1413, Pratt & Arnaud 2002). In summary, recent observations support flat temperature profiles of hot clusters beyond the cooling radius to at least 0.2 , while the behaviour beyond 0.2 is not definitively determined.
Despite the uncertainty in cluster temperature profiles are large radii, their behavior at moderate radii contrasts strongly with that of the 1 keV galaxy groups shown in Fig. 10, in which significant temperature declines are found between 0.1 and 0.2 . To quantitatively compare clusters and groups, we fit the temperature profiles of 1 keV groups at large radii (beyond 0.07 ) with a polytropic model () to measure the slope of the temperature decline. Combining all four profiles from Fig. 10, the best-fit is ( = 29.7/11). If we omit the rather flat temperature profile of NGC 4325, the results change little: ( = 18.1/8). While the polytropic index we find for groups is remarkably similar to that found by DM02 for cooling-flow clusters, the temperature declines in groups occur at much smaller radii – 0.07 -0.25 for groups compared to 0.2-0.6 as found by DM02 for hot clusters. If we approximate the gas density profile in this range as with or 2, expected if the gas density profiles follow a -model with or 2/3 and the pressure is given by , where , then we find = 1.26 - 1.19 (with an uncertainty of 0.02. Thus, lies between the isothermal index of 1 and the adiabatic index of 5/3, in agreement with the value found by M98, = 1.24 for hot clusters, but, again, at larger radii.
The observed difference in the radius at which groups and clusters show the radial temperature decline can be alleviated if the virial radius of cool groups is smaller than that derived from the empirical relation of EMN96 (see eq. 1). The Birmingham-CfA cluster scaling project reveals that the measured virial radii of clusters and groups are smaller than those expected from self-similar scaling relations, especially for cool groups (Sanderson et al. 2003). For groups like NGC 1550, their result shows that the true virial radius may be as small as 60% of the value derived using the empirical relation by EMN96. In fact, if we applies the best-fit Moore profile in 4.3, the derived virial radius of the NGC 1550 group is 650 kpc — 65% of the value derived using the simple scale relation. Nevertheless, this cannot completely explain the observed difference.
5.3 Comparison with temperature profiles from simulations
The temperature profiles of these 1 keV groups at radii larger than 0.05 can be compared to simulations. Most simulations are for hot clusters, while the ones dedicated to cool groups are rather scarce. The observed 1 keV group temperature profiles (see Fig. 10) agree with the “Universal temperature profile” of galaxy clusters from adiabatic simulations (Loken et al. 2003). However, these simulations are aimed at hot and massive clusters where the non-gravitational processes are not expected to be significant. “Entropy floor” simulations (TN01; Borgani et al. 2002; Babul et al. 2002) can reproduce the observed temperature profiles, but no entropy floor is found in the NGC 1550 group (Fig. 7). Muanwong et al. (2002) produced adiabatic, radiative and pre-heating simulations of galaxy groups. Their predicted temperature profiles are too flat between 0.06 and 0.2 , inconsistent with the majority of observations. Dav et al. (2002) include cooling and star formation, but no substantial non-gravitational heating in their simulations of galaxy groups. The resulting temperature profile is consistent with the observations. Temperature and entropy profiles to 0.5 will be able to put tighter constraint on simulations in the future.
The inner ( 0.05 ) temperature profiles of 1 keV groups (Fig. 10) are also similar. None of simulations describe the temperature profiles in this region well. This may require high resolution simulations that carefully handle the radiative cooling and a better understanding of the cooling flow physics.
5.4 The role of cD heating
Since the temperature peak or plateau of these 1 keV groups lies at relatively small radii (within 30 - 110 kpc), feedback from the cD galaxy should not be ignored. The high temperature plateau at 30 - 110 kpc in the NGC 1550 group may be caused by heating from the central galaxy. If we assume an energy input of 0.2 keV / particle from NGC 1550, over the lifetime of the group an energy input of at least 1059 ergs is needed. This is 2 orders of magnitude higher than the current radio output of NGC 1550 integrated over 10 Gyr. However, NGC 1550 may have episodic activity related to the cooling flow (Sun et al. 2003 and references therein). Galactic winds also can heat the ICM/IGM significantly. Based on the simulations by David, Forman & Jones (1991), the galactic wind of NGC 1550 can provide up to an order of magnitude more energy than required. Thus, NGC 1550 may play an important role in shaping the inner temperature profile either during its radio active periods or by its galactic wind. Thus, the temperature “bump” seen in other groups also can be produced by the heating of the cD galaxies.
5.5 The entropy profiles of 1 keV groups
One scenario to explain the entropy excess in the center of galaxy groups is that low-entropy gas in the central region cools, condenses into dense and cold objects, and the high-entropy gas flows in to fill the volume. Voit & Bryan (2001) argued that only gas with entropy larger than 100 - 150 keV cm2 has a long enough cooling time to survive in cluster/group cores. However, we do not observe a flat entropy profile in the center of NGC 1550, which questions the validity of simulations that invoke an entropy-floor, e.g., TN01, Babul et al. (2002). This is consistent with the recent systematic study by Ponman, Sanderson & Finoguenov (2003).
The temperature decline from 0.08 makes the entropy profile flatten at large radii, between 20 kpc and 80 kpc, while between 80 kpc and 200 kpc (Fig. 7). A similar phenomenon was found by Finoguenov et al. (2002) in several other galaxy groups. If we adopt the S2 chip temperature at 300 kpc and the steepening density profile from the ROSAT All-Sky Survey data, the entropy profile steepens again beyond 200 kpc. However, better measurements beyond 0.2 are needed to constrain the entropy profile at large radii.
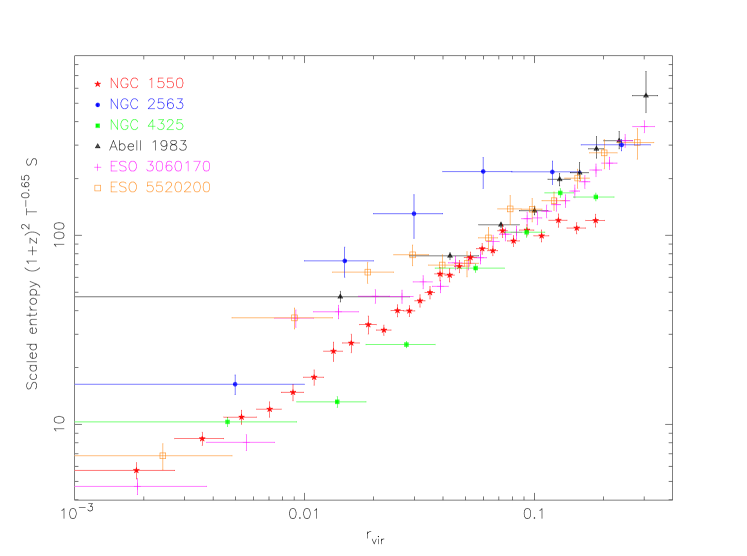
At 0.1 (101 kpc), the entropy is 120 keV cm2, which is consistent with the value of the entropy floor proposed by Ponman et al. (1999) and Lloyd-Davies et al. (2000). However, M03 derived different entropy values at 0.1 for two other 1 keV galaxy groups, NGC 4325 ( 100 keV cm2) and NGC 2563 ( 300 keV cm2). Furthermore, Ponman et al. (2003) studied a sample of 66 virialised systems. Their results prefer a slope in S(T) which is significantly shallower than the self-similar relation S T rather than a fixed entropy floor at the core. They suggest that entropy scales as S T∼0.65. Pratt & Arnaud (2003) find that the entropy profiles of the 2 keV cluster A1983 and the 7 keV cluster A1413 follow that relation. We plot the scaled entropy profiles ((1+z)) of three 1 keV groups and three 2 - 3 keV groups in Fig. 11. The entropy profiles of the NGC 2563 and the NGC 4325 groups are from M03. The entropy profile of Abell 1983 (T=2.1 keV) is from Pratt & Arnaud (2003). The entropy profiles of the ESO 3060170 group (T=2.70 keV) and the ESO 5520200 group (T=2.10 keV) are from our work (Sun et al. in prep.). The scaled entropy profiles of 2 - 3 keV groups align with each other better than those of 1 keV groups. The scaled entropy profiles of these 1 keV groups flatten between 0.1 and 0.2 , but with different values spanning almost a factor of three. All these imply that the entropy profiles of 1 keV groups show larger scattering than those of hotter groups, which reinforces the idea that there is no fixed entropy floor for 1 keV groups. This reflects larger roles of non-gravitational processes in 1 keV groups than hotter systems and implies varied pre-heating levels.
5.6 Lx - T & Lx - relations
Despite the known large scatter in the Lx - T relation, NGC 1550 is very X-ray luminous for its X-ray gas temperature. The NGC 1550 group is at least 5 times brighter than other groups in the same temperature range (Mulchaey & Zabludoff 1998). If we compare it with galaxy groups in HP00, it is 2 times brighter than any groups in the same temperature range. Consistent with its somewhat extreme position in the Lx - T relation, NGC 1550 is 3 times brighter than the best-fit X-ray luminosity - galaxy velocity dispersion (Lx - ) in Mulchaey & Zabludoff (1998) and at least 5 times brighter than the best-fit in HP00. We caution that the current Lx - relations is not well constrained for cool groups and there is large scatter.
5.7 The abundances of heavy elements
The abundance ratios of heavy elements give us clues to SN enrichment. The global Si/Fe ratio is 1, which agrees with that found for galaxy groups (Finoguenov, David, & Ponman 2000) and the value from recent XMM-Newton and Chandra observations of the NGC 5044 group (Buote et al. 2003b). This ratio implies that 80% of the iron is produced by SN Ia based on supernova nucleosynthesis models (e.g., summarized by Gibson, Loewenstein & Mushotzky 1997). This small ratio generally found in groups led Finoguenov et al. (2000) to conclude that SN Ia play a larger role in the enrichment of groups compared with that in clusters. S is relatively enriched in the group, especially around the center. We need more precise and robust measurement of Si and S abundances to better understand SN enrichment in this group.
6 Conclusion
We have presented an analysis of the Chandra observation of the NGC 1550 group. The derived physical properties of the NGC 1550 group are summarized in Table 1. The main conclusion of our study are:
1. The NGC 1550 group is among the brightest X-ray groups (L 1.651043 erg s-1 within 200 kpc, or 0.2 ) in its temperature (1.37 keV) and velocity dispersion ( 300 km s-1) range.
2. Like two other 1 keV groups (NGC 5044 and NGC 2563), the temperature profile of the NGC 1550 group declines beyond 0.08 and the declines are remarkably similar. The slope of the decline is similar to that of the “Universal temperature profile” from adiabatic simulations (Loken et al. 2003), and also similar to that of hot clusters (M98 and DM02). However, the cluster temperature decline occurs at much larger radii (0.2 - 0.6 ). This difference may reflect the roles of non-gravitational processes in ICM evolution.
3. The NGC 1550 group shows no isentropic core in its entropy profile, in contradiction to ‘entropy-floor’ simulations. Because of the temperature decline beyond 0.08 , the entropy profile flattens from 0.08 to 0.2 . The entropy profiles of 1 keV groups within 0.2 vary and do not follow the scaling as well as hotter systems. This may imply that the effects of non-gravitational processes vary for different systems.
4. The stellar, gas and total mass profiles of the NGC 1550 group are derived and show that the gas fraction and baryon fraction reach 0.07 and 0.1 respectively at 190 kpc. The R-band mass-to-light ratio is 15535 at 190 kpc. The NGC 1550 group is not a “fossil group” or an OLEG. The total mass profile can be better fit by Moore profile.
5. The Si/Fe ratio implies that SN Ia play a larger role for the enrichment of the group than SN II. Si, S and Fe all enrich at the center compared to the outer regions.
References
- (1) Allen, S. W., Ettori, S. & Fabian, A. C. 2001, MNRAS, 324, 877
- (2) Allen, S. W., Schmidt, R. W., & Fabian, A. C. 2001, MNRAS, 328, L37
- (3) Anders, E., & Grevesse N. 1989, Geochimica et Cosmochimica Acta, 53, 197
- (4) Arnaud, M. et al. 2001, A&A, 365, L80
- (5) Babul, A., Balogh, M. L., Lewis, G. F., & Poole, G. B. 2002, MNRAS, 330, 329
- (6) Beers, T. C., Flynn, K., Gebhardt, K. 1990, AJ, 100, 32
- (7) Beuing, J., Döbereiner, S., Böhringer, H., & Bender, R. 1999, MNRAS, 302, 209
- (8) Borgani, S. et al. 2002, MNRAS, 336, 409
- (9) Buote, D. A. 2000, ApJ, 539, 172
- (10) Buote, D. A., Lewis, A. D., Brighenti, B., Mathews, W. G. 2003a, ApJ, in press (astro-ph/0205362)
- (11) Buote, D. A., Lewis, A. D., Brighenti, B., Mathews, W. G. 2003b, ApJ, in press (astro-ph/0303054)
- (12) Cole, S. et al. 2001, MNRAS, 326, 255
- (13) Dav, R., Katz, N., & Weinberg, D. H. 2002, ApJ, 579, 23
- (14) David, L. P., Forman, W., & Jones, C. 1991, ApJ, 380, 39
- (15) David, L. P., Jones, C., Forman, W., Daines, S. 1994, ApJ, 428, 544
- (16) David, L. P., Jones, C., & Forman, W. 1995, ApJ, 445, 578
- (17) Davis, D. S., Mulchaey, J. S., Mushotzky, R. F., Burstein, D. 1996, ApJ, 460, 601
- (18) De Grandi, S., & Molendi, S. 2002, ApJ, 567, 163 (DM02)
- (19) Evrard, A. E.; Metzler, C. A.; Navarro, J. F. 1996, ApJ, 469, 494 (EMN96)
- (20) Finoguenov, A., David, L. P., Ponman, T. J. 2000, 544, 188
- (21) Finoguenov, A., Arnaud, M., David, L. P. 2001, ApJ, 555, 191
- (22) Finoguenov, A., Jones, C., Böhringer, H., Ponman, T. J. 2002, ApJ, 578, 74
- (23) Garcia, A. M. 1993, A&AS, 100, 47
- (24) Gibson, B. K., Loewenstein, M., & Mushotzky, R. 1997, MNRAS, 290, 623
- (25) Giuricin, G., Marinoni, C., Ceriani, L., Pisani, A. 2000, ApJ, 543, 178
- (26) Helsdon, S. F., & Ponman, T. J. 2000, MNRAS, 315, 356 (HP00)
- (27) Kauffmann, G. et al. 2003, MNRAS, 341, 33
- (28) Kochanek, C. S. et al. 2001, ApJ, 560, 566
- (29) Kraft, R. P. et al. 2003, ApJL, submitted (astro-ph/0304362)
- (30) Lloyd-Davies, E. J., Ponman, T. J., & Cannon, D. B. 2000, MNRAS, 315, 689
- (31) Loken, C. et al. 2003, ApJ, 579, 571L
- (32) Majerowicz, S., Neumann, D. M., & Reiprich, T. H. 2002, A&A, 394, 77
- (33) Markevitch, M., Forman, W. R., Sarazin, C. L., & Vikhlinin, A. 1998, ApJ, 503, 77 (M98)
- (34) Markevitch, M. 1998, ApJ, 504, 27
- (35) Markevitch, M., Vikhlinin, A. 2001, ApJ, 563, 95
- (36) Markevitch, M., et al. 2003, ApJ, 583, 70
- (37) Moore, B., Governato, F., Quinn, T., Stadel, J., & Lake, G. 1998, ApJ, 499, L5
- (38) Muanwong, O., Thomas, P. A., Kay, S. T., & Pearce, F. R. 2002, MNRAS, 336, 527
- (39) Mulchaey, J. S., & Zabludoff, A. I. 1998, ApJ, 496, 73
- (40) Mulchaey, J. S., Davis, D. S., Mushotzky, R., Burstein, D. 2003, ApJS, in press (astro-ph/0302393)
- (41) Mushotzky, R., Figueroa-Feliciano, E., Loewenstein, M., Snowden, S. L. 2003, astro-ph/0302267 (M03)
- (42) Navarro, J., Frenk, C., & White, S. 1997, ApJ, 490, 493
- (43) Ponman, T. J., Cannon, D. B., & Navarro, J. F. 1999, Nature, 397, 135
- (44) Ponman, T. J., Sanderson, A. J. R., & Finoguenov, A. 2003, MNRAS, in press (astro-ph/0304048)
- (45) Pratt, G. W., Arnaud, M., Aghanim, N. Clusters of galaxies and the high redshift universe observed in X-rays, Recent results of XMM-Newton and Chandra, XXXVIth Rencontres de Moriond , XXIst Moriond Astrophysics Meeting, 2001, edited by D. M. Neumann & J. T. T. Van, 38
- (46) Pratt, G. W., & Arnaud, M. 2002, A&A, 394, 375
- (47) Pratt, G. W., & Arnaud, M. 2003, A&A, in press (astro-ph/0304017)
- (48) Sanderson, A. J. R., Ponman, T. J., Finoguenov, A., Lloyd-Davies, E. J., & Markevitch, M. 2003, MNRAS, in press, (astro-ph/0301049)
- (49) Sun, M., Jones, C., Murray, S. S., Allen, S. W., Fabian, A. C., Edge, A. 2003, ApJ, 587, 619
- (50) Tozzi, P., & Norman, C. 2001, ApJ, 546, 63 (TN01)
- (51) Vikhlinin, A. et al. 1999, ApJ, 520, L1
- (52) Voit, G. M., & Bryan, G. L. 2001, Nature, 414, 425
- (53) Young, P. J. 1976, AJ, 81, 807
- (54) Zabludoff, A. I., & Mulchaey, J. S. 1998, ApJ, 496, 39
| N | Distanceb | NH | Tc | Sic | Fec | Log L | Log (LR/L⊙)e | ||
| (km s-1) | (km s-1) | (Mpc) | (1021 cm-2) | (keV) | (solar) | (solar) | (ergs s-1) | ||
| 3694 | 31151 | 16 | 53.7 | 1.14 | 1.370.01 | 0.28 | 0.330.02 | 43.22 | 10.78 |
a The velocity information is from NED.
b For h
c The emission-weighted temperature obtained from the VMEKAL model fit to the global spectrum
d The bolometric luminosity within 200 kpc radius
e The integrated R-band light within 60 kpc of NGC 1550