Iron Emission in the Quasar SDSS J114816.64+525150.3
Abstract
We present near-infrared and -band spectra of the quasar SDSS J114816.64+525150.3 obtained with the NIRSPEC spectrograph at the Keck-II telescope, covering the rest-frame spectral regions surrounding the C IV and Mg II emission lines. The iron emission blend at rest wavelength 2900–3000 Å is clearly detected and its strength appears nearly indistinguishable from that of typical quasars at lower redshifts. The Fe II/Mg II ratio is also similar to values found for lower-redshift quasars, demonstrating that there is no strong evolution in Fe/ broad-line emission ratios even out to . In the context of current models for iron enrichment from Type Ia supernovae, this implies that the SN Ia progenitor stars formed at . We apply the scaling relations of Vestergaard and of McLure & Jarvis to estimate the black hole mass from the widths of the C IV and Mg II emission lines and the ultraviolet continuum luminosity. The derived mass is in the range , with an additional uncertainty of a factor of 3 due to the intrinsic scatter in the scaling relations. This result is in agreement with the previous mass estimate of by Willott, McLure, & Jarvis, and supports their conclusion that the quasar is radiating close to its Eddington luminosity.
1 Introduction
The broad emission lines of high-redshift quasars are luminous beacons that can be used to study the metal enrichment history of the densest regions in the early universe (e.g., Hamann & Ferland, 1999). Observations of emission lines such as C IV and N V reveal supersolar abundances in quasar broad-line regions (BLRs) even at (Dietrich et al., 2003a), strengthening the link between the growth and fueling of black holes and the buildup of stellar mass in the host galaxies. The abundance ratio of iron to elements is a key diagnostic that may be used as a “clock” to constrain the earliest epoch of star formation (Hamann & Ferland, 1993; Yoshii et al., 1998), since enrichment of elements occurs via core-collapse supernovae while the dominant channel for iron enrichment is Type Ia supernovae, which have longer-lived progenitor stars.
The flux ratio of the integrated iron emission in the 2200–3000 Å wavelength range to Mg II is an observationally accessible diagnostic that is dependent on the underlying Fe/Mg abundance ratio, but also sensitive to the BLR density and microturbulence (Verner et al., 2003). Numerous studies have demonstrated that there is no systematic decrease in the Fe II/Mg II flux ratio of quasars with increasing redshift, even out to (e.g., Thompson, Hill, & Elston, 1999; Dietrich et al., 2002, 2003b; Freudling et al., 2003), while Iwamuro et al. (2002) found evidence for an increase in Fe II/Mg II with increasing redshift to .
SDSS J114816.64+525150.3 (abbreviated here as SDSS J1148+5251) was discovered by Fan et al. (2003) in the Sloan Digital Sky Survey; at it is the highest-redshift quasar currently known. Willott et al. (2003) used and -band spectra of this object to obtain an estimate of the black hole mass ( ) from the Mg II linewidth, using the scaling relations derived by McLure & Jarvis (2002). The Mg II line was the only emission feature clearly present in their spectrum; the limited S/N of their data did not permit a definitive detection of the surrounding Fe II emission blends. The quasar environment was evidently a site of vigorous massive star formation and metal enrichment prior to , as demonstrated by the roughly normal equivalent width of the Mg II emission line as well as the presence of submillimeter emission from of dust in the quasar host galaxy (Bertoldi et al., 2003). Here, we present new near-infrared spectra of SDSS J1148+5251 obtained at the Keck Observatory, covering the rest-frame spectral regions surrounding the C IV and Mg II emission lines. We show that its Fe II/Mg II ratio is similar to that of typical quasars at lower redshifts, and we update the black hole mass estimate of Willott et al. using the higher-quality Keck data. Except where noted otherwise, we assume km s-1 Mpc-1, , and ; for this cosmology the universe at was 840 Myr old.
2 Observations and Reductions
The observations were obtained using the NIRSPEC spectrograph (McLean et al., 2000) at the Keck-II telescope on the nights of 2003 March 11 and 12 UT. We used a -wide slit in the NIRSPEC-1, 2, and 6 settings, which cover the wavelength ranges 0.95–1.12, 1.08–1.29, and 1.89–2.31 µm, respectively, at . A standard ABBA nodding sequence was used with exposure times of 300 s at each nod position. The airmass ranged from 1.2 to 1.5. Seeing, as measured from the spatial profiles of calibration star exposures, was typically between 07 and 09. The total exposure times in each setting were 6000, 9600, and 8400 s, respectively. Due to hardware problems, the nodding and guiding performance of NIRSPEC was relatively poor during this run and slit losses were severe, possibly during some individual exposures.
The spectra were extracted from bias-subtracted, flattened 2-dimensional frames using an optimal weighting algorithm, and using the sky-subtraction code of Kelson (2003). Wavelength calibration was performed with the OH airglow emission lines in each exposure. The data were flux-calibrated and corrected for telluric absorption using spectra of the A0V star HD 99966, observed immediately before or after the quasar in each setting, following the methods described by Vacca, Cushing, & Rayner (2003). Finally, the spectra were scaled to the and magnitudes given for SDSS J1148+5251 by Fan et al. (2003), to place them on an absolute flux scale.
3 Results and Discussion
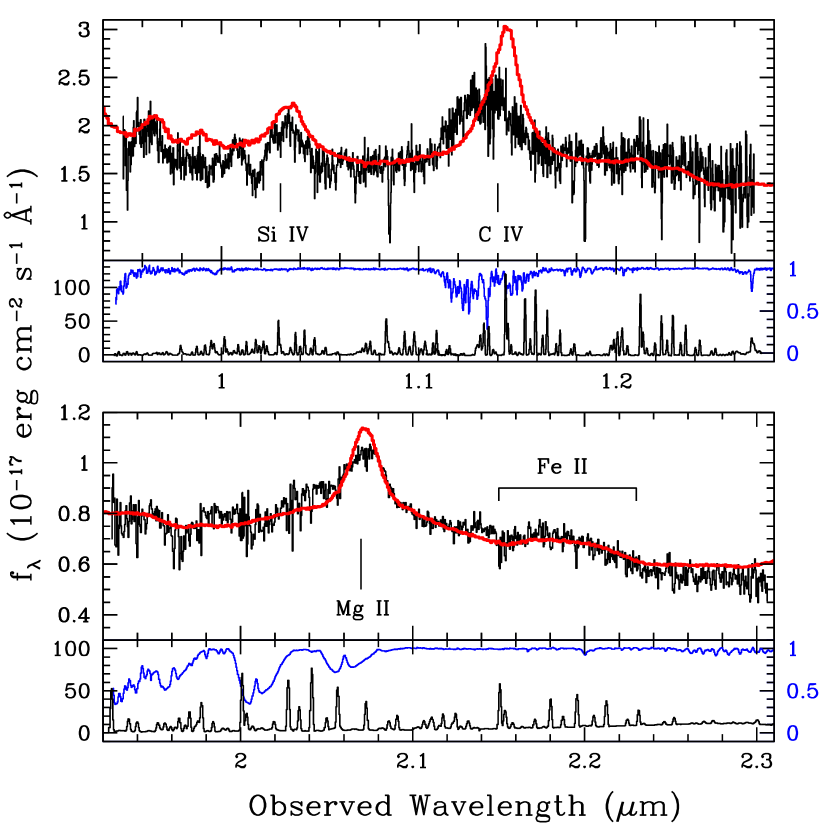
The spectra are displayed in Figure 1, overplotted with the SDSS composite quasar spectrum of Vanden Berk et al. (2001). The best match between the Mg II profile of SDSS J1148+5251 and the SDSS composite is found for a redshift of , in agreement with the previous measurement of by Willott et al. (2003). However, the C IV emission line appears strongly blueshifted with respect to the Mg II redshift and is much broader than the C IV line of the composite quasar. The C IV line falls within a telluric absorption band at 1.14 µm, making accurate flux calibration difficult, but the extended blue wing of C IV does appear to be a real feature in the spectrum. In quasars, Mg II is considered a good indicator of the systemic redshift while relative C IV blueshifts of 500–2000 km s-1 or more are common (Marziani et al., 1996; Richards et al., 2002). The centroid of the C IV line measured by a Gaussian fit corresponds to a blueshift of km s-1 relative to the Mg II line. Richards et al. (2002) find that the Si IV emission line of quasars is typically not strongly blueshifted, unlike C IV; Figure 1 shows that SDSS J1148+5251 appears to follow this trend.
The data do not reveal any broad absorption lines, but a few narrow absorption lines are present. The strongest are at 1.0853 µm (equivalent width Å) and at 1.1842 µm (equivalent width Å). Neither is coincident with an atmospheric absorption or emission feature, and they appear to be genuine features in the quasar spectrum. The line at 1.1842 µm is unresolved, while the 1.0853 µm feature is marginally broader than the night sky emission lines but not broad enough to be consistent with a blended C IV or Mg II doublet. The identification of these lines is uncertain, and neither of them matches any wavelengths that would be expected for metal absorption lines from the C IV absorber found by White et al. (2003).
3.1 Fe II Emission
In general, measurement of the iron emission strength is best accomplished when the data have wide spectral coverage, so that spectral regions without either iron emission or Balmer continuum emission can be included in the fit (e.g., Dietrich et al., 2002). Our spectrum does not extend to sufficiently long wavelengths to do this, and we fit only the rest-frame spectral region 2610–3100 Å. An Fe II emission blend at 2900–3000 Å is clearly present in the Keck spectrum. From the comparison between the NIRSPEC data and the SDSS composite spectrum in Figure 1, it is already apparent that the Fe II/Mg II ratio in SDSS 1148+5251 is roughly similar to that in the composite quasar.
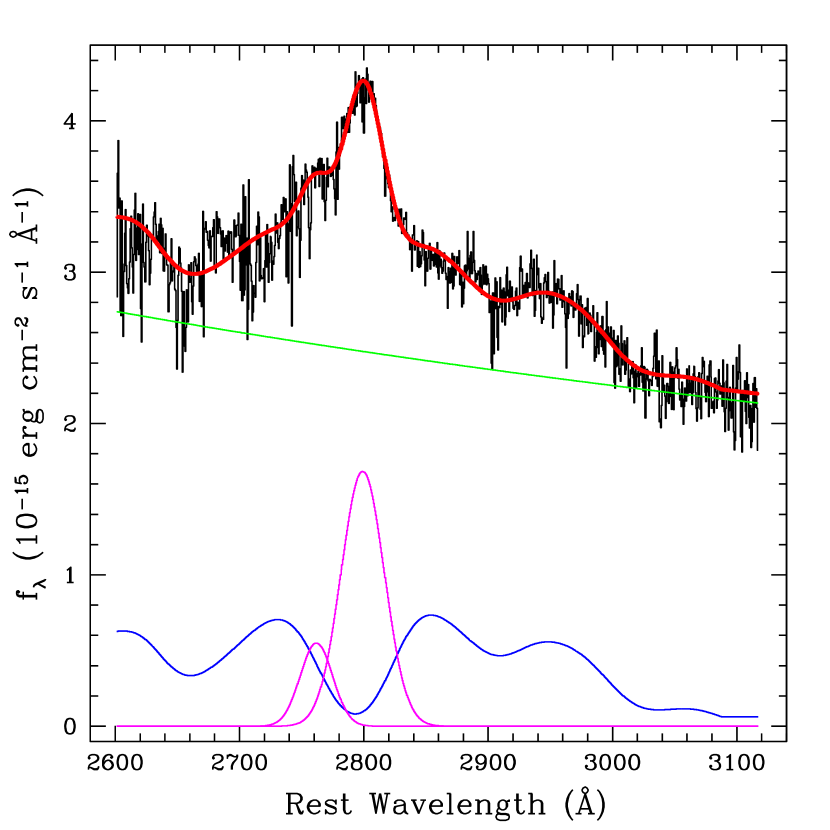
The spectrum was modeled as the sum of three components: a power-law continuum, an empirical iron emission template, and a double-Gaussian model for the Mg II profile. For the Mg II model, all of the Gaussian parameters were allowed to float freely. We do not ascribe any particular physical interpretation to the two components in terms of the structure of the emission-line regions; this is simply the minimal empirical description that allows an adequate fit to the emission line. Dietrich et al. (2002) show that the Mg II profiles of quasars can generally be fit well by a Gaussian near the systemic velocity plus another blueshifted (and usually broader) Gaussian component. We note that the model fit may be affected by an imperfect correction for telluric absorption in the blue wing of Mg II. Given our limited spectral coverage we chose not to include the Balmer continuum emission as a separate component, since its strength could not be determined independently of the dominant power-law continuum.
The iron blends in this wavelength region are traditionally modeled using an empirical “template” spectrum derived from an AGN with intrinsically narrow emission lines. We used an iron template derived from HST ultraviolet observations of I Zw 1 as described by Vestergaard & Wilkes (2001)111The Vestergaard & Wilkes (2001) iron template is not distributed or shared freely, so we re-created their template spectrum using information given in their published article.; the iron emission is dominated by Fe II blends with a contribution from Fe III. The iron template was broadened by convolution with a Gaussian having the same width as the stronger Mg II component. To optimize the fit we computed a parameter determined using the uncertainties on each pixel in the flux-calibrated spectra. Figure 2 displays the best-fitting model. The power-law index of the model continuum is for , similar to the value of for the SDSS composite quasar (Vanden Berk et al., 2001).
Following Dietrich et al. (2002), the Fe II/Mg II emission-line ratio was determined by integrating the iron template flux over the wavelength range 2200–3090 Å. Although this requires extrapolation of the scaled iron template beyond the wavelength range over which our fit was performed, it allows the most straightforward comparison with previous measurements. We find Fe II/Mg II = . This result is similar to values that have been found for quasars over all observed redshifts. For example, Dietrich et al. (2002) obtained Fe II/Mg II = 3.3–4.2 for six quasars at and Fe II/Mg II = for a low- composite quasar, while Thompson, Hill, & Elston (1999) measured Fe II/Mg II (over a slightly wider wavelength range of 2000–3000 Å for Fe II) for composite quasar spectra at and , and for a low- composite quasar. Our result is also within the same range as values measured by Iwamuro et al. (2002), Dietrich et al. (2003b), and Freudling et al. (2003) for quasars at .
Thus, the lack of any strong evolution in Fe II/Mg II noted by Thompson et al. out to apparently continues out to ; even at this redshift there is still no indication of a substantial decrease in this ratio. If the Fe II/Mg II flux ratio can be interpreted as even a rough indicator of the underlying abundance ratio, then the age of the universe at provides some constraints on metal enrichment models. The minimum lifetime for SN Ia progenitors has often been considered to be –1.5 Gyr; this would imply that the Fe/ abundance ratio should undergo a strong rise starting at 1–1.5 Gyr following the first burst of star formation in which SN Ia progenitors are created (Hamann & Ferland, 1993; Yoshii et al., 1998).
Observations of Fe II/Mg II ratios in quasars at could still be consistent with such models (Dietrich et al., 2002), but our observations and those of Freudling et al. (2003) rule out models with iron enrichment timescales of Myr. However, the timescale for the maximum SN Ia rate (and hence iron enrichment) depends sensitively on the star formation rate and initial mass function, and may be much shorter than the canonical 1 Gyr for an intense starburst in the core of a rapidly forming elliptical galaxy (Friaça & Terlevich, 1998; Matteucci & Recchi, 2001). The models of Friaça & Terlevich (1998) give a typical timescale of 0.3 Gyr to reach solar abundance of iron in the interstellar medium of a proto-elliptical galaxy; similarly, Matteucci & Recchi (2001) find that the peak SN Ia rate in an elliptical galaxy occurs Gyr after the major burst of star formation. If the iron abundance were built up in just 0.3 Gyr, then the SN Ia progenitors would have formed at . There may be only a brief temporal window during which a quasar would exhibit a low Fe/ abundance ratio, and this epoch could be at a redshift as high as if star formation began at (e.g., Kogut et al., 2003). Alternatively, the iron may have been produced in pair-instability supernovae from Population III stars with initial masses of 140–260 ; a single such explosion could produce up to 40 of iron (Heger & Woosley, 2002). This would result in iron enrichment of the pregalactic gas within a few Myr after the first burst of star formation.
3.2 The Mass of the Black Hole
The only practical methods to estimate the black hole masses in distant quasars are based on scaling relations derived from low-redshift samples. Reverberation mapping of Seyfert galaxies and quasars at has demonstrated a correlation between continuum luminosity and BLR radius (Wandel, Peterson, & Malkan, 1999; Kaspi et al., 2000). By combining the continuum luminosity with measurements of broad-line widths, the black hole mass can be estimated under the assumption of virial motion of the BLR clouds. The original scaling relations were derived from FWHM(H) and the continuum luminosity at 5100 Å, but similar relations have been determined using ultraviolet continuum luminosity combined with the linewidth of either C IV (Vestergaard, 2002) or Mg II (McLure & Jarvis, 2002). These relations have the form (UV) FWHM(line)2, where = 0.47 (McLure & Jarvis, 2002) or 0.7 (Vestergaard, 2002). The dominant uncertainty in the estimates comes from the intrinsic scatter in the –linewidth correlations, which is a factor of , rather than from measurement uncertainties on the linewidths.
Willott et al. (2003) found FWHM(Mg II) = km s-1 based on a double-Gaussian fit with the two components fixed at rest wavelengths of 2796 and 2802 Å, giving . Our spectrum shows that the profile is rather asymmetric, and the full Mg II profile has FWHM(Mg II) = km s-1. Applying the McLure & Jarvis (2002) relation with (3000 Å) W, we obtain . This result is close to the previous estimate by Willott et al., since we find similar values for FWHM(Mg II) and (3000 Å).
The peculiar shape of the C IV line might result from non-Keplerian kinematics, calling into question the application of the Vestergaard (2002) method to derive for this particular object. Keeping this caveat in mind, we will derive an estimate from the C IV line for purposes of comparison with the Mg II method. To measure FWHM(C IV), the spectrum was first prepared by subtracting off the Fe template, with its overall scaling determined by the fit to the -band spectrum. The Fe emission only makes a small () contribution to the flux level in the continuum surrounding C IV. Then, the region from 1450 to 1630 Å rest wavelength was fit with a single Gaussian plus continuum. The best-fit Gaussian has FWHM(C IV) = km s-1. Vestergaard’s relation was derived assuming a cosmology with km s-1 Mpc-1, , and . Taking (1350 Å) erg s-1 for these cosmological parameters, we obtain for SDSS J1148+5251. Given that these scaling methods have an estimated uncertainty of a factor of 2.5–3, the two estimates of from Mg II and C IV are in reasonable agreement. It would still be worthwhile to obtain a C IV spectrum with higher S/N ratio to check the reality of the large blueshift and linewidth.
To estimate the bolometric luminosity, we apply a bolometric correction of Å, which is typical of low-redshift quasars (Elvis et al., 1994). This gives erg s-1 and implies (as previously shown by Willott et al.) an Eddington ratio of for .
A few additional caveats should be noted: the apparent luminosity of the quasar can be affected by dust extinction, continuum beaming, or gravitational lensing. Significant extinction is unlikely because the spectral shape of the quasar does not appear strongly reddened relative to the SDSS composite quasar, while Willott et al. (2003) argue against continuum beaming because the Mg II equivalent width is typical of unbeamed quasars. Lensing is expected to affect only a small fraction of high- SDSS quasars (Wyithe & Loeb, 2002; Pindor et al., 2003), and infrared images of SDSS J1148+5251 do not give any indication of lensing (Fan et al., 2003).
It is remarkable to find such a massive black hole at such a large look-back time. Nevertheless, models for the hierarchical growth of supermassive black holes by merging and gas accretion can accommodate masses of in quasars at if the seed black holes form at (e.g., Haiman & Loeb, 2001; Volonteri, Haardt, & Madau, 2003). The initial seed black holes may be objects with formed by collapse of supermassive Population III stars (Fryer, Woosley, & Heger, 2001; Madau & Rees, 2001; Schneider et al., 2002). We note that even a single seed black hole having 180 at could (just barely) grow to by if it were constantly accreting at the Eddington luminosity with a radiative efficiency of , so the present data do not yet require multiple black hole mergers to build up the observed black hole mass.
4 Conclusions
The Keck spectra reveal an Fe II/Mg II ratio in SDSS J1148+5251 that is within the normal range for quasars at lower redshifts, indicating that substantial iron enrichment must have occurred in the densest regions of the universe at redshifts greater than 6.4. Recent photoionization calculations by Verner et al. (2003) have shown that Fe II/Mg II is not a straightforward diagnostic of Fe/ abundance ratios, but useful constraints on the Fe/Mg abundance ratio can be derived from observations of the ultraviolet Fe II/Mg II ratio combined with the ratio of ultraviolet to optical Fe II strength. The rest-frame optical Fe II emission in very high-redshift quasars cannot be measured from the ground, but these measurements can be pursued in the future with the James Webb Space Telescope. Searches for quasars at still higher redshifts may provide a glimpse of the earliest epoch of iron production and give stringent constraints on the formation redshift of the seed black holes that were the progenitors of luminous quasars.
References
- Bertoldi et al. (2003) Bertoldi, F., Carilli, C. L., Cox, P., Fan, X., Strauss, M. A., Beelen, A., Omont, A., & Zylka, R. 2003, A&A, in press
- Dietrich et al. (2002) Dietrich, M., Appenzeller, I., Vestergaard, M., & Wagner, S. J. 2002, ApJ, 564, 581
- Dietrich et al. (2003a) Dietrich, M., Hamann, F., Shields, J. C., Constantin, A., Heidt, J., Jäger, K., Vestergaard, M., & Wagner, S. J. 2003a, ApJ, 589, 722
- Dietrich et al. (2003b) Dietrich, M., Hamann, F., Appenzeller, I., & Vestergaard, M. 2003b, ApJ, in press
- Elvis et al. (1994) Elvis, M., et al. 1994, ApJS, 95, 1
- Fan et al. (2003) Fan, X., et al. 2003, AJ, 125, 1649
- Freudling et al. (2003) Freudling, W., Corbin, M. R., & Korista, K. T. 2003, ApJ, 587, L67
- Friaça & Terlevich (1998) Friaça, A. C. S. & Terlevich, R. J. 1998, MNRAS, 298, 399
- Fryer, Woosley, & Heger (2001) Fryer, C. L., Woosley, S. E., & Heger, A. 2001, ApJ, 550, 372
- Haiman & Loeb (2001) Haiman, Z., & Loeb, A. 2001, ApJ, 552, 459
- Hamann & Ferland (1993) Hamann, F., & Ferland, G. 1993, ApJ, 418, 11
- Hamann & Ferland (1999) Hamann, F., & Ferland, G. 1999, ARA&A, 37, 487
- Heger & Woosley (2002) Heger, A. & Woosley, S. E. 2002, ApJ, 567, 532
- Iwamuro et al. (2002) Iwamuro, F., Motohara, K., Maihara, T., Kimura, M., Yoshii, Y., & Doi, M. 2002, ApJ, 565, 63
- Kaspi et al. (2000) Kaspi, S., Smith, P. S., Netzer, H., Maoz, D., Jannuzi, B. T., & Giveon, U. 2000, ApJ, 533, 631
- Kelson (2003) Kelson, D. D. 2003, PASP, 115, 688
- Kogut et al. (2003) Kogut, A., et al. 2003, ApJ, in press
- Madau & Rees (2001) Madau, P., & Rees, M. J. 2001, ApJ, 551, L27
- Marziani et al. (1996) Marziani, P., Sulentic, J. W., Dultzin-Hacyan, D., Calvani, M., & Moles, M. 1996, ApJS, 104, 37
- Matteucci & Recchi (2001) Matteucci, F., & Recchi, S. 2001, ApJ, 558, 351
- McLean et al. (2000) McLean, I. S., Graham, J. R., Becklin, E. E., Figer, D. F., Larkin, J. E., Levenson, N. A., & Teplitz, H. I. 2000, Proc. SPIE, 4008, 1048
- McLure & Jarvis (2002) McLure, R. J., & Jarvis, M. J. 2002, MNRAS, 337, 109
- Pindor et al. (2003) Pindor, B., Turner, E. L., Lupton, R. H., & Brinkmann, J. 2003, AJ, 125, 2325
- Richards et al. (2002) Richards, G. T., Vanden Berk, D. E., Reichard, T. A., Hall, P. B., Schneider, D. P., SubbaRao, M., Thakar, A. R., & York, D. G. 2002, AJ, 124, 1
- Schneider et al. (2002) Schneider, R., Ferrara, A., Natarajan, P., & Omukai, K. 2002, ApJ, 571, 30/
- Thompson, Hill, & Elston (1999) Thompson, K. L., Hill, G. J., & Elston, R. 1999, ApJ, 515, 487
- Vacca, Cushing, & Rayner (2003) Vacca, W. D., Cushing, M. C., & Rayner, J. T. 2003, PASP, 115, 389
- Vanden Berk et al. (2001) Vanden Berk, D. E., et al. 2001, AJ, 122, 549
- Verner et al. (2003) Verner, E., Bruhweiler, F., Verner, D., Johansson, S., & Gull, T. 2003, ApJ, 592, L59
- Vestergaard (2002) Vestergaard, M. 2002, ApJ, 571, 733
- Vestergaard & Wilkes (2001) Vestergaard, M., & Wilkes, B. J. 2001, ApJS, 134, 1
- Volonteri, Haardt, & Madau (2003) Volonteri, M., Haardt, F., & Madau, P. 2003, ApJ, 582, 559
- Wandel, Peterson, & Malkan (1999) Wandel, A., Peterson, B. M., & Malkan, M. A. 1999, ApJ, 526, 579
- White et al. (2003) White, R. L., Becker, R. H., Fan, X., & Strauss, M. A. 2003, AJ, 126, 1
- Willott et al. (2003) Willott, C. J., McLure, R. J., & Jarvis, M. J. 2003, ApJ, 587, L15
- Wyithe & Loeb (2002) Wyithe, J. S. B., & Loeb, A. 2002, ApJ, 581, 886
- Yoshii et al. (1998) Yoshii, Y., Tsujimoto, T., & Kawara, K. 1998, ApJ, 507, L113