The Peculiar X-ray Transient IGR
Abstract
The new transient IGR was discovered on 2003 March 19 with INTEGRAL. We detected the source serendipitously during our 2003 March 24 observation of SGR with the Chandra X-ray observatory at the ergs s-1 cm-2 flux level ( keV) with a very high absorption column ( cm-2) and a hard power law spectrum of index 0.5(1). We discovered a very strong flux modulation with a period of 5880(50) s and peak-to-peak pulse fraction of 70(6) % ( keV), clearly visible in the x-ray data. The nature of IGR remains unresolved. The only neutron star systems known with similar spin periods are low luminosity persistent wind-fed pulsars; if this is a spin period, this transient is a new kind of object. If this is an orbital period, then the system could be a compact Low Mass X-ray Binary (LMXB).
Subject headings:
pulsars: individual (IGR )1. Introduction
Ten new hard and relatively faint X-ray transients have been detected in the last few months during galactic plane scans by the IBIS/ISGRI detector (Ubertini et al. 2003; Lebrun et al. 2003) on the INTEGRAL Observatory (Winkler et al. 2003). Their unusual spectral hardness has led to suggestions that these sources belong to a group of highly absorbed galactic binary systems, discovered due to the unique IBIS sensitivity in higher energy bands than earlier monitoring instruments. Two of these sources, IGR J and IGR J, were subsequently observed with the XMM-Newton satellite. The EPIC-PN detector spectrum of the former source revealed a very strong Fe Kα emission line and significant Kβ and Ni Kα lines that were variable in time (Matt & Guainazzi 2003), whereas the latter exhibited no line features (Rodriguez et al. 2003). The spectral continuum of four out of the five sources (measured with the Rossi X-ray Timing Explorer (RXTE) or XMM-Newton) was best fit with power law functions with photon indices, . Finally, all sources showed variations ranging in timescales of s to a few 1000 s, but none showed evidence for coherent modulations.
IGR was detected (Revnivtsev et al. 2003a) with INTEGRAL on 2003 March 19 during a standard ( s) Galactic plane scan as a 50 mCrab source ( keV). Preliminary analysis of additional INTEGRAL scans on 2003 March 22 and 26 indicated a decline in the source flux. Analysis of archival observations with the Advanced Satellite for Cosmology & Astrophysics (ASCA) and BeppoSAX in 1999, revealed a source consistent with the location of IGR . BeppoSAX observations in 1998 & 2000, however, did not detect the source.
We serendipitously observed IGR during a Chandra scheduled observation of SGR (Kouveliotou et al. 2003a), and then again with Director’s Discretionary Time (DDT) one month later. In addition we triggered Target of Opportunity observations with RXTE and with the Australia Telescope Compact Array (ATCA); the analysis of the RXTE data is reported in detail by Revnivtsev (2003c). ATCA observed IGR over a 10.5 hr period beginning at UT 11:53 on 2003 April 13. The total on-source integration time was 5 hr. No source was detected at the position of the X-ray source at an observing frequency of 4.8 GHz, with a upper imit of 0.9 mJy. We report in Sections 2, 3 and 4 the results of our analysis of the archival and current X-ray observations and discuss in Section 5 the implications of these results for the nature of IGR .
2. Archival X-ray Observations of IGR
The field containing IGR was observed with ASCA on 1999 February 26-28 during a scheduled observation of SGR . The transient was only in the (wider) field of view of the two ASCA/Gas Imaging Spectrometers (GIS). We combined the GIS data and grouped the resulting spectrum in energy bins that contained at least 25 events each. Using XSPEC (v11.2; Arnaud 1996) we fit an absorbed single power law (PL) model, which gave an acceptable fit (). The best fit column density and photon power law index are, cm-2 and , respectively. We derive an unabsorbed flux of ergs cm-2 s (210 keV), consistent with the analysis of Revnivtsev et al. (2003b).
| ASCA/GIS | keV Fluxa | ||
|---|---|---|---|
| Date | Exposure Time (ks) | Absorbed | Unabsorbed |
| 26-28 Feb 1999 | 69 | ||
| BeppoSAX MECS/LECS | keV Flux | ||
| 06 Aug 1998b | 45/ 21 | ||
| 16 Sep 1998b | 30/ 12 | ||
| 08 Aug 1999 | 34/ 80 | ||
| 26 Sep 2000b | 61/ 21 | ||
| a Flux is in units of ergs s-1 cm-2, b 90% upper limit | |||
BeppoSAX observed the SGR field four times (Table 1). Using XSELECT (v2.1) we extracted spectra from circular regions centered on IGR with radii of and for the LECS and MECS, respectively. We use the standard response files provided by the BeppoSAX Data Archive at HEASARC. The source was not detected during the observations in 1998 or 2000 and we derived a upper limit for the unabsorbed flux (Table 1). We detect the source during the 1999 observations, albeit very faint. We have used the spectral parameters derived with the ASCA data to fit the BeppoSAX source counts and find a flux value that is slightly higher than the one reported by Revnivtsev et al. (2003b). In fact, the true flux may be even higher, when one takes into account the partial source blockage due to the support structure for the MECS detector windows.
3. Chandra Observations of IGR
We observed the transient for 25.7 ks with the Advanced CCD Imaging Spectrometer (ACIS) on Chandra on 2003 March 25 (Obs1). We used the CIAO v2.3 and CALDB v2.21 software for all data analysis and processing tasks. Details of the observation and data reduction techniques are presented in Kouveliotou et al. (2003b); an accurate () location of the source is given in Wachter et al. (2003). During this observation IGR fell off axis on the (front illiuminated CCD) ACIS-S2. The source was very bright, however, the pile-up effect was negligible due to the significant broadening of the point spread function (PSF), enabling reliable spectral measurements (§3.2). We observed the source again (Obs2) on 2003 April 21 for 47 ks; we selected the continuous clocking (CC) mode to mitigate any pile-up and to exploit the mode’s 2.85 ms time resolution.
3.1. Timing Analysis
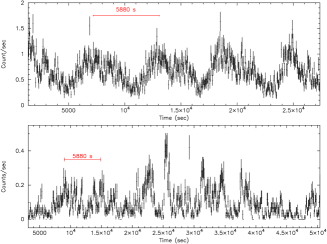
Strong pulsations with a period 100 min are directly visible in the light curve (Figure 1; upper panel) during Obs1 (Kouveliotou et al. 2003a). We measured the pulse period by first maximizing the signal-to-noise in the light curve by selecting photon energies in the range keV and by correcting the arrival times to the Solar System barycenter. Next, we constructed a template pulse profile from the full data set using a trial period determined from an epoch fold search. The data were split into 4 roughly equal time segments and folded on this trial period. We compared the relative phases of the four segments to the pulse template and finally we fitted them to a linear trend, which yielded the correction to our trial period. After a series of iterations, we find the best fit period for Obs1 to be 5880(50) s. The pulse profile has a dominant sinusoidal component with significant substructure and varies as a function of energy (Figure 2; left panel). A portion of the substructure can be attributed to a quasi-periodic oscillation feature at Hz. The pulse fraction is constant with energy across the Chandra bandpass; the keV rms value is 36.6(8)% (70(6)% peak-to-peak).
During Obs2 the source was detected at a lower intensity, a factor of fainter in flux ( keV). In addition, a visual inspection of the light curve shows substantially more flickering than present in Obs1 (Figure 1; lower panel). The Fourier power spectrum shows the 100 min pulsations at much weaker significance superposed upon an excess of red noise. There are no other coherent high frequency signals out to 175 Hz. Using the same technique as before, we measure a pulse period of s, consistent with the period derived from Obs1. The folded pulse profile during Obs2 (Figure 2; right panel) is significantly different than what it was four weeks earlier; the pulse shape is more complex with more power in the higher harmonics. Despite the changes in pulse shape, the pulse fraction has remained high and constant at rms ( keV). We performed a cross-correlation of the high and medium energy (Figure 2) pulse profiles of Obs2 and find a soft lag of s; a lag was not detected in a preliminary analysis of Obs1. A refined analysis will be reported elsewhere (Patel et al. in preparation).

3.2. Spectral analysis
IGR is detected significantly off-axis () during Obs1, necessitating a large extraction radius for the source spectrum to account for the significant PSF distortion of the source and for the scattering of the hard photons of the source spectrum. We have, thus, collected source events from a circular region of radius. We extracted a background spectrum from a source free region of radius and on the same CCD. Finally, we grouped the data into energy channels that contained at least 25 events each.
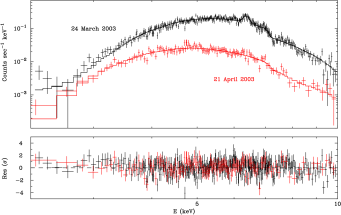
We report here results on our phase-averaged fits to the data. During Obs1 the spectrum includes a highly significant Fe line feature and is hard and highly absorbed. We have initially fitted the data with a PL + a Gaussian line model; the best fit parameters are given in Table 2, and the spectral fit is shown in Figure 3. The 2003 Chandra flux is times higher than the ASCA flux of 1999. We have also fitted the data with an absorbed thermal blackbody (BB) model with a line (Table 2); the fit statistic is slightly improved. Finally, we have tested two-component (continuum) models of PL + BB and PL + PL; we also find acceptable fits. However, the additional (PL) component in each case is very soft and steep, mostly contributing to a very narrow spectral range of the continuum below 3 keV, where the signal is very low. We conclude that the single model fits (PL or BB) better describe the data.
During Obs2, the spectrum is also well described by an absorbed PL. We find that the absorption column has decreased significantly since Obs1, but is still in agreement with the best fit column density measured by ASCA, suggesting that at least part of the column is due to local absorption. Furthermore, we find that the Fe line feature has faded beyond detection in Obs2. The upper limit we measure on the line equivalent width suggests that the flux in the line has faded more than the continuum flux; the latter is now a factor of 15.5 lower than Obs1. Figure 3 also shows the PL spectral fit result of Obs2. The spectral parameters are listed in Table 2, together with the results of an absorbed BB model fit.
Finally, we have fitted the two Chandra observations simultaneously using an absorbed PL Fe line model. Here we linked the galactic absorption and Fe line component and added an additional intrinsic absorption component; the latter was free to vary for Obs1 but assumed to be zero for Obs2. With free, we derive galactic and intrinsic (Obs1) column densities and photon power law indices consistent with the individual fit values above (Table 2). In a similar fashion, we simultaneously fit both observations using an absorbed BB Fe line model. With and line parameters linked and free, we find galactic and intrinsic (Obs1) column densities and temperatures also consistent with the previous (not linked) values (Table 2).
| Model | (Abs) | (Unabs) | /DOF | ||||||||
| OBS1 ONLY | |||||||||||
| PLGaussian | … | … | … | ||||||||
| BBGaussian | … | … | … | ||||||||
| PLPLGaussianb | … | … | |||||||||
| BBPLGaussianc | … | … | |||||||||
| OBS2 ONLY | |||||||||||
| PLGaussiand | … | … | … | … | … | ||||||
| BBGaussiand | … | … | … | … | … | ||||||
| OBS1OBS2e | |||||||||||
| PLGaussiand | … | … | 1.3(2) | , | , | , | |||||
| BBGaussiand | … | … | , | 1.3(1) | , | , | , | ||||
| Notes: Uncertainties are 68% confidence limits. All models include galactic absorption a , and EW in keV, in cm-2, fluxes are in ergs s-1 cm-2 keV) b Double power law Gaussian line model fits. PL1 component constitutes of the unabsorbed flux cPL2 corresponds to the additional power law model component in this model. BB component constitutes of the unabsorbed flux d Line Flux: flux upper limit for a line at 6.4 keV with similar intrinsic width as the one in Obs1 e Data from Obs1 and Obs2 are fit simultaneously. The pairs of values represent the spectral parameters from Obs1 and Obs2 respectively. | |||||||||||
Further, we performed phase-resolved spectroscopy in five phase-bins with the data of Obs1 using a PL a Gaussian line model. We find that while the column density remains constant, the spectral index rises slightly during the ascending part of the pulse profile; the spectrum is marginally softer during the pulse decay. The 6.4 keV Fe line intensity is constant throughout the entire pulse. We will report detailed phase-resolved spectroscopy results for both observations in a future work (Patel et al. in preparation).
4. Discussion
Our Chandra observations of the Fe line centroid in the IGR spectrum indicate that most likely the source is in a galactic X-ray binary system. If the 1.6 hr period is orbital, then there are two types of X-ray binary systems which can have similar periods and X-ray light-curve properties: a Cyg X-3 like system (4.8 hr period; Milgrom 1976; Parsignault et al. 1977) and high-inclination accretion disk corona (ADC) systems such as 4U (5.57 hr period; White et al. 1981). Like both these sources IGR in outburst is showing a smoothly varying X-ray light-curve; the depth of the modulation is not indicative of an eclipse and there is no phase dependent absorption. All three spectra are similar, well fit with a (hard) power law with a low energy cut off at keV and with large, broad iron lines at keV. The source luminosities are also within the same range of erg/s (assuming a distance for IGR of 10 kpc).
It is, however, questionable if a He star with a strong stellar wind such as in Cyg X-3 could fit a system with an orbital period of 1.6 h. More likely, the system is an LMXB such as 4U ; the questions that immediately arise are where did the extreme absorption detected in the spectrum of IGR originate if not from the stellar wind of a massive companion, and is a low mass companion sufficient to produce the Fe line? One expects systems with such periods to be transient (King, Kolb & Burderi 1996) as the average mass transfer rate would probably be quite low. The ‘outburst’ accretion rate could nevertheless be high, thus, if the ADC interpretation is right, the true luminosity of the object is much higher than observed. It is just conceivable that this actually causes the intense absorption, if the accretion rate is highly super-Eddington for the duration of the outburst. This would produce a dense outflowing wind, as is probably seen in some of the Ultra Luminous X-ray sources (Fabbiano et al. 2003), which could give the absorption. Similar super-Eddington outflows, with extremely high columns, are seen in quasars inferred to be accreting at super-Eddington rates (Pounds et al. 2003; King & Pounds 2003). Sources like this or with even higher columns could easily have been missed by earlier satellites, so there could be a whole class of them.
Finally, we would like to note that if IGR is a LMXB, its orbital period would be in the range of those of the ms pulsar subclass, only five of which have been found. No ms pulsations were detected so far and unless the source becomes active again, current instrumentation does not afford ms pulsation searches. If on the other hand the 1.6 hr period is a neutron star spin period, the source is similar to 2S , which has a spin period of hr (Finley, Belloni & Cassinelli 1992) and an Fe line at 6.4 keV (Yamauchi et al. 1990); by analogy to other slow accreting pulsars we would expect the magnetic field of the neutron star in IGR to be of order Gauss.
References
- Arnaud (1996) Arnaud, K. 1996, in ASP Conf. Ser. 101, ADASS V, G. H. Jacoby & J. Barnes (eds), 5, 17
- Fabbiano et al. (2003) Fabbiano, G. et al. 2003, ApJ, 591, 843
- Finley (1992) Finley, J.P., Belloni, T. & Cassinelli, J.P. 1992, A&A Letters 262, 25
- King (1996) King, A.R., Kolb, U. & Burderi, L. 1996, ApJL, 464, 127
- King (2003) King, A.R. & Pounds, K. 2003, astro-ph/0305541
- Kouveliotou et al. (2003) Kouveliotou, C., et al. , 2003a IAU Circ. No. 8109
- Kouveliotou et al. (2003) Kouveliotou, C., et al. , 2003, ApJL, in preparation
- Lebrun et al. (2003) Lebrun, F. et al. 2003, A&A, in press
- Matt & Guainazzi (2003) Matt, G. & Guainazzi, M. 2003, MNRAS, 341, L13
- Milgrom (1976) Milgrom, M. 1976, A&A, 51, 215
- Parsignault, Grindlay, Gursky, & Tucker (1977) Parsignault, D. R., Grindlay, J., Gursky, H., & Tucker, W. 1977, ApJ, 218, 232
- Pounds (2003) Pounds, K. et al. 2003, astro-ph/0305571
- Revnivtsev et al. (2003a) Revnivtsev, M., et al. 2003a, IAU Circ. No. 8097
- Revnivtsev et al. (2003) Revnivtsev, M., Lutovinov, A., Ebisawa, K., 2003b, ATEL, 131
- Revnivtsev (2003) Revnivtsev, M., 2003c, astro-ph/0304353
- Rodriguez et al. (2003) Rodriguez, J., et al. 2003, astro-ph/0304139
- Ubertini et al. (2003) Ubertini, P. et al. 2003, A&A, in press
- Yamauchi (1990) Yamauchi, S., Asaoka, I., Kawada, M., Koyama, K. & Tawara, Y. 1990, PASJ Letters, 42, 53
- Wachter et al. . (2003) Wachter, S., et al. , 2003, ApJL, in preparation
- Winkler et al. (2003) Winkler, C. et al. 2003, A&A, in press