Star Formation and X-ray Emission in Distant Star Forming Galaxies11affiliation: Based in part on observations obtained at the W.M. Keck Observatory, which is operated jointly by the California Institute of Technology, the University of California, and the National Aeronautics and Space Administration.
Abstract
About 45% of the point sources detected in the 2 Ms Chandra exposure of the HDF-N can be matched with moderately bright galaxies with that have been studied by the Caltech Faint Galaxy Redshift Survey. Although the optical spectra of these galaxies appear normal, based on their X-ray properties 20% of them appear to contain weak AGNs. More than 90% of the X-ray photons detected by Chandra from galaxies within the redshift regime are powered by accretion onto massive black holes. For the sample of galaxies in common, we use their emitted luminosity in the 3727 Å line of [OII] to estimate their star formation rate (SFR). The X-ray emitting galaxies are not those with the highest rest frame equivalent width in this emission line, but rather are among those with the highest SFR. With SFR corrected for inclination effects, the distant galaxies show a – SFR relationship that is comparable to that of local galaxies. The HDF sample has a significantly higher median SFR and median SFR/galaxy stellar mass than does a sample of local star forming galaxies. We demonstrate that the observed SFR for most of the galaxies at in the HDF sample, if maintained as constant over their ages, suffices to produce the stellar mass observed in these galaxies. A rise in SFR at still earlier times is not required. We provide further evidence to support the conclusion that, once AGNs are eliminated, X-ray emission in these distant star forming galaxies is related to the SFR through the same physical mechanisms that prevail locally.
1 Introduction
The release of the point source catalogs for the 2 Ms exposure of the Chandra Deep Field-North by Alexander et al. (2003) represents a milestone for astronomy. The large collecting area combined with high spatial resolution of Chandra have, with this extremely long exposure time, achieved sufficient sensitivity to detect the population of distant normal galaxies. Much previous work on the optical counterparts to the Chandra detections in the region of the HDF, such as that of Barger et al. (2002) and Barger et al. (2003), has focused on the optically faintest counterparts of X-ray sources in efforts to find very distant galaxies, heavily obscured distant AGNs, etc. In this paper we address the origin of the X-ray emission from the Chandra sources with optical counterparts corresponding to “faint” field galaxies using material from the Caltech Faint Galaxy Redshift Survey (CFGRS), described in Cohen et al. (2000) and Cohen (2001).
The CFGRS was carried out in the region of the Hubble Deep Field-North (HDF) (Williams et al., 1996), which is included within the larger area of the CDF-N. Our redshift survey there achieves very high completeness to a deep limiting magnitude. The survey sample was selected based on the four-color optical and infrared photometric catalogs of Hogg et al. (2000) and covers the area within a diameter of 8 arcmin centered on the HDF. Objects were observed spectroscopically using LRIS at the 10-m Keck Telescope (Oke et al., 1995) irrespective of morphology to include all AGNs, QSOs and other possible extragalactic objects that might appear stellar. Our composite catalog for the region of the HDF contains 595 galaxies with and includes the published data from Phillips et al. (1997) (from the Lick Deep Group) and the work of the Caltech and of the Hawaii group published in Cohen et al. (1996) and subsequently to 1999, as well as five unpublished redshifts from C. Steidel. Our composite catalog contains redshifts for more than 93% of the sample to a limiting magnitude of in the HDF itself, and to in the Flanking Fields.
Of the 503 Chandra sources securely detected by Alexander et al. (2003), 149 are within the 8 arcmin diameter area covered by the CFGRS. We adopt a requirement that the X-ray and optical positions must match to within a tolerance of 1.5 arcsec based on the astrometric accuracy of the Chandra and the Hogg et al. (2000) catalogs. We then find that 67 of these X-ray point sources can be matched with galaxies with in this field.111One additional Chandra point source is matched with a Galactic M dwarf star, and one other is matched with a high redshift QSO in this field. Hence about 45% of the very deep X-ray detections reported by Alexander et al. (2003) arise from galaxies at intermediate redshifts which appear from their optical spectra to be normal. In the present paper we compare the X-ray emission detected by Chandra with the star formation rates inferred from the [OII] emission lines of these galaxies. As in earlier papers in this series, we adopt the cosmology H km s-1 Mpc-1, , . Over the redshift interval of most interest, a flat universe with and a Hubble constant of H km s-1 Mpc-1 gives galaxy luminosities very close to those used below.
2 Eliminating AGNs from the Sample
The mechanisms giving rise to the X-ray emission of local star forming galaxies, reviewed by Fabbiano (1989), are a composite of emission from the ISM, from stellar sources (predominantly X-ray binaries), from supernova remnants, and possibly from a nuclear AGN. With the aid of Chandra’s high spatial resolution, separation of these components in nearby galaxies becomes feasible, see e.g. Zezas & Fabbiano (2002) for the Antennae galaxy. In nearby galaxies with high current SFR, X-ray binaries provide about half of the flux in the full Chandra band. The hot components of the ISM, which contribute most of the remaining flux, can also be studied in detail with Chandra. The superbubbles, whose evolution was followed by Tenorio-Tagle et al. (1999), can be resolved, and galactic winds can be detected and the metallicity of the gas within them determined, e.g. Martin, Kobulnicky & Heckman (2002). In addition, the sensitivity of XMM permits detection of a complex array of lines and precision spectral fitting for X-ray bright nearby galaxies such as M82 (Read & Stevens, 2002). While Hornscheimeier et al. (2003) have detected off-nuclear luminous X-ray sources in galaxies to in the HDF, none of this richness can be achieved at present for the distant galaxies in our sample.
The variation of the X-ray emission from nuclear sources, particularly given the low spatial resolution of early X-ray images, can be explained by either the XRB or the AGN hypothesis. (See, for example, Ptak & Griffiths, 1999, for M982.) For M51, however, the detection of optical emission lines characteristic of a central weak low luminosity AGN by Ho, Filippenko & Sargent (1997) is definitive proof that weak AGNs may be present even in these heavily star forming galaxies; they find such weak AGN in a high fraction of local galaxies. But the nucleus of M51 contributes only 12% of its total full band Chandra luminosity; the bulk of its X-ray emission comes from the extended and stellar sources (Terashima & Wilson, 2001).
We consider here only those galaxies in the region of the HDF whose optical spectra show signs of moderate to strong current star formation, i.e. galaxies with easily detected optical emission lines. These have been assigned galaxy spectral classes in the CFGRS catalog using the definition of Cohen et al. (1999) of (moderately strong emission lines with detectable absorption lines as well) and (very strong emission lines). Two broad lined AGNs have been culled out of the sample of 595 galaxies; both of these have very high X-ray luminosities from the Chandra data. However, elimination of narrow-lined AGN based solely on their optical spectra is difficult as, for the higher redshift galaxies considered here, none of the key diagnostic features fall within the wavelength coverage of the available optical spectra. Furthermore, the light of any nuclear AGN will be diluted in such distant galaxies by the large metric aperture used for ground based spectroscopic observations (Moran, Filippenko & Chornock, 2002).
In the local Universe, the mass of a nuclear AGN (i.e. a black hole) depends primarily on the mass of the stellar bulge component of the host galaxy (Ferrarese & Merritt, 2000). The luminosity of the star forming galaxies in the HDF is, for a given star formation rate (SFR), in the mean considerably higher than that for local star forming galaxies (Cowie et al., 1996; Cohen, 2001). Furthermore, at high redshift, there may be more gas to power the central source. Hence we may expect the impact of contributions from AGNs to be more important in the HDF than in local samples.
There is a well established relationship between the far-IR luminosity and the radio luminosity (see, e.g. Condon, 1992) among local star forming galaxies, whose origin was discussed by Bell (2003). Garrett (2002) explored this relation at moderate redshifts by comparing the far-IR (from ISO) and radio emission of 20 galaxies from the CFGRS in the HDF with a local sample. He found that the correlation between far-IR and radio emission established in local star forming galaxies continues to apply out to . Deviations of excess radio luminosity from such a well defined relationship presumably imply the presence of an AGN. However, the far-IR data in the region of the HDF (from ISO, Aussel et al., 1999) are quite limited both in depth and in size of field and are insufficient for our purposes. Until SIRTF data are in hand, we cannot use this approach to test for AGNs.
To shed light on the possible presence of AGNs in our HDF samples, we build upon the work of Grimm, Gilfanov & Sunyaev (2003), who studied a small sample of galaxies in the HDF with both radio and Chandra observations and with redshifts from the CFGRS. They too suggested that the local relations apply to their HDF sample. We therefore construct the set of objects which are included in each of the Chandra point source catalog, the CFGRS (for redshifts), and the VLA database for the HDF of Richards et al. (1998) and Richards (2000). As one step towards eliminating AGNs, we omit all sources where the Chandra spectral index is negative (i.e. very hard sources). Galaxies which are in close pairs of comparable luminosity in the CFGRS were included only if it was clear to which component the Chandra detection should be assigned. If not, such galaxies were ignored. Eleven galaxies meet these criteria. These galaxies are indicated in Table 3, and some median properties of the sample are given in Table 4.
Both the X-ray and the radio emission arising from star forming galaxies are essentially free of reddening effects, and hence should be tightly coupled. Figure 1 shows the resulting (1.4Ghz) versus for the 11 sources in common. A -correction for the radio has been used since all but one of the galaxies have measured radio spectral indices, but none was used in calculating the X-ray luminosity. Power law SEDs, in the form of , have -corrections for luminosities of . For a slope between 1 and 2, typical of these X-ray sources, the -correction has a total range from 0.0 to 0.3 dex for to .
Most of the points define a tight line, as expected, but two of them, F36422_1545222Galaxy names are based on the J2000 coordinates of the object; 12 12 34.5 +62 56 43 is identified as F12345_5643. and F36517_1220, lie significantly above it. Luminous discrete non-nuclear X-ray sources, also known as ULX sources, found in local galaxies are reviewed by Makishima et al. (2000); the most luminous of these reach W in M51 (Terashima & Wilson, 2001). These two HDF galaxies have luminosities far higher than any local ULX, and presumably contain luminous AGNs. The redshift of F36422_1545 is , so the region of H is too far to the red to be accessible. The more modest redshift of F36517_1220 () permits an examination of the rest frame 5000 Å region, although H is inaccessible. This means that the conventional AGN diagnostics used in optical spectroscopy of Baldwin, Phillips & Terlevich (1981) and Veilleux & Osterbrock (1987) are out of reach. Judging by the more limited test of line strength ratios, avoiding the H region, introduced by Rola, Terlevich & Terlevich (1997), F36517_1220 is a normal star forming galaxy. Reconciliation of these conflicting claims is possible with the conjecture of Moran, Filippenko & Chornock (2002) regarding the importance of aperture effects on the detection of AGN at high redshift from optical spectra.
Figure 2 shows the full-band Chandra counts as a function of the galaxy redshift for the sample of star forming galaxies in the region of the HDF of this paper. A detailed description of the sample selection will be given in §4. We ascribe the sprinkling of galaxies along the bottom of this figure to X-ray emission associated with normal star formation. The two suspected AGNs isolated from Figure 1 are circled, and among the most discrepant galaxies in Figure 2. There are two galaxies in our sample with full band Chandra detections which exceed 1000, while the two broad lined AGN that were eliminated from the sample have full band Chandra detections in excess of 2000 counts.
If we assume that all galaxies with full band Chandra counts in excess of 100 contain a AGN, then there are two broad lined and 8 narrow lined AGN in our sample, of which only the two broad lined galaxies were picked out from their optical spectra as AGNs. The fraction of the total Chandra detected flux originating from accretion onto a massive black hole is 93%. The much more numerous normal star forming galaxies contribute very little to the total X-ray luminosity density.
There are, in addition, 5 to 6 additional galaxies in this sample of 38 which are clearly discrepant, with excess X-ray flux, though their optical spectra appear normal. Only one of these 6 galaxies has a radio detection. These too presumably have weak AGN nuclei.
To within the small number statistics of the present sample, we therefore assert that about 20% of the spectroscopically normal high luminosity star forming galaxies in the HDF have nuclear AGNs which contribute substantially to their total X-ray fluxes. Huchra & Burg (1992) gives the frequency of Seyfert I and Seyfert II galaxies in the CfA Redshift Survey of the local Universe, while Ho, Filippenko & Sargent (1997) have done so for AGNs reaching to much lower luminosities. Both the AGN luminosity and the very rough AGN fraction derived above for our sample lie in between these local determinations. Kobulnicky et al. (2003) find that 15% of their sample of 66 star-forming galaxies with in the Groth strip are probably narrow lined AGNs.
, radio), and FIR) are to first order independent of internal reddening within the galaxy, and hence these correlations, including that shown in Figure 1 for a sample of galaxies in the region of the HDF, have quite small dispersions, both among local galaxies and in the HDF using the CFGRS database, ignoring the obvious occasional outliers, which we presume to be AGN. The underlying variable driving these correlations is widely assumed to be the SFR.
3 The Sample of Local Calibrators
We first create a sample of local star forming/starburst galaxies for comparison with our sample of much more distant galaxies in the region of the HDF. Their properties, and the references from which their X-ray luminosities and H fluxes were taken, are given in Table 1. We have modified the published data to correspond km s-1 Mpc-1 and have removed the Galactic extinction using the maps of Schlegel, Finkbeiner & Davis (1998) when necessary. We correct the SFR for inclination effects; the result is denoted SFRi. We take axis ratios for our sample of local calibrators from the 2MASS Large Galaxy Atlas (Jarrett et al., 2003), or, if necessary, measure them from NED images. We apply a correction of the form (mag) = , and adopt (H) = 1.3 (Tully et al., 1998). This does not remove the reddening experienced by a face-on disk galaxy.
We have also applied small corrections to total galaxy X-ray fluxes taken from the catalog of galaxy observations with the Einstein satellite of Fabbiano, Kim & Trinchieri (1992), given over the regime 0.2 – 4.0 keV, to cover the Chandra full bandpass. The observed fluxes in the optical emission lines for these local galaxies have in most cases been measured through apertures large enough to encompass the entire galaxy, except for the data taken from Calzetti et al. (1995). Substantial aperture corrections for this data set are required and were calculated using images from NED under the assumption that the spatial distribution of the flux in the emission line is the same as that of a nearby broad band continuum-dominated filter. The H fluxes from Calzetti et al. (1995) as published are corrected for the internal reddening of the galaxy, and this was backed out prior to use.
Our local sample of star forming galaxies was selected based on our ability to locate the required observational material in the literature. Few surveys of large aperture observations of nearby galaxies in the optical emission lines are available. We began with the sample of Bell & Kennicutt (2001), and tried to locate the requisite X-ray emission for the galaxies in their sample with substantial SFR. A special effort had to be made to find suitable local galaxies with high SFR; such galaxies are rare in the local Universe. The two local galaxies with the highest SFR are at distances of 56 and 78 Mpc, while all the others have Mpc, and 9 of the 14 have Mpc. Kauffmann et al. (2003) have analyzed a large sample of galaxies from the SDSS and find that the percent of local galaxies with signs of a recent or ongoing starburst decreases rapidly as the luminosity increases, so our difficulty in finding luminous local galaxies with high SFR is not surprising.
These local galaxies, with H used as the diagnostic for star formation, are indicated by large filled circles in Figure 3; for , they are indicated by stars. A least squares linear fit to the 14 points is shown by the thick line, and has the form log([SFRi(H)], with about this fit of 0.31 dex. The scatter would be noticeably larger if the inclination corrections were not used. Several smaller sources contribute to the remaining scatter in the relation between and SFRi(H). They include the small corrections applied to intercompare observations made with three different X-ray telescopes (Chandra, ASCA and Einstein), ignoring the X-ray k-corrections and, most importantly, ignoring reddening differences from galaxy to galaxy within the local sample after being corrected to face-on. Table 2 gives an estimate of the contribution of each of these terms to the observed . In addition, at the lowest for these nearby galaxies, the number of detected discrete non-nuclear X-ray sources, presumably various types of luminous X-ray binaries, which may contribute an amount equal to the extended emission, becomes fairly small, and Poisson statistics may become important.
We are using the 3727 Å emission line of [OII] as our diagnostic of SFR for our sample of distant galaxies in the region of the HDF. However, among local galaxies there are fewer measurements of the observed integrated flux in the 3727 Å emission line of [OII] than there are for H. This is presumably because the [OII] emission line is less dominant in its spectral region than is H. Also the adjacent continuum is chopped up by strong absorption features there, hence narrow band imaging is not feasible.
The major surveys for the strength of the the 3727 Å emission line of [OII] among local galaxies are those of Gallagher, Bushouse & Hunter (1989) and Kennicutt (1992). Substantial aperture corrections are required for the former, while for the latter, the [OII] observed line fluxes are given with respect to the observed H flux. We were able to locate suitable measurements for only five of the galaxies in the local sample, all from Kennicutt (1992). The resulting deduced SFRi values, using the calibration of Kennicutt (1998), are shown in Figure 3 as open circles. Thin horizontal lines connect the H and [OII] SFRs. This offset in SFRi represents mainly the difference between (H) and (3727), where ) is the total absorption for the integrated light of each of the calibrating galaxies (corrected to face-on).
Reddening curves for galaxies are quite controversial (Calzetti, 1999), but most of the disagreement lies within the rest-frame UV, which we do not use. We therefore adopt of Schlegel, Finkbeiner & Davis (1998), so mag. The differential extinction appears small for three of the galaxies, and much larger for NGC 3034 and NGC 5194. The dashed line is the fit to H translated by dex in log(SFRi) so as to fit through the values of these last two galaxies, which are among the more reddened of the local calibrators. Note that mag corresponds to a total reddening for a face-on galaxy of = 0.8 mag. This is not unreasonable for star forming galaxies; the references quoted in Table 1 often ascribe to 1.5 mag (equivalent to to 0.6 mag) to the individual galaxies or the sample of galaxies studied in each case; see also Kennicutt (1983) and Cohen (2001).
There are many more surveys of emission lines in local star forming galaxies using small apertures, which concentrate on the galactic nucleus, e.g. McQuade, Calzetti & Kinney (1995) and Storchi-Bergmann, Kinney & Challis (1995). We, however, rely on total line fluxes, and these observations in general cover too small a fraction of the galaxy as a whole to be useful here. Rosa-Gonzalez, Terlevich & Terlevich (2002) have assembled small aperture emission line fluxes for a set of 31 nearby star forming galaxies, combined them with FIR fluxes from IRAS, and intercompared the results of applying the various diagnostics. With respect to SFR(FIR) which measures the total SFR, they find, with no extinction or inclination corrections, SFR(FIR) = 3.4 SFR(H), with a large scatter (equivalent to dex) and SFR(FIR) = 6.0 SFR(3727), with a dispersion equivalent to dex. Because we are using inclination corrections, our dispersions should be and are somewhat smaller. We will compare these relations to those we use later.
4 The Rate of Star Formation Versus X-Ray Flux in the HDF
As reviewed by Kennicutt (1998), there are many diagnostics that can be used to infer star formation rates, ranging from continuum emission in the UV, the far-IR and the radio to recombination and forbidden emission line strengths. The systematic errors induced by dust in several of these relations were discussed by Bell (2002), while Buat et al. (2002) discusses some of the problems associated with dust extinction in the UV and the use of UV fluxes, commonly used for galaxies with , where the rest frame UV is redshifted into the optical band.
Given the wavelength coverage of the optical spectra from the CFGRS and the range of redshift under consideration, the SFR for the distant galaxies in our sample in the region of the HDF can only be determined via the flux in the 3727 Å emission line of [OII], which is one of the less robust of these diagnostics. The strength of emission in this line is affected not only by dust but also potentially by variation of O excitation and the O abundance among the galaxies. The latter has been explored for local galaxies by Jansen, Franx & Fabricant (2001) and at intermediate redshifts by Cardiel et al. (2003). All of these diagnostics are affected, each weighting a slightly different mass range, by the value of the initial mass function.
We measure the equivalent width in the 3727 Å doublet, which is not generally resolved in these spectra, in the observed frame, then transform that to the rest frame. SED parameters defined by the SED model of Cohen (2001) have been determined by Cohen (2001) for each of these galaxies from multi-color broad band photometry extending from U to K. These are used to interpolate within the set of observed broad band colors, yielding the continuum flux at rest frame 3727 Å. Since the redshifts are known, the observed fluxes in the emission line are transformed into emitted luminosity in this emission line for each galaxy in the sample. We are forced to do this as the LRIS spectra are not fluxed; multi-slit spectra cannot in general be fluxed due to differential slit losses between objects observed depending on the accuracy of the slitmask alignment and of the astrometry used to design the slitmasks. The adopted method of calculating the rest frame equivalent width of an emission line assumes either that the line emission more or less follows the same spatial distribution as the background light of the galaxy, or that the 1 arcsec wide slit used for the spectroscopy includes most of the total light of the galaxy. The latter is a reasonable assumption at the upper end of this redshift range; at , 1 arcsec corresponds to 7.3 kpc; the full size of the galaxy is sampled in the direction of the length of the slit.
The SFR is computed from the emitted flux in the [OII] line using the calibration of Kennicutt (1998). No corrections for internal extinction within the galaxies are made. The Galactic extinction in the direction of the HDF is very small and is ignored here. We do, however, correct for inclination of the galaxies, which does not remove the reddening experienced by a face-on disk galaxy. We measured rough axis ratios from the images of the Flanking Field galaxies obtained by the GOODS project (Giavalisco et al., 2003), and used the original HDF images for those galaxies within the HDF itself. Images taken in the F814W filter, the reddest used in both these HST surveys, were utilized when available. In a few cases, no HST image that was deep enough to indicate the shape of the outer isophotes of the galaxy could be located; no inclination correction was applied in such cases. We apply a correction of the form (mag) = . We assume mag, extrapolated from the work of Tully et al. (1998); this may be an underestimate of , which is rarely determined at wavelengths bluer than B. The SFR thus determined is denoted SFRi(3727).
There are two galaxies in the HDF sample with for which the equivalent width of H is available from the CFGRS spectra. These, corrected for the inclusion of [NII] in the blend and for inclination effects as described above, yield SFRi(H) in reasonable agreement with SFRi(3727). These galaxies both are of low luminosity; the volume of the cone of the CFGRS redshift survey at such low is small. One of these is the object with the lowest star formation in this HDF sample, F36332_1134. The diagnostic ratio of Veilleux & Osterbrock (1987) indicates that light from HII regions dominates the optical emission lines.
The X-ray luminosity is taken directly from Alexander et al. (2003); the observed flux over the full Chandra bandpass is transformed into an emitted flux. Many of these sources are quite weak (see Figure 2 and in some cases the X-ray spectral index could not be determined from the Chandra data. In a few cases, Alexander et al. (2003) tabulate only an upper limit to the total flux over the full Chandra band, presumably because of non-detection of the weakest sources in the higher frequency part of the Chandra bandpass. We therefore ignore any -correction to the X-ray luminosity.
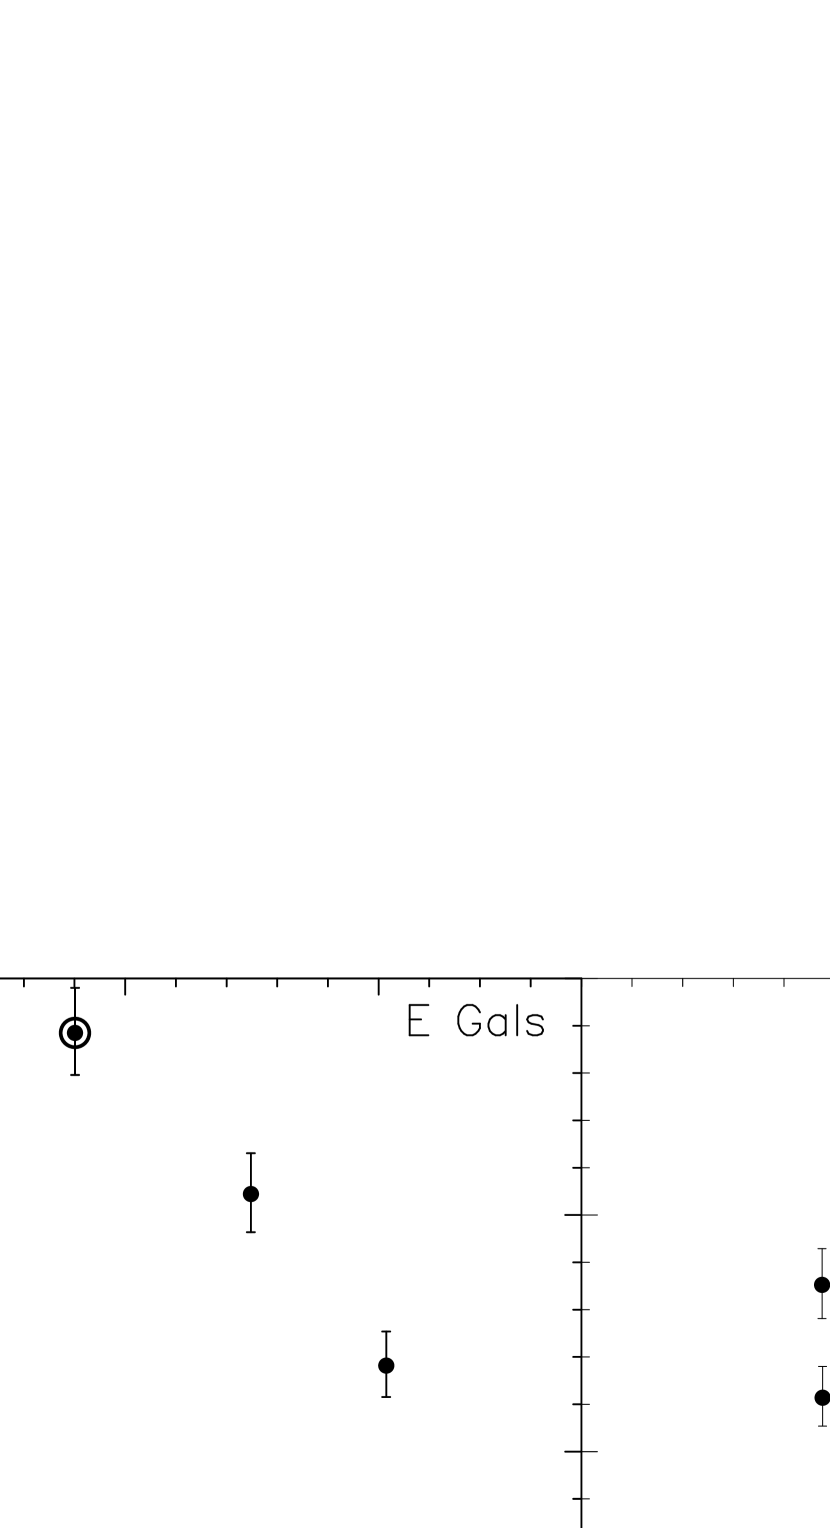
The resulting parameters for each galaxy in the CFGRS matched to within 1.5 arcsec to a Chandra point source and which shows evidence of strong current star formation from its optical spectrum are listed in Table 3 and displayed in Figure 4. The final sample contains 22 galaxies and 16 galaxies in the region of the HDF. The median redshifts are for the latter and for the latter; galaxies are harder to identify at high redshift (Cohen et al., 2000). The two galaxies that are discrepant in Figure 1 and suspected of harboring AGNs are marked in Figure 4, as are the suspected AGNs isolated from Figure 2.
The range of SFRi at a fixed in Figure 4 is large, and is noticeably larger if the inclination corrections are not used, while the uncertainties in the values of are small. The differences in internal extinction from galaxy to galaxy after being corrected to face-on is the dominant contributor to the scatter in Figure 4. The effect of ignoring the X-ray k-correction is relatively small. The uncertainties in the 3727 Å equivalent width measurements, given in Table 3, are in general small. The conversion to an emitted line flux may introduce errors at the 30% level (Cohen, 2001). The effect on the SFRi derived from the observed luminosity in the 3727 Å emission line of an increase in the internal extinction within a galaxy of mag is indicated by the horizontal arrow at the lower right of the left panel of Figure 4. Table 2 summarizes the expected sources of uncertainty and the contributions of each. Their sum, in quadrature, is in good agreement with the dispersion seen in Figure 4 of SFRi(3727) for a given . This table offers a sobering reminder of why SFRi(H) is a more robust indicator of SFR than is SFRi(3727), but our options are limited.
Overall, aside from the suspected AGN, the HDF galaxies display a relationship between and SFRi in Figure 4 which is highly reminiscent of that of the local calibrators, with larger scatter. The only major outlier among the galaxies in the right panel is a galaxy without an inclination correction. The galaxies, shown in the left panel, now show a tight relationship at low . At the highest X-ray luminosities, the scatter is somewhat larger, while the three most luminous among the galaxies, and the 5 most luminous among the galaxies are all suspected AGN. It should also be noted that two of these galaxies with above that of the suspected AGN and with similar SFR, F36348_1628 and F36246_1111, are not detected in the VLA radio surveys of Richards et al. (1998) and Richards (2000). Since they are both more distant than the suspected AGN, that does not contradict the strong suggestion from Figure 2 that these are AGN.
Table 4 lists the median properties of the samples in the region of the HDF as well as those of the local comparison galaxies. The second largest value for a given parameter among the galaxies in a particular sample is listed in Table 5. (We ignore the highest value to avoid outliers.) The SFRi(3727) and SFRi(H) are given for a face-on galaxy with no extinction correction.
If we wish to determine the total SFR, we need to evaluate , the differential absorption between H and 3727 Å and also (H). For the reddening curve adopted here, the former is given by mag, with , and almost certainly mag. The second factor is given by 2.67. Then SFR(total) = (H)SFRi(H) or (H)SFRi(3727). If we assume a typical of 1.5 mag for star forming galaxies, then SFR(total) = 2.7 SFRi(H) = 9.0 SFRi(3727). Recognizing their uncertainty is large, we adopt these values hereafter as typical for both the local and the HDF samples. The comparable relations obtained for 31 local galaxies by Rosa-Gonzalez, Terlevich & Terlevich (2002) have constants within 30% of those given above when either H or the 3727 Å emission line of [OII] is used as the SFR diagnostic.
5 Comparison of the SFR Between the HDF and Local Samples
We have used the rest frame luminosity to infer the mass of each galaxy. We follow the procedure of Cohen (2001), where the SED parameters for each of the HDF galaxies are determined to deduce their rest frame luminosity, a procedure identical in principle to that described in §4 and used to determine the continuum flux at rest frame 3727 Å. These are the stellar masses; gas is not included. Masses have been deduced for each of the local calibrators using their integrated flux from 2MASS (Skrutskie et al., 1997). The median mass of the local sample is ⊙, comparable to that of the galaxies in the HDF, while that of the galaxies is times larger. As the range of galaxy masses is large, we compare the values of SFR⊙ for the HDF and for the local sample. These, plotted as a function of mass, are shown in Figures 6 and 5 respectively, while the medians and the second highest values are given in Tables 4 and Table 5. Recall that for the local sample we use SFRi(H) while for the HDF sample we use SFRi(3727).
The parameter SFR⊙ spans a range of a factor of for the HDF sample, which we regard as an indication of the rather broad galaxy spectral types used here, the lack of any luminosity indicator in the optical spectra, and our inability to differentiate galaxies from galaxies at . The galaxy with the highest SFRi/10⊙ shown in Figure 6 is the highest redshift galaxy in our HDF sample, with . Its spectrum has been checked; the [OII] line strength and its errors appear valid. This galaxy is not discrepant in the – SFR relationship of Figure 4. It appears to be a genuine case of a high redshift galaxy with a very high SFR for its mass.
With no correction for reddening, Table 4 shows that the median SFR⊙ for the galaxies in the HDF is 2.6 times larger than that of the local galaxies, while that for the galaxies is larger by a factor of 1.9. Thus, irrespective of the exact value of the two correction factors discussed above, the total SFR for the HDF galaxies is considerably larger than that of local galaxies. We adopt the nominal correction factors given above, with the additional support provided by the rough agreement with the local sample of Rosa-Gonzalez, Terlevich & Terlevich (2002). The median total SFR is then 7 times larger in the HDF sample than that of the local galaxies. The median SFR per unit mass, SFR⊙, a measure of the efficiency of SFR, for the HDF is times that for the local sample with no extinction corrections. Applying the nominal extinction corrections suggests that the median SFR per unit mass is 5 times higher in the HDF.
We reject the suggestion that these differences arise from sample selection, such that only galaxies with very high SFR can be detected at high redshift. Sample selection in the form of incompleteness of the CFGRS is not believed to be a serious concern here. We see many galaxies in the HDF with lower SFR (see Figure 9) than those in the Chandra sample, at least for . In this context, we note that the CFGRS could have detected emission in the 3727 Å line at least 5 times smaller than that observed for F36527_1355 at .
In local galaxies, a simple Schmidt (1959) power law accurately relates a galaxy’s total SFR to its disk-averaged gas surface density. However, we do not know the gas density in these systems, and information on possible mergers is not available either, so we cannot attempt to isolate the additional factors beyond total stellar mass that undoubtedly influence the SFR in a particular galaxy.
In spite of these concerns, the similar form of the relationship between , SFRi, (radio) and (FIR) in HDF samples of varying sizes, once cleaned of AGNs and taking reddening into consideration (for SFR only), presented here, by Grimm, Gilfanov & Sunyaev (2003), and by Garrett (2002) suggest that the physical mechanism for star formation is similar among all the galaxies discussed here, and it is operating in more or less the same way, but galaxies of higher mass dominate the star formation in the HDF, while lower mass galaxies dominate the star formation locally, as was already pointed out by Cowie et al. (1996) and others.
5.1 Constraints os the SFR At Still Higher Redshift
We consider whether the present SFR in each galaxy in the HDF sample is consistent with its age as inferred from its redshift , or whether the time averaged SFR had to be even higher in the past to have formed the observed mass of stars. This provides a window into the behavior of SFR with (Madau, Pozzetti & Dickinson, 1998) in a redshift regime where observations are more difficult. Figure 7 shows SFRi(3727) for the HDF sample as a function of galaxy mass. The solid line indicates the accumulated stellar mass of a galaxy after 6 yr (the age of a galaxy) for a SFR constant with time. If a galaxy is located to the right of the line, there has been insufficient time to produce the observed stellar content of the galaxy assuming SFR constant with time. In such a case, the time averaged SFR must have been higher in the past (i.e. presumably at between 1 and 2, as the total age at is very small, 1 Gyr).
The symbol size in this figure increases with redshift, so we check whether the galaxies with are systematically to the right of the line. The galaxies are distributed fairly close to this line, while the galaxies tend to be to the right of it. Their median redshift is half that of the galaxies (Table 4), but the dashed line in the right panel of the figure indicates the mass expected for constant SFR and an age of 9 Gyr; the galaxies still tend to lie to the right of that.
For the galaxies in the HDF, only one high redshift galaxy appears to be more than a factor of three from the line. This case, and the smaller offsets to the right of the line of the other galaxies, can easily be accommodated by the factors and (H), both assumed to be unity here, as well as by a few missing inclination corrections. So there is no need for a substantially higher SFR at to produce the stars seen in galaxies at . The current SFR at is consistent with the time averaged SFR for for the galaxies. It is possible, but not demonstrated here, that the absorption corrections H can also produce consistency for the galaxies without requiring a higher time averaged SFR in the past. Further tests of this once more data become available will be interesting.
6 The Origin of the X-Ray Emission from These Galaxies
We now consider which star forming galaxies within the HDF show X-ray emission. Cohen (2003) presents rest frame equivalent widths for the 3727 Å emission line of [OII] in a sample of 256 galaxies from the CFGRS in the region of the HDF. Figure 8 shows these as a function of redshift, with the X-ray luminous objects of the present sample indicated by larger symbols. We see that the X-ray luminous objects are not in general those galaxies at a given with the largest equivalent widths, but are mixed through the entire range of equivalent width, with a concentration towards the lower values. However, the equivalent width is not a measure of the emitted luminosity in the line. When we plot instead the emitted luminosity in the [OII] emission line at 3727 Å (see Figure 9) versus redshift, the situation is somewhat clearer. The X-ray luminous galaxies are among the most luminous in the full HDF sample of the CFGRS in this emission line, i.e. they have among the highest SFR at each , but having a very high SFR does not guarantee that a galaxy will be detected in the Chandra images. We cannot at present isolate the additional factors beyond the mass of a galaxy that might influence its SFR at .
However, Figure 2 offers some possible clues. We suggest that the small number of discrepant galaxies in this figure all have weak nuclear AGNs. We suggest that the normal star forming galaxies are those sprinkled along the bottom of this figure. These all have very low full-band Chandra counts, almost all less than 20 full-band counts. This is right at the detection limit of even the 2 Ms Chandra image (Alexander et al., 2003). The small variations in inclination angle and reddening mean that those galaxies with the maximum detected 3727 Å line flux at any given redshift (i.e. the upper envelope of the distribution in Figure 9) can only suggest, but not define, the set of galaxies with the highest total SFR. The lack of Chandra detection of galaxies apparently with slightly higher or comparable SFR to those detected becomes a matter of chance, the inclination or the reddening. The spatial position of the galaxy within the Chandra field, in particular its distance from the center of the Chandra field (where detection limits are higher), may also play a role. With this hypothesis to explain why some star forming galaxies we would expect to have been detected by Chandra are not, the relation among the star forming galaxies in the region of the HDF becomes indistinguishable from that of local galaxies, and .
7 Summary
There have been many efforts to determine the SFR at high redshift. The evolution with redshift of the rest frame UV luminosity density was used by, among others, Lilly et al. (1996), Cohen (2002) and Wilson et al. (2002) to study the evolution of the SFR with , while Hogg et al. (1998) used the evolution of the [OII] luminosity density for the same purpose. All agree on a strong increase in these SFR diagnostics between the local Universe and . In the present analysis we see this manifested through the emission line strengths of individual galaxies; the very high emitted luminosity in the 3727 Å line of [OII] and the inferred SFR found among the most extreme galaxies in the HDF sample (see Tables 3 and 4) surpass anything seen in the local Universe. The enhancement in SFR/unit galaxy mass is also substantial.
A comparison of the X-ray, radio and optical data suggests (Figures 1 and 2), in agreement with evidence from other surveys, that 20% of the X-ray sources contain weak AGNs, even though these galaxies (ignoring the two broad lined AGNs that have been deleted from the HDF sample) appear from optical spectra of their integrated light to be “normal”. Aperture effects appear to limit our ability to detect AGN from such spectra in high redshift samples as suggested by Moran, Filippenko & Chornock (2002). These AGN produce more than 90% of the detected Chandra flux arising from objects in the redshift regime .
Because we are using the 3727 Å emission line of [OII] as our diagnostic of SFR, reddening is a serious concern, and we found that the introduction of inclination corrections significantly reduced the scatter in the relation. This is the first detection to our knowledge of inclination effects in such distant galaxies. It is very likely that inclination effects also contribute to the distribution of SEDs among distant star forming galaxies. They probably cause a significant part of the spread observed in the SED parameters and (sBB) determined by Cohen (2001) for the set of and for the set galaxies in the region of the HDF.
Once the reddening corrections are incorporated and the AGNs eliminated, we suggest that the relation for these distant galaxies is essentially identical to that prevailing in local star forming galaxies. The -radio relation, presented here and, for a smaller sample, by Grimm, Gilfanov & Sunyaev (2003), and the relation of Garrett (2002) for the HDF all agree with those of local star forming galaxies. This suggests that the physical mechanisms responsible for X-ray emission in these distant galaxies are the same as those that act locally.
High observed flux in the 3727 Å line of [OII] is a necessary but not a sufficient condition for detection by Chandra. The issue of which particular galaxies are detected by Chandra is resolved by realizing that the normal star forming galaxies in our sample lie essentially at or only slightly above the Chandra detection limit. Inclination, reddening, etc which affect the transformation from [OII] emission line flux to total SFR can lead to a particular galaxy being detected by Chandra, whereas another with similar SFRi(3727) at the same redshift may not be detected.
Many optical surveys of distant galaxies are underway which plan to use 3727 Å emission as a diagnostic for SFR and for metallicity. In qualitative terms, if the problems of internal reddening and potential AGN contribution can be handled, the emitted luminosity in the 3727 Å emission line does appear to be a reasonable indicator of the SFR among these distant galaxies, but this work illustrates the difficulties associated with this emission line, where reddening is such a serious concern.
Once larger samples of distant galaxies with high precision multi-wavelength data permitting the use of multiple diagnostics for their star formation rates become available, one might be able to explore the issue of the constancy of the initial mass function between the local and the distant Universe. The comparison we have carried out of the expected stellar mass assuming constant SFR with the actual galaxy stellar mass at suggests that no further rise in time averaged SFR is necessary at earlier times. Extending this to a larger sample with better data will be of considerable interest as it probes the time averaged SFR at a key epoch of the formation of galaxies.
References
- Alexander et al. (2003) Alexander, D. M. et al., 2003, ApJ (in press) (Astro-ph/0304392)
- Aussel et al. (1999) Aussel, H., Cesarsky, C.J., Elbaz, D. & Starck, J.L., A&A, 342, 313
- Baldwin, Phillips & Terlevich (1981) Baldwin, J. A., Phillips, M. M. & Terlevich, R., 1981, PASP, 93, 5
- Barger et al. (2002) Barger, A. J., Cowie, L. L., Brandt, W. N., Capak, P., Garmire, G. P. Hornschemeier, A. E., Steffen, A. T. & Wehner, E. H., 2002, AJ, 124, 1839
- Barger et al. (2003) Barger, A. J., Cowie, L. L., Capak, P., Alexander, D. M., Bauer, F. E., Brandt, W. N., Garmire, G. P. & Hornschemeier, A. E., 2003, ApJ, 584, L61
- Bell & Kennicutt (2001) Bell, E. C. & Kennicutt Jr., R., 2001, ApJ, 548, 681
- Bell (2002) Bell, E. F., 2002, ApJ, 577, 150
- Bell (2003) Bell, E. F., 2003, ApJ, 586, 794
- Buat et al. (2002) Buat, V., Boselli, A., Gavazzi,G. & Bonfanti, C., 2002, A&A, 383, 801
- Calzetti et al. (1994) Calzetti, D. 1994, ApJ, 429, 582
- Calzetti et al. (1995) Calzetti, D. 1995, ApJ, 443, 136
- Calzetti (1999) Calzetti, D., 1999, Astrophysics and Space Science, 266, 243
- Cardiel et al. (2003) Cardiel, N., Elbaz, D., Schiavon, R. P., Willmer, C. N. A., Koo, D. C., Phillips, A. C. & Gallege, J., 2003, ApJ, 584, 76
- Cohen et al. (1996) Cohen, J. G., Cowie, L. L., Hogg, D. W., Songaila, A., Blandford, R., Hu, E. M., & Shopbell, P., 1996, ApJ, 471, L5 (C96)
- Cohen et al. (1999) Cohen, J. G., Hogg, D. W., Pahre, M. A., Blandford, R., Shopbell, P. L. & Richberg, K., 1999, ApJS, 120, 171
- Cohen et al. (2000) Cohen, J. G., Hogg, D. W., Songaila, A., Blandford, R., Cowie, L. L., Hu, E. M., Shopbell, P. & Richberg, K., 2000, ApJ, 538, 29
- Cohen (2001) Cohen, J. G., 2001, AJ, 121, 2895
- Cohen (2002) Cohen, J. G., 2002, ApJ, 567, 672
- Cohen (2003) Cohen, J. G., 2003, to be published in Galaxy Evolution: Theory and Observations, ed. V. Avila-Reese, C.Firmani, C.Frenk & C. Allen, RevMexAASC
- Condon (1992) Condon, J. J., 1992, ARA&A, 30, 575
- Cowie et al. (1996) Cowie, L. L., Songaila, A., Hu, E. M. & Cohen, J. G., 1996, AJ, 112, 839
- Fabbiano (1989) Fabbiano, G., 1989, ARA&A, 27, 139
- Fabbiano, Kim & Trinchieri (1992) Fabbiano, G., Kim, D.-W. & Trinchieri, G., 1992, ApJS, 80, 531
- Fabbiano, Zezas & Murray (2001) Fabbiano, G., Zezas, A. & Murray, S. S., 2001, ApJ, 554, 1035
- Ferrarese & Merritt (2000) Ferrarese, L. & Merritt, D., 2000, ApJ, 539, L9
- Gallagher, Bushouse & Hunter (1989) Gallagher, J. S., Bushouse, H. & Hunder, D. A., 1989, AJ, 97 700
- Garrett (2002) Garrett, M. A., 2002, A&A, 384, L19
- Giavalisco et al. (2003) Giavalisco, M. et al., 2003, ApJ, submitted
- Grimm, Gilfanov & Sunyaev (2003) Grimm, H. J., Gilfanov, M. & Sunyaev, R., 2003, MNRAS, 339, 793
- Ho, Filippenko & Sargent (1997) Ho, L., Filippenko, A. V. & Sargent, W. L. W., 1997, ApJ, 487, 568
- Hogg et al. (1998) Hogg D. W., Cohen J. G., Blandford R. & Pahre, M. A., 1998, ApJ, 504, 622
- Hogg et al. (2000) Hogg D. W., Pahre M. A., Adelberger K. L., Blandford R., Cohen J. G., Gautier T. N., Jarrett T., Neugebauer G. & Steidel C. C., 2000, ApJS, 127, 1
- Hornscheimeier et al. (2003) Hornscheimier, A. E. et al., 2003, ApJ (in press), see also Astro-ph/0305086
- Huchra & Burg (1992) Huchra, J. P., & Burg, R., 1992, ApJ, 393, 90
- Immler, Pietsch & Aschenback (1998) Immler, S., Pietsch, W. & Aschenback, B., 1998, A&A, 331, 601
- Jansen, Franx & Fabricant (2001) Jansen, R. A., Franx, M. & Fabricant, D., 2001, ApJ, 551, 825
- Jarrett et al. (2003) Jarrett, T. H., Chester, T., Cutri, R., Schneider, S. & Huchra, J. P., 2003, AJ, 125, 525
- Kauffmann et al. (2003) Kauffmann, G. et al., 2003, MNRAS, 341, 54
- Kennicutt (1983) Kennicutt Jr., R. C., 1983, ApJ, 272, 54
- Kennicutt (1992) Kennicutt Jr., R. C., 1992, ApJ, 388, 310
- Kennicutt (1998) Kennicutt Jr., R. C., 1998, ARA&A, 36, 189
- Kobulnicky et al. (2003) Kobulnicky, H. A. et al., 2003, ApJ, submitted (Astro-ph/0305024)
- Lilly et al. (1996) Lilly, S. J., LeFevre, O., Hammer, F. & Crampton, D. C., 1996, ApJ, 460, L1
- Lira et al. (2002) Lira, P., Ward, M., Zeza, A., Alonso-Herrero, A. & Ueno, S., 2002, MNRAS, 330 259
- Madau, Pozzetti & Dickinson (1998) Madau, P., Pozzetti, L. & Dickinson, M., 1998, ApJ, 498, 106
- Makishima et al. (2000) Makishima, K. et al., 2000, ApJ, 535, 632
- Martin, Kobulnicky & Heckman (2002) Martin, C. L., Kobulnicky, H. A. & Heckman, T. M., 2002, ApJ, 574, 663
- McQuade, Calzetti & Kinney (1995) McQuade, K., Calzetti, D. & Kinney, A. L.,1995, ApJS, 97, 331
- Moran, Lehnert & Helfand (1999) Moran, E. C., Lehnert, M. D. & Helfand, D. J., 1999, ApJ, 526, 649
- Moran, Filippenko & Chornock (2002) Moran, E. C., Filippenko, A. V., & Chornock, R. 2002, ApJ, 579, L71
- Okada, Mitsuda & Dotani (1997) Okada, K., Mitsuda, K. & Dotani, T., 1997, PASJ, 49, 653
- Oke et al. (1995) Oke, J. B., Cohen, J. G., Carr, M., Cromer, J., Dingizian, A., Harris, F. H., Labrecque, S., Lucinio, R., Schaal, W., Epps, H. & Miller, J., 1995, PASP, 107, 307
- Phillips et al. (1997) Phillips, A.. C., Guzmán, R., Gallego, J., Koo, D. C., Lowenthal, J. D., Vogt, N. P., Faber, S. M. and Illingworth, G. D. 1997, ApJ, 489, 543
- Ptak & Griffiths (1999) Ptak, A. & Griffiths, R., 1999, ApJ, 517, L85
- Read & Stevens (2002) Read, A. M. & Stevens, I. R., 2002, MNRAS, 335, L36
- Rola, Terlevich & Terlevich (1997) Rola, C. S., Terlevich, E. & Terlevich, R. J., 1997, MNRAS, 289, 419
- Richards et al. (1998) Richards, E.A., Kellermann, K.I., Fomalont, E.B., Windhorst, R.A. & Partridge, R.B., 1998, AJ, 116, 1039
- Richards (2000) Richards, E. A., 2000, ApJ, 533, 611
- Rosa-Gonzalez, Terlevich & Terlevich (2002) Rosa-Gonzalález, D., Terlevich, E. & Terlevich, R., 2002, MNRAS, 332, 283
- Schlegel, Finkbeiner & Davis (1998) Schlegel, D. J., Finkbeiner, D. P. & Davis, M., 1998, ApJ, 500, 525
- Schmidt (1959) Schmidt, M., 1959, ApJ, 129, 243
- Skrutskie et al. (1997) Skrutskie, M. F., Schneider, S.E., Stiening, R., Strom, S.E., Weinberg, M.D., Beichman, C., Chester, T. et al., 1997, in The Impact of Large Scale Near-IR Sky Surveys, ed. F.Garzon et al. (Dordrecht: Kluwer), p. 187
- Storchi-Bergmann, Kinney & Challis (1995) Storchi-Bergmann, T., Kinney, A. L. & Challis, P., 1995, ApJS, 98, 103
- Terashima & Wilson (2001) Terashima, Y. & Wilson, A. S., 2001, ApJ, 560, 139
- Tenorio-Tagle et al. (1999) Tenorio-Tagle G., Silich, S. A., Kunth, D., Terlevich, E. & Terlevich, R., 1999, MNRAS, 309, 332
- Terashima & Wilson (2001) Terashima, Y. & Wilson, A. S., 2003, ApJ, see Astro-ph/0305563
- Tully et al. (1998) Tully, R. B., Pierce, M. J., Huang, J. S., Saunders, W., Verheijen, M. A. W. & Witchalls, P. L., 1998, AJ, 115, 2264
- Ueda et al. (2001) Ueda , Y., Ishisaki, T., Makishima, K. & Ohashi,T., 2001, ApJS, 133, 1
- Veilleux & Osterbrock (1987) Veilleux, S. & Osterbrock, D. E., 1987, ApJS, 63, 295
- Vogler & Pietsch (1997) Vogler & Pietsch, 1997, A&A, 319, 459
- Williams et al. (1996) Williams, R. E., et al. 1996, AJ, 112, 1335
- Wilson et al. (2002) Wilson, G., Cowie, L. L., Barger, A. J. & Burke, D. J., 2002, AJ, 124, 1258
- Young et al. (1996) Young, J. S., Allen, L., Kenney, J. D. P., Lesser, A. & Rownd, B., 1996, AJ, 112, 1903
- Zezas & Fabbiano (2002) Zezas, A. & Fabbiano, G., 2002, ApJ, 577, 726
| ID | log[] | log(Mass) | log[SFRi(H) | Log[SFRi(3727) | Refs. | Refs |
|---|---|---|---|---|---|---|
| (log(W)) | (log[⊙]) | ⊙(⊙/yr)] | (⊙/yr)] | (X-ray) | (Opt.) | |
| NGC 253 | 33.11 | 10.57 | 0.58 | 1 | ||
| NGC 628 | 32.78 | 10.51 | 0.55 | 1 | ||
| NGC 891 | 32.99 | 10.86 | 0.19 | 9 | ||
| NGC 1614 | 34.62 | 11.15 | 1.58 | 9 | ||
| NGC 3031 (M81) | 33.15 | 10.75 | 0.20 | 1 | ||
| NGC 3034 (M82) | 33.38 | 10.42 | 1.05 | 0.24 | 2 | |
| NGC 3256 | 35.00 | 11.22 | 1.61 | 3,10 | ||
| NGC 3310 | 33.58 | 10.08 | 1.61 | 0.67 | 1 | |
| NGC 4038ccAlso known as the Antennae galaxy. | 34.08 | 10.87 | 1.13 | 4 | ||
| NGC 4321 (M100) | 33.74 | 11.00 | 0.55 | 5 | ||
| NGC 4449 | 32.45 | 9.41 | 1.58 | 0.12 | 1,6 | |
| NGC 4631 | 33.26 | 10.51 | 1.20 | 0.49 | 1 | |
| NGC 5194 (M51) | 32.92 | 10.77 | 0.74 | 0.47 | 1,7 | |
| NGC 5236 (M83) | 32.68 | 10.53 | 0.96 | 8 |
| Concern | log[SFRi] | log[SFRi] |
|---|---|---|
| (3727) (dex) | (H) (dex) | |
| Optical: | ||
| mag | 0.4 | 0.2 |
| O abundance | 0.1aa1. Fabbiano, Kim & Trinchieri (1992), 2. Ptak & Griffiths (1999), 3. Lira et al. (2002), 4. Fabbiano, Zezas & Murray (2001), 5. Immler, Pietsch & Aschenback (1998), 6. Vogler & Pietsch (1997), 7. Terashima & Wilson (2001), 8. Okada, Mitsuda & Dotani (1997), 9.Ueda et al. (2001), 10. Moran, Lehnert & Helfand (1999). | 0.0 |
| O excitation | 0.2 | 0.0 |
| Optical flux unc. | 0.15 | 0.1 |
| Optical ap. corr. | 0.05bb. Bell & Kennicutt (2001), . Calzetti et al. (1994), Calzetti et al. (1995), . Young et al. (1996) | |
| Inclination correc. unc. | 0.1 | 0.05 |
| X-ray: | ||
| No X-ray -correc. | 0.1 | 0.1 |
| Conv. to ChandraccConversion between ASCA, Einstein and Chandra full-band fluxes. | 0.05 | 0.05 |
| Predicted total ddThis is the sum in quadrature of the terms listed above. | 0.51 | 0.26 |
| Observed | 0.31 |
| ID | (3727)aaCalculated from the fit of 3727/H to a sample of local galaxies of known O/H by Jansen, Franx & Fabricant (2001). | log[SFRi(3727) | Radio/VLAbbThe spectra are generally obtained through a slit that is too small to pass all the light from the galaxy. See the text for how this is taken into account. This term is the uncertainty in the correction. | |
|---|---|---|---|---|
| (Å) | (log[⊙/yr]) | |||
| Galaxies | ||||
| F36194_1252 | 0.474 | 14.1 | 0.74( | Y |
| F36199_1251 | 0.695 | 55.7 | 0.86() | |
| F36211_1208 | 0.841 | 15.3 | 1.18() | |
| F36246_1111ccNo axis ratio could be measured for this galaxy. | 0.748 | 6.9 | 0.20() | |
| F36273_1258 | 1.221 | 28.4 | 1.34() | |
| F36312_1236 | 0.455 | 75.5 | 0.99() | |
| F36332_1134 | 0.080 | 33.0 | ||
| F36336_1005ccNo axis ratio could be measured for this galaxy. | 1.015 | 40.7 | 1.30() | |
| F36346_1241ccNo axis ratio could be measured for this galaxy. | 1.219 | 111.2 | 1.60() | Y |
| F36348_1628 | 0.847 | 11.7 | 0.56() | |
| F36363_1320 | 0.680 | 40.9 | 0.66 | |
| F36389_1257 | 1.127 | 6.8 | 0.67() | |
| F36440_1250 | 0.557 | 25.3 | 0.95() | Y |
| F36470_1237 | 0.321 | 28.6 | 0.30() | |
| F36517_1220 | 0.401 | 36.6 | 0.90() | Y |
| F36521_1457 | 0.358 | 46.9 | 0.60() | |
| F36527_1355 | 1.355 | 114.0() | 2.25() | |
| F36534_1140 | 1.275 | 54.7() | 1.11() | Y |
| F36573_1026 | 0.847 | 20.1() | 0.29() | |
| F36599_1450 | 0.762 | 35.0 | 1.47() | Y |
| F37004_1617ccNo axis ratio could be measured for this galaxy. | 0.913 | 34.2 | 0.91() | |
| F37144_1221 | 1.084 | 22.8() | 0.65() | |
| Galaxies | ||||
| F36230_1346 | 0.485 | 23.4 | 0.88 | |
| F36345_1213 | 1.015 | 14.1 | 1.32 | Y |
| F36397_1010 | 0.509 | 14.0 | 0.23 | |
| F36399_1250ccNo axis ratio could be measured for this galaxy. | 0.848 | 17.2 | 0.93 | |
| F36422_1545 | 0.857 | 13.0 | 1.18 | Y |
| F36431_1109ccNo axis ratio could be measured for this galaxy. | 0.297 | 13.5() | ||
| F36481_1309 | 0.476 | 21.8 | 0.86() | |
| F36509_1031 | 0.410 | 10.4 | 0.33() | Y |
| F36588_1638 | 0.299 | 11.3 | 0.57() | |
| F36588_1435 | 0.678 | 4.7 | 0.49() | |
| F37020_1123 | 0.136 | 22.1 | 0.20() | |
| F37027_1543 | 0.514 | 8.3 | 0.71() | |
| F37046_1429 | 0.561 | 8.8 | 0.52() | |
| F37058_1154 | 0.904 | 23.3 | 1.26() | Y |
| F37083_1056 | 0.423 | 34.5 | 1.39() | Y |
| F37138_1424 | 0.475 | 34.2 | 0.79() |
| Sample | No. | SFRi(H) | SFRi(3727) | log[]aaRest frame equivalent width of 3727 Å emission line. | SFRi/10⊙ | SFRi/10⊙ | |
|---|---|---|---|---|---|---|---|
| Gals. | (⊙/yr) | (⊙/yr) | (⊙) | (⊙/yr)(H) | (⊙/yr)(3727) | ||
| HDF Sample | |||||||
| Xray+Radio+CFGRSbbThese galaxies have been detected with the VLA (Richards et al., 1998; Richards, 2000). | 11 | 0.76 | 15.1 | 11.09 | 13.8 | ||
| Xray+CFGRS/ | 22 | 0.84 | 7.6 | 10.71 | 17.8 | ||
| Xray+CFGRS/ | 16 | 0.49 | 5.6 | 10.88 | 5.4 | ||
| Local Galaxies | |||||||
| Local calib. | 14 | 0.00 | 2.9 | 10.75 | 7.2 |
| Sample | No.Gals | SFR(H) | SFR(3727) | log[]aaInferred from the luminosity at rest frame . | SFR/10⊙ | SFR/10⊙ |
|---|---|---|---|---|---|---|
| (⊙/yr) | (⊙/yr) | (⊙) | (⊙/yr)(H) | (⊙/yr)(3727) | ||
| HDF Sample | ||||||
| Xray+Radio+CFGRSbbOnly galaxies with optical emission lines are included. | 11 | 29.4 | 11.55 | 36.7 | ||
| Xray+CFGRS/ | 22 | 39.9 | 11.41 | 83.2 | ||
| Xray+CFGRS/ | 16 | 29.4 | 11.55 | 14.3 | ||
| Local Galaxies | ||||||
| Local calib. | 14 | 53.7 | 11.15 | 40.5 |