Model Dependence of Lateral Distribution Functions of
High Energy Cosmic Ray Air Showers
Abstract
The influence of high and low energy hadronic models on lateral distribution functions of cosmic ray air showers for Auger energies is explored. A large variety of presently used high and low energy hadron interaction models are analysed and the resulting lateral distribution functions are compared. We show that the slope depends on both the high and low energy hadronic model used. The models are confronted with available hadron-nucleus data from accelerator experiments.
I Introduction
Microscopic calculations of cosmic ray air showers at energies eV are of crucial importance for the reconstruction of the properties of the primary cosmic ray. Ground-array type experiments like AGASA and Auger (working in non-hybrid mode) determine the energy of the primary cosmic ray by measuring the particle density at some distance from the shower axis. Muons as ground particles are interesting because they carry information about the composition of the primary cosmic ray; showers induced by heavy nuclei tend to give more muons than showers induced by protons or photons.
The interpretation of the observed signals depends strongly on the quality of the air shower model and simulation. Careful modelling of the shower development and properties is therefore of utmost importance. Many papers have restricted their focus to the dependence of air shower properties on the high energy hadronic model Heck:1997tw ; Heck:2002yc ; Heck:2000nv ; Heck:2001is ; Heck:2002yf ; Alvarez-Muniz:2002ne . This has been thought to be the main uncertainty for the determination of the shower maximum in the longitudinal profile. Models that predict a higher cross section or a higher multiplicity yield shower maxima at smaller slant depths, i.e., higher in the atmosphere (see e.g. Alvarez-Muniz:2002ne ).
In this paper we analyse the model dependence for lateral distribution functions (LDF) for muons, electrons/positrons and photons. For these observables, the low energy hadronic model becomes important, especially for the LDF of muons, because these are decay products of low energy charged mesons Engel99 ; Engel01 . Also the tails of LDFs of electrons/positrons and photons are influenced by the low interaction energy region as discussed in Drescher:2002vp .
II Air shower modelling
For the present investigation of air shower models the SENECA framework is used. For an introduction and details about the SENECA model, the reader is referred to Drescher:2002cr ; Bossard:2000jh . In this approach, the intermediate energy region is calculated by solving a set of transport equations numerically. The high energy models that we compare are QGSJET01 QSJET and SIBYLL2.1 Fletcher:1994bd ; Engel:1999db ; the choices for the low energy model are GHEISHA GHEISHA , G-FLUKAFLUKA (the notation G- denotes the older version of FLUKA as found in Geant3.21), and UrQMD 1.2.1 Bleicher:1999xi ; Bass:1998ca ; Agostinelli:2002hh . Electromagnetic showering is done by the EGS4-code EGS4 .
UrQMD is a microscopic transport approach based on the covariant propagation of constituent quarks and di-quarks accompanied by mesonic and baryonic degrees of freedom. The leading hadrons of the fragmenting strings contain the valence-quarks of the original excited hadron. The elementary hadronic interactions are modelled according to measured cross sections and angular distributions. If the cross sections are not experimentally known, detailed balance is employed in the energy range of resonances. The partial and total decay widths are taken from the Particle Data Group Caso:1998tx .
Since UrQMD does not have an intrinsic cross section calculation, it is implemented in the following way. For collisions with e.g. nitrogen one assumes a disk with radius 5 fm, corresponding to a geometric cross section of 750 mb. The projectile is then propagated over a distance which is chosen randomly according to the mean free path, and is placed randomly on this disk. The fact that the cross section was assumed too large is automatically compensated by a certain number of non-interactions. The fraction of interactions times 750 mb gives the inelastic cross section. In a certain way, one can picture this as nature does it: The particle passes through the air, and whenever the transverse distance to a nucleus is too large, it continues to propagate without interaction.


III Results
III.1 Modification of lateral distribution functions
Lateral distribution functions are composed of three particle types, namely electrons/positrons, photons and muons. The former two are initiated by the decays of high and low energetic s, whereas the muons are decay products of low energetic charged mesons. As pointed out in Drescher:2002vp , high energy pion decays determine the electromagnetic LDF near the core. However, at large distances from the core, the contribution from low energy pions gains importance. Muons are in general produced by charged mesons that decay at intermediate altitudes ( km).
Let us start with a comparison of the LDFs for different high energy hadronic interaction models. We compare vertical proton induced eV showers (averaged), observed at 860 g/cm2 altitude. The kinetic energy cutoffs are MeV for electrons/photons, and MeV for muons. As previously shown with CORSIKA simulations in Heck:2002yf , the present study also gives fewer muons and more electrons for SIBYLL than for QGSJET at small distances. At large distances both the electromagnetic and the muonic component are smaller in SIBYLL, as shown in Fig. 1 (top). This is confirmed in the average longitudinal profile from both models, as shown in Fig. 1 (bottom): QGSJET develops higher in the atmosphere. The significant difference in muons can be traced back to the higher average multiplicity of QGSJET. This difference is about 25% at 100 GeV and reaches a factor of two at eV Alvarez-Muniz:2002ne . At low energies this is due to different implementations of parton distribution functions (PDFs), QGSJET implements a flatter choice, even though contradictory to A flater PDF has a higher parton density a intermediate (Feynman-x: longitudinal momentum fraction) or energy, and higher density at lower or higher energy. HERA data (see Ostapchenko:2003sj ; Knapp28Icrc for discussion). This leads to a somewhat higher multiplicity at low energies (ca. 100 GeV) but helps to control particle multiplicities up to collider energies. For higher energies particle production increases again strongly since QGSJET misses higher order corrections. Current efforts focus on resolving this problem by introducing enhanced Pomeron diagrams Ostapchenko27ICRC . SIBYLL mimics this effect by the implementation of an ad-hoc energy dependent cutoff for hard processes Engel:1999db . Since the main contribution of particle production comes from hard processes, an increase of with energy leads to a moderate rise of the multiplicity.

In the following, vertical eV proton induced showers are analysed. Fig. 2 shows the ratio of LDFs for the following combination of hadronic models. QGSJET and GHEISHA (QG), QGSJET and G-FLUKA (QF), and QGSJET and UrQMD (QU). The functions are plotted as a ratio to QGSJET+UrQMD. Whereas the QGSJET+G-FLUKA and QGSJET+UrQMD models show rather similar LDFs, resulting in a ratio close to unity, QGSJET+GHEISHA has a notably flatter LDF. The effect is most significant for muons, somewhat less for electrons and photons. This can be understood by the fact that most of the last collisions for muons producing hadrons are in the low-energy regime. The same is true for electrons and photons at larger distances from the shower-axis. The muon ratio reaches almost a factor of 2 at 3000 meters.


It is especially interesting to study the experimental response of the different components. At the Pierre Auger Observatory, the density is measured in vertical equivalent muon units (VEM). A vertical minimum ionising muon counts as one particle. Since the detectors are water tanks, muons penetrate much deeper than electrons and photons, and are expected to give a more pronounced signal. We calculate the detector response in terms of Cherenkov photons. A detector simulation based on the WTANK program wtank has been done for the setup of an Auger water tank, by counting the number of Cherenkov photons arriving at the positions of the photo-multipliers. Tables with the results have been made for different incident angles, energies and particle types and are then applied to the simulations. The results for an average vertical shower are shown in Fig. 3. The model combination used here is QGSJET01+UrQMD. One sees that the curves for muons in number density and VEM units almost agree, whereas photons and electrons give less contribution per particle. Photons are still dominant due to their high number. These results are in good agreement with calculations presented in the Auger Design Report unknown:1996re . For completeness we show that protons and neutrons have a negligible contribution to the total signal.

The ratio of QGSJET+GHEISHA to SIBYLL+ G-FLUKA, together with the VEM yields, are depicted in Fig. 4. These model combinations give the most different results. The effect on the slope of the VEM-LDF is even bigger because at small distances photons dominate the signal, whereas at large distances the muons give the most contribution. The sensitivity of Auger to models is somewhat higher than for experiments using thin plastic scintillators. The main reason is that water tanks are more sensitive to muons, since their mean path length through the material is much longer. Further, muons become more dominant at large core distances, due to the flatter LDF. These two facts are important when choosing the density at a given distance as energy estimator. However, as shown below, GHEISHA as low energy hadronic model can be excluded from accelerator data and the differences between the remaining two low energy models are not so large. With a well measured LDF and a cross-calibration with the fluorescence method, Auger might be able to discriminate between high energy hadronic models.
The LDFs for the different models have been fitted to the following function
| (1) |
with , , , being fit parameters and being the distance to the shower axis in meter. This function is inspired from the one used by AGASA Takeda:2002at . The resulting parameters are shown in Table 1. Fig. 5 shows the LDFs in VEM units for all model combinations, scaled by function (1), using the parameters for QGSJET+UrQMD. One sees how at small distances, the high energy model determines the shape; at larger distances deviations result from differences in the low energy hadronic models.

| Model | ||||
|---|---|---|---|---|
| QGSJET01+GHEISHA | 3.17 | 3.05 | 986 | 0.87 |
| QGSJET01+UrQMD | 4.00 | 3.10 | 1540 | 1.63 |
| QGSJET01+G-FLUKA | 3.13 | 3.05 | 1126 | 1.34 |
| SIBYLL+GHEISHA | 4.88 | 3.15 | 1036 | 0.96 |
| SIBYLL+UrQMD | 4.88 | 3.15 | 1136 | 1.30 |
| SIBYLL+G-FLUKA | 4.15 | 3.11 | 985 | 1.26 |
III.2 Comparisons of models with data
In this section the behaviour of the different hadronic models and their influence on the LDFs is analysed. Here we focus on data available for hadron-nucleus collisions in the relevant energy domain. Light nuclei are chosen which are somewhat comparable to air. Fig. 6 addresses the mean multiplicity of pions for Ne reactions at GeV/c Yeager:1977ym . One clearly observes that GHEISHA produces too many pions, while UrQMD and G-FLUKA are in line with the measured data.


To explore the longitudinal momentum distribution, we confront the models with rapidity spectra for p+Be reactions at 14.6 GeV/c taken at the AGS. The fact that GHEISHA shows a strange peak in the rapidity spectra is well-known Ferrari1996 . In addition, GHEISHA yields too high multiplicities for pions, and G-FLUKA overestimates the longitudinal momentum loss for protons. The stopping of the initial proton is well described by UrQMD and GHEISHA.


At higher energies, we can add QGSJET and SIBYLL to the comparison. These models are commonly employed at energies larger than 100 GeV. For example, CORSIKA uses 80 GeV as transition value. Fig. 8 shows that QGSJET overestimates and SIBYLL underestimates the negatively charged hadron multiplicities in p+Mg reactions at 100 and 200 GeV/c. The three other model results are in line with the data (NA35 Baechler:1991jh ).
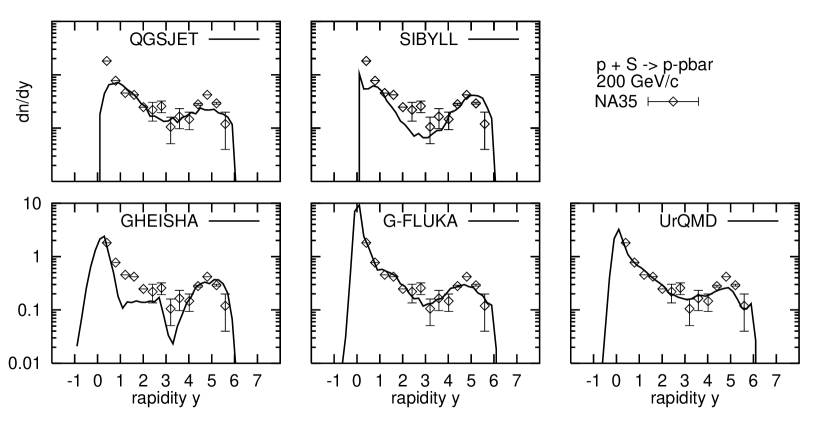
Figs. 9 and 10 show rapidity spectra of (negatively) charged hadrons for p+Ar reactions DeMarzo:1982rh . Again, QGSJET and SIBYLL do deviate from the data. GHEISHA still produces the peak, which is located such that the total multiplicity is well described. G-FLUKA and UrQMD give good descriptions of the data. A similar behaviour is obtained for p+S collisions at 200 GeV/c (NA35 data Alber:1998sn ), as demonstrated in Figs. 11 and 12. Note that the analysis has been performed with the experimental trigger demanding a minimum of 5 charged particles being produced in the reaction.
As above, the longitudinal momentum loss of the protons (stopping) is best described by G-FLUKA and UrQMD.


An overall comparison is given in Figs. 13 and 14, where the mean multiplicity of negatively charged hadrons is plotted as a function of the incident kinetic energy. Below 100 GeV GHEISHA produces more particles per collision; this leads to the higher muon densities at large distances. In the same way the multiplicity of produced s changes the shape of the LDF of electrons and photons, only at larger distances, where this energy region becomes more dominant. UrQMD is slightly lower in multiplicity than G-FLUKA. The fact that the latter results in smaller signals at large distances might be due to differences in the total cross section, which is neglected in this analysis. The overestimation of particle production by QGSJET in the transition region above 100 GeV is significant. Since QGSJET is the most used model in air shower simulations, these deviations do deserve further studies, because the energy region above 100 GeV is certainly important for muon production.
IV Conclusions
-
•
We have demonstrated that the LDFs for high energy air showers depend on the high and also on the low energy hadronic models. The tails are strongly influenced by the low energy model, which therefore modifies the slope of the LDFs.
-
•
GHEISHA, which is commonly used as low energy hadronic model, reproduces less accurately available data of hadron induced interactions. G-FLUKA and UrQMD describe the data better.
-
•
In the transition region around 100 GeV, QGSJET predicts too high particle multiplicities, whereas SIBYLL is somewhat low. The present findings suggest to increase the transition energy. UrQMD is tested up to RHIC energies (21 TeV), and could be employed up to this value.
Acknowledgements.
This work has been supported by the German BMBF/DESY. The computational resources have been provided by the Center for Scientific Computing in Frankfurt am Main.References
- [1] D. Heck, G. Schatz, and J. Knapp. Nucl. Phys. B (Proc. Suppl.), 52:139, 1997.
- [2] D. Heck et al. In Proceedings of the 27th International Cosmic Ray Conference, page 233, Hamburg, Aug. 7-15 2001.
- [3] D. Heck. In T. Csorgo, editor, Proc. XXX Int. Symp. Multiparticle Dynamics, page 252, Tihany (Hungary), 9-15 Oct. 2000. World Scientific (Singapore) 2001.
- [4] D. Heck. Nachr. Forsch. Zentr. Karlsruhe, 33:113, 2001.
- [5] D. Heck et al. Nucl. Phys. B (Proc. Suppl.), 122:364, 2002.
- [6] J. Alvarez-Muniz et al. Phys. Rev., D66:033011, 2002.
- [7] R. Engel et al. In I. Sarcevi and C.-I. Tan, editors, Providence 1999, QCD and multiparticle production, page 457, Providence, Rhode Island, Aug. 9-13 1999. World Scientific (Singapore).
- [8] R. Engel. In Proceedings of the 27th International Cosmic Ray Conference, page 181, Hamburg, Aug. 7-15 2001. (rapporteur talk).
- [9] H.J. Drescher and G.R. Farrar. Astropart. Phys., 19:235, 2003.
- [10] H.J. Drescher and G.R. Farrar. Phys. Rev., D67:116001, 2003.
- [11] G. Bossard et al. Phys. Rev., D63:054030, 2001.
- [12] N.N. Kalmykov, S.S. Ostapchenko, and A.I. Pavlov. Nucl. Phys. B (Proc. Suppl.), 52:17, 1997.
- [13] R. S. Fletcher et al. Phys. Rev., D50:5710, 1994.
- [14] R. Engel et al. In Proceedings of the 26th International Cosmic Ray Conference, page 415, Salt Lake City, Utah, Aug 17-25 1999.
- [15] H. Fesefeldt. PITHA 85/02, RWTH Aachen, 1985.
- [16] A. Fasso et al. In Proceedings of the Workshop on Simulating Accelerator Radiation Environments, page 134. Los Alamos Report LA-12835-C, 1992.
- [17] M. Bleicher et al. J. Phys., G25:1859, 1999.
- [18] S. A. Bass et al. Prog. Part. Nucl. Phys., 41:225, 1998.
- [19] S. Agostinelli et al. Nucl. Instrum. Meth., A506:250, 2003.
- [20] W. R. Nelson et al. SLAC-265, Stanford Linear Accelerator Center, 1985.
- [21] C. Caso et al. Eur. Phys. J., C3:1, 1998.
- [22] S. S. Ostapchenko. J. Phys., G29:831, 2003.
- [23] M. Zha et al. In Proceedings of the 28th International Cosmic Ray Conference, page 515, Tsukuba, Jul. 31-Aug. 7 2003.
- [24] S. Ostapchenko et al. In Proceedings of the 27th International Cosmic Ray Conference, page 446, Hamburg, Aug. 7-15 2001.
- [25] J.R.T de Mello Neto. Auger technical notes: GAP-1998-20. http://www.auger.org.
- [26] http://www.auger.org.
- [27] M. Takeda et al. Astropart. Phys., 19:447, 2003.
- [28] W. M. Yeager et al. Phys. Rev., D16:1294, 1977.
- [29] T. Abbott et al. Phys. Rev., D45:3906, 1992.
- [30] A. Ferrari and P.R. Sala. Atlas int. Note PHYS-No-086 (CERN), 1996.
- [31] J. Baechler et al. Z. Phys., C51:157, 1991.
- [32] C. De Marzo et al. Phys. Rev., D26:1019, 1982.
- [33] T. Alber et al. Eur. Phys. J., C2:643, 1998.