High Redshift Supermassive Black Holes: X–ray observations
Abstract
The spectrum of the hard X–ray background records the history of accretion processes integrated over the cosmic time. Several observational and theoretical evidences indicate that a significant fraction of the energy density is obscured by large columns of gas and dust. X–ray surveys are the most efficient way to trace accretion onto supermassive black holes, since obscured, accreting sources are more difficult to select at all other wavelengths. The current status of hard X–ray surveys after the recent observations carried out with Chandra and XMM–Newton satellites is reviewed along with the results of extensive follow–up multiwavelength observations. In particular recent results concerning the physical and evolutive properties of the supermassive black holes hosted by X–ray selected Active Galactic Nuclei at high redshifts will be discussed.
1 Introduction
The advent of imaging instruments in the 2–10 keV band, first onboard ASCA and BeppoSAX (Ueda , Akiyama , rdc , ff99 ; ff01 , flf02 , giommi ) and then on Chandra and XMM–Newton, has led to a dramatic step forward in the study of accretion-powered supermassive black holes hosted in the nuclei of distant active galaxies (AGN). Thanks to the superb capabilities of the Chandra observatory fully exploited by means of deep exposures which have reached about 1 Msec in the Chandra Deep Field South (CDFS gia02 ; ros02 and almost 2 Msec in the Chandra Deep Field North (CDFN; davo03 ), about 80–90% of the 2–10 keV X–ray Background (XRB, see e.g. mushy , gia01 ; gia02 , bra02 , has01 ) has been resolved into discrete sources.
The study of the hard X–ray source population is being pursued combining deep sensitive Chandra observations with medium–deep (i.e. the Lockman Hole; has01 ) and shallow large area (i.e. the HELLAS2XMM serendipitous survey; baldi ) XMM–Newton surveys, which nicely complement the high spatial resolution Chandra observations and allow to collect enough X–ray photons to perform spectral analysis.
These studies confirm, at least qualitatively, the predictions of standard AGN synthesis models for the XRB (e.g. sw89 , com95 ; com01 gil01 ): the high energy background radiation is mostly due to the integrated contribution of obscured and unobscured AGN folded with the corresponding evolution of their luminosity function over the cosmic time.
According to these models, most (i.e. 70–80 %) of the X–ray light produced by accretion onto supermassive black holes is obscured by large columns of gas and dust. Although obscured AGN are common in the local Universe (maiolino , ris99 ) and several examples of distant objects are being found in the optical follow–up observations of hard X–ray surveys (nor02 ste02 ), the space density, cosmological evolution and absorption distribution of the energetically dominant component of the XRB is still subject to several uncertainties which prevent us from a better understanding of their physical nature and their role in models of galaxy evolution. Since we know that basically all spheroidal galaxy in the nearby Universe contains a massive black hole geb00 , the study of the evolutionary properties of active galaxies would provide key information on the assembling and feeding of supermassive black holes over the cosmic time.
Here we review the status of hard X–ray surveys and associated multiwavelength program and how they can help in solving some of the issues outlined above.
2 The content of X–ray surveys
Extensive campaigns of optical spectroscopy observations have been carried out to identify the counterparts of hard X–ray sources. Redshifts could be obtained for a few hundreds of objects in both the CDFN and CDFS reaching a spectroscopic completeness of the order of 50–60% down to a limiting magnitude of R 24. We refer to barg02 and szo03 for a detailed description of the source breakdown. The most important and somehow unexpected finding of the identification process concerns the optical appearence of hard X–ray sources. The large majority of them do not show broad optical and ultraviolet emission lines which are known to be common among the counterparts of soft (0.5–2 keV) ROSAT sources leh01 . The hard X–ray spectra and high X–ray luminosities strongly suggest that the accreting black holes which power the X–ray emission are obscured by large columns of gas and dust which estinguish also the optical–UV light.
The present spectroscopic completeness of the identifications in the CDFS and CDFN is such to allow the calculation of reliable redshift distributions and luminosity functions and the comparison with the prediction of AGN synthesis models for the XRB. Surprisingly enough, the observed redshift distribution shows a rather narrow peak in the range and is dominated by low luminosity objects (log = 42–44). This behaviour is significantly different from that observed by previous shallower ROSAT surveys and in contrast with the predictions of XRB synthesis models from which a population dominated by high luminosity AGN at was expected (com95 ,gil01 ). Furthermore, evidence is emerging (related to the difference above) of a luminosity dependence in the number density evolution of both soft and hard X-ray selected AGN (cowie03 , has03 ).
Although the above described results are quite robust, they are limited by the lack of redshift information for optically faint sources. Moreover, the small area covered, which is of the order of 0.05–0.1 deg2 in both CDFN and CDFS, makes deep Chandra surveys subject to the effects of field to field fluctuations (cosmic variance) and not well suited for the search of rare objects such as high luminosity, high redshift quasars. As an example there are only 6 AGN with logL and z in the CDFN among the almost 300 already identified sources.
In order to build sizeable samples of high luminosity, high redshift sources such as highly obscured type 2 quasars, a much wider area needs to be covered, of the order of a few square degrees. The HELLAS2XMM survey represents a first step towards this objective being designed to cover, when completed, some 4 deg2 above a 2–10 keV limiting flux of about 10-14 erg cm-2 s-1.
The optical follow–up spectroscopic identification process is being carried out making use of the ESO telescopes (3.6m and VLT), the 3.5m Italian National Telescope Galileo (TNG), and is complemented by multiwavelength observations in the near infrared (with ISAAC) and radio (with the VLA and ATCA telescopes) bands. We refer to bru03 ; ff03 for a detailed discussion of the results of the identification process.
3 Searching for high–z obscured sources
Evidences for the presence of a population of highly obscured sources are obtained combining the X–ray and optical fluxes of the yet unidentified sources in both deep and shallow surveys.
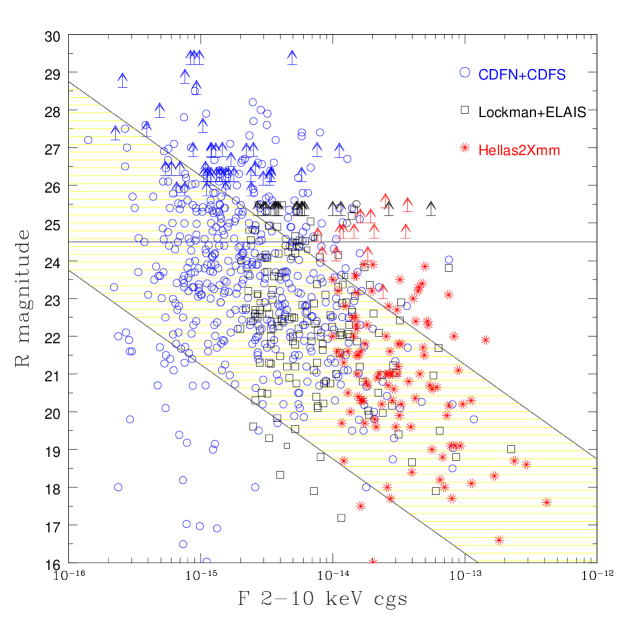
While the large majority of spectroscopically identified broad line AGN fall within 1 where is the 2–10 keV X–ray flux and the optical flux in the R filter, a sizeable fraction (of the order of 20–30 %) of X–ray sources reported in Fig. 1 are characterized by extreme values of their ratio. The ratio between the optical to X–ray optical depth, in the observer frame, scales roughly as , because dust extinction increases in the UV while X–ray absorption strongly decreases going toward high energies. The net result is that in the presence of an absorbing screen the observed optical flux of high–z QSO can be strongly reduced, and the observed magnitudes can be mainly ascribed to the starlight of the host galaxies. Conversely, the 2–10 keV X-ray flux can be much less reduced. Many extreme X-ray to optical flux ratio sources could therefore be distant, highly obscured type 2 QSO.
The spectroscopic identification of these objects is already challenging the capabilities of ground based, 10 m class optical telescopes calling for alternative, but less robust, identification techniques, such as photometric redshifts or measures based on the detection of redshifted iron lines.
It is interesting to note that the fraction of sources with high values of appears to be constant over the entire range of X–ray fluxes sampled by deep and shallow surveys. At the relatively bright fluxes covered by the HELLAS2XMM survey their optical counterparts are accessible to optical telescopes making their spectroscopic identification possible. Indeed, among the 13 HELLAS2XMM sources with for which good quality VLT spectra are available, we find 8 type 2 QSO classified as such on the basis of the lack of of broad optical lines and high X–ray luminosity (L erg s-1) ff03 .
It seems reasonable to argue that most of the sources characterized by a high value of are indeed high redshift obscured AGN. Since high luminosity, obscured quasars are a key ingredient of XRB synthesis models and may also provide a relevant fraction of the black hole mass density due to growth by a accretion a much better knowledge of their space density and evolutive properties is needed. In the following we describe some of the efforts made by our team towards the search for highly obscured AGN among unidentified faint X–ray sources.
4 Estimating redshifts for unidentified sources
4.1 A statistical approach
Combining the X–ray and optical spectroscopic information for a well defined sample of hard X–ray selected sources from deep Chandra and XMM–Newton surveys, a striking correlation (Fig. 2) between the X–ray to optical flux ratio and the hard X–ray luminosity has been found for objects classified as obscured (type 2) on the basis of the optical spectrum: higher luminosity AGN tend to have higher values of their ratio (ff03 ). There is no evidence of a correlation between the same quantities if optically unobscured (i.e. broad line type 1 quasars) sources are considered.
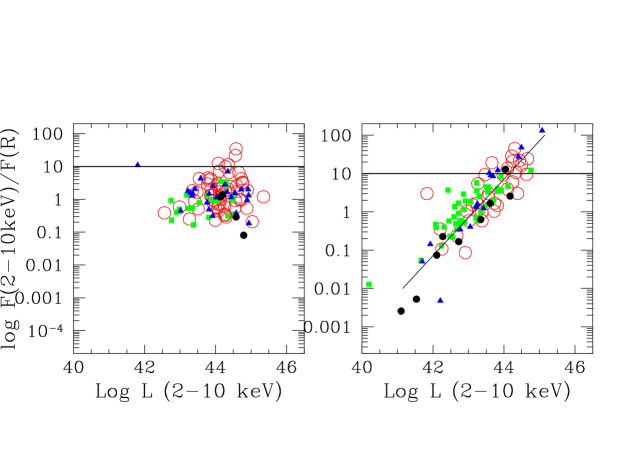
Making use of the above described correlation and assuming the ratio between type 1 and type 2 objects derived from the available identification of high objects, mainly from the HELLAS2XMM survey at bright X–ray fluxes, it is then possible to predict luminosities, and therefore redshifts, of unidentified faint sources.
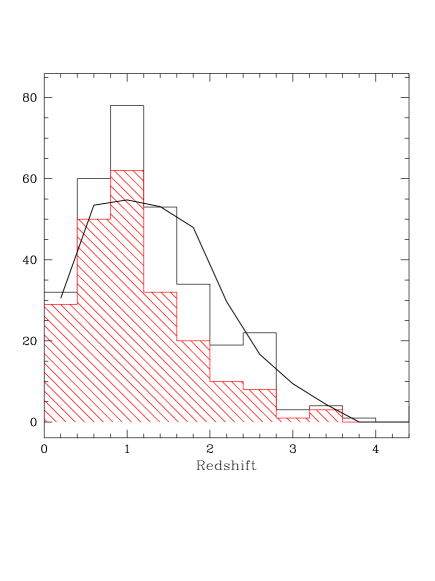
The redshift distribution of the sources with a spectroscopically confirmed redshift shows a sharp decrease at 1.2 which is similar to that observed in the CDFN (barg02 ) and CDFS (has03 ). When the sources with an estimated redshift are added, the overall distribution is still peaked at 1, but the decrease above this redshift is less sharp (Fig. 3), thus suggesting that low redshift peak in the distribution of the sources with spectroscopic redshift is enhanced by the incompleteness of the optical identification (in particolar for high values).
4.2 An approach based on the SED
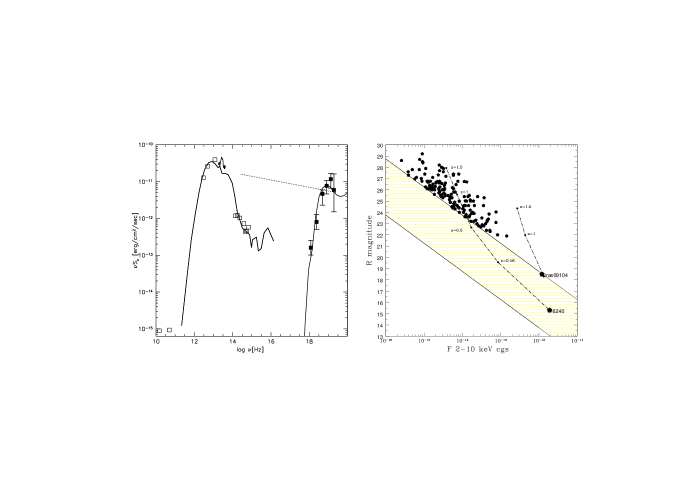
An alternative, and more speculative, approach cbm03 is based on the assumptions that the broad band (from near infrared to hard X–ray) spectral energy distribution (SED) of sources with high values of their ratios is similar to that of extremely obscured Compton thick ( 1024 cm-2) Seyfert 2 objects in the nearby Universe (see Fig. 4).
.
It is relatively straightforward to compute the R band optical magnitude and the 2–10 keV X–ray flux which would be observed for a source with the SED of Fig. 4 (left panel) as a function of redshift. The redshift tracks in the optical magnitude versus X–ray flux plane (Fig. 4, right panel) have been normalized to the observed X–ray flux and R magnitude of NGC 6240 and IRAS 091044109 (vig99 , fra00 ). The two objects are characterized by a similar SED but different X–ray luminosities (about erg s-1 and 1046 erg s-1 respectively). The results clearly indicate, at least at bright X–ray fluxes, that the observed high values of the X–ray to optical flux ratio are consistent with those expected by a population of moderately high redshift (), mildly Compton thick ( a few 1024 cm-2) AGN with X–ray luminosities in the range log erg s-1.
4.3 X–ray spectroscopy
Since its discovery by early X–ray observations, the fluorescent FeK iron emission line at 6.4 keV it is by now recognized to be an ubiquitous features in the high energy spectra of nearby Seyfert galaxies and an important diagnostic of the physical and dynamical status of the accreting gas. The iron line is by far the strongest emission feature in the X–ray band and thus can be used as a redshift indicator if the counting statistic is such to allow a reliable measure of its centroid energy. A systematic search for redshifted iron lines in a flux limited sample of sources in the CDFN 2 Ms exposure bau02 indicates a detection rate of about 10%. It is worth to note that a much higher percentage is found among relatively bright sources with log 1 ccb03 .

As an example we report here the detection of a highly significant emission line feature which is present around 3 keV in the spectrum of the unidentified Chandra source CXOHDFN 123556.12+621219.1 ( erg cm-2 s-1, =23.7, 18; davo03 ). The line energy corresponds to an X–ray redshift of =1.14 assuming neutral iron. There is also evidence of intrinsic absorption with a column density cm-2. Given its unabsorbed X–ray luminosity of about 1044 erg s-1 in the 2–10 keV band, this object could be classified as an highly obscured, highly luminous type 2 quasar. The search for iron emission line features will greatly benefit from the large collecting area of XMM–Newton and more X–ray resdhift determination are expected from deep XMM–Newton surveys.
5 The black hole mass density
Since the XRB spectral intensity records the bulk of the (obscured) accretion power it is possible to compute the local density in black holes due to growth by accretion fi99 using an argument originally proposed by Soltan sol82 :
| (1) |
where is the observed intensity of the XRB, the average redshift of the sources responsible of the bulk of the XRB emission, the efficiency of accretion and the bolometric correction from the observed band to the total luminosity.
A more detailed calculation could be performed if the luminosity function and redshift distribution of the sources is known:
| (2) |
The value of can then be compared with that measured from local galaxies using the relation ( fm00 ,geb00 ). A summary of the results of various determination of the black hole mass density has been recently discussed by fab03 and is reported in Table 1.
| Summary of Mass Densities in Supermassive Black Holes | |
|---|---|
| Method | ( M⊙ Mpc-3) |
| XRB spectrum – pre–Chandra surveys fi99 ; erz02 | |
| XRB spectrum – new z-distr from Chandra and XMM fab03 | |
| Hard X-ray LF ff03 | 4-6 |
| Hard X-ray LF cowie03 | |
| Bright QSO (from XLF) yt02 | |
| Local Quiescent Galaxies, fer02 | |
Although the various estimates agree each other within a factor 2–3, it has been pointed out fab03 that taking some of the values at the face value could have important astrophysical consequences.
For example if values of the order of 2 105 M⊙ Mpc-3 hold, then there would be little room for obscured accretion which is in contrast with the X–ray observations previously described, unless most of accreting black holes are very efficient ( 0.15, erz02 ). Higher values (4–6 105 M⊙ Mpc-3) of , such as those obtained using the results of Chandra and XMM–Newton surveys ff03 ; fi99 and a “standard” efficiency 0.1, would be consistent with the estimates based on the – relation fer02 .
In order to obtain robust estimates of the black hole mass density due to growth by accretion, a much better knowledge of the redshift and luminosity distribution (the latter being related to ) of highly obscured AGN is of paramount importance.
6 Conclusions
The overall picture emerging from X–ray observations favours a late formation of the XRB which appears to be dominated by low luminosity Seyfert galaxies peaking at relatively low redshifts. However, the physical and evolutionary properties of the obscured AGN population responsible for the extragalactic background light is still far to be understood. In particular there are evidences of a sizeable population of high redshift X–ray luminous quasars among the still unidentified sources. Obscured accretion, which can be best investigated in the hard X–ray band, is a fundamental tool to understand the evolution of supermassive black holes. Complete samples of obscured AGN over a range of redshifts are required. To this purpose large area (of the order of a few square degrees) hard X–ray surveys provide a promising opportunity.
References
- (1) Ueda, Y., Takahashi, T., Ishisaki, Y., Ohashi, T., 1999, ApJ 524, L11
- (2) Akiyama, M., et al. 2000, ApJ, 532, 700
- (3) Della Ceca, R., Castelli, G., Braito, V., Cagnoni, I., & Maccacaro, T. 1999, ApJ, 524, 674
- (4) Fiore, F., La Franca, F., Giommi, P., Elvis, M., Matt, G., Comastri, A., Molendi, S., Gioia, I. 1999, MNRAS, 306, L55
- (5) Fiore, F., et al. 2001, MNRAS, 327, 771
- (6) La Franca, F., Fiore, F., Vignali, C., Antonelli, A., Comastri, A., Giommi, P., Matt, G., Molendi, S., Perola, G. C., Pompilio, F. 2002, ApJ, 570, 100
- (7) Giommi, P., Perri, M., Fiore, F. 2000, A&A, 362, 799
- (8) Giacconi, R., et al. 2002, ApJS, 139, 369
- (9) Rosati, P., Tozzi, P., Giacconi, R., et al., 2002, ApJ 566, 667
- (10) Alexander, D.M., et al. 2003, AJ, in press (astro–ph/0304392)
- (11) Mushotzky, R.F., Cowie, L.L., Barger, A.J., & Arnaud, K.A. 2000, Nature, 404, 459
- (12) Giacconi, R., et al. 2001, ApJ, 551, 664
- (13) Brandt, W.N., Alexander, D.M., Bauer, F.E., Hornschemeier, A.E., 2002, Phyl. Trans. Royal Astr. Soc. London, A, 360, 2057
- (14) Hasinger, G., Altieri, B., Arnaud, M., et al., 2001, A&A 365, 45
- (15) Baldi, A., Molendi, S., Comastri, A., Fiore, F., Matt, G., & Vignali, C. 2002, ApJ, 564, 190
- (16) Setti, G., & Woltjer, L. 1989, A&A, 224, L21
- (17) Comastri, A., Setti, G., Zamorani, G., Hasinger, G., 1995, A&A 296, 1
- (18) Comastri, A., Fiore, F., Vignali, C., Matt, G., Perola, G. C., La Franca, F., 2001, MNRAS 327, 781
- (19) Gilli, R., Salvati, M., Hasinger, G., 2001, A&A 366, 407
- (20) Maiolino, R., Salvati, M., Bassani, L., Dadina, M., Della Ceca, R., Matt, G., Risaliti, G., & Zamorani, G., 1998, A&A, 338, 781
- (21) Risaliti, G., Maiolino, R., & Salvati, M., 1999, ApJ, 522, 157
- (22) Norman C., Hasinger G., Giacconi R., et al. 2002, ApJ 571, 218
- (23) Stern D., Moran E.C., Coil A.L., et al., 2002, ApJ 568, 71
- (24) Gebhardt, K., Bender, R., Bower, G., et al. 2000, ApJ, 539 L13
- (25) Barger, A. J., Cowie, L. L., Brandt, W.N. et al., 2002, AJ 124, 1839
- (26) Szokoly, G., Hasinger G., Rosati, P. et al., 2003 submitted
- (27) Lehmann, I., Hasinger, G., Schmidt, M., et al., 2001, A&A 371, 833
- (28) Cowie, L.L., Barger, A.J., Bautz, M.W., Brandt, W.N., Garmire, G.P., 2003, ApJ, 584, L57
- (29) Hasinger, G., and the CDFS team, 2003, astro–ph/0302574
- (30) Brusa, M., Comastri, A., Mignoli, M. et al. 2003, A&A in press (astro–ph/0307368)
- (31) Fiore, F., Brusa, M., Cocchia, F., et al. 2003, A&A in press (astro–ph/0306556)
- (32) Comastri, A., Brusa, M., & Mignoli, M., 2003, AN, 324, 28
- (33) Vignati, P., Molendi, S., Matt, G. et al., 1999, A&A, 349, L57
- (34) Franceschini, A., Bassani, L., Cappi, M., et al., 2000, A&A, 353, 910
- (35) Bauer, F.E., Vignali, C., Alexander, D.M., et al., AN, 324, 175
- (36) Civano, F., Comastri, A., & Brusa, M., 2003, in preparation
- (37) Fabian, A.C., & Iwasawa, K., 1999, MNRAS, 303L, 34
- (38) Soltan, A., 1982, MNRAS, 200, 115
- (39) Ferrarese, L., & Merritt, D., 2000, ApJ, 539, L9
- (40) Fabian, A.C., 2003, proceeding of the conference: “Coevolution of Black Holes and Galaxies”, astro-ph/0304122
- (41) Elvis, M., Risaliti, G., Zamorani, G., 2002, ApJ 565, L75
- (42) Yu, Q., Tremaine, S., 2002, MNRAS 335, 965
- (43) Ferrarese, L., 2002, proceeding of the conference: “Hubble Science Legacy Workshop”, astro–ph/0207050