Observations of the SW Sextantis star DW Ursae Majoris with the Far Ultraviolet Spectroscopic Explorer111Based on observations with the NASA-CNES-CSA Far Ultraviolet Spectroscopic Explorer. FUSE is operated for NASA by the Johns Hopkins University under NASA contract NAS 5-32985.
Abstract
We present an analysis of the first far-ultraviolet observations of the SW Sextantis-type cataclysmic variable DW Ursae Majoris, obtained in November 2001 with the Far Ultraviolet Spectroscopic Explorer. The time-averaged spectrum of DW UMa shows a rich assortment of emission lines (plus some contamination from interstellar absorption lines including molecular hydrogen). Accretion disk model spectra do not provide an adequate fit to the far-ultraviolet spectrum of DW UMa. We constructed a light curve by summing far-ultraviolet spectra extracted in 60-sec bins; this shows a modulation on the orbital period, with a maximum near photometric phase 0.93 and a minimum half an orbit later. No other periodic variability was found in the light curve data. We also extracted spectra in bins spanning in orbital phase; these show substantial variation in the profile shapes and velocity shifts of the emission lines during an orbital cycle of DW UMa. Finally, we discuss possible physical models that can qualitatively account for the observed far-ultraviolet behavior of DW UMa, in the context of recent observational evidence for the presence of a self-occulting disk in DW UMa and the possibility that the SW Sex stars may be the intermediate polars with the highest mass transfer rates and/or weakest magnetic fields.
1 Introduction
Cataclysmic variables (CVs) are semi-detached binary stars in which a late main sequence star loses mass onto a white dwarf (WD) via Roche lobe overflow. In systems containing a non-magnetic WD, accretion proceeds through a viscous disk. In systems containing a magnetic WD, accretion may proceed directly from the L1 point onto the field lines in the strong field case, or through a partial disk in the case of intermediate field strength. The former systems are known as “polars” (owing to their highly polarized radiation), while the latter are “intermediate polars” (IPs). In polars, the strong WD magnetic field prevents the formation of a disk. In IPs, the field truncates only the inner edge of the disk, and material is accreted onto the WD through two accretion “curtains” (see review by Patterson 1994). See Warner (1995) for a thorough review of CV types and behavior.
Over a decade ago, three CVs (SW Sextantis, DW Ursae Majoris, and V1315 Aquilae) were proposed as the founding members of a new CV subclass, the “SW Sex stars” (Honeycutt, Schlegel, & Kaitchuck, 1986; Szkody & Piché, 1990; Thorstensen et al., 1991). Additional CVs matching the characteristics of the first three were subsequently identified. The original defining properties of the SW Sex stars are as follows (also see Thorstensen et al. 1991, Hoard 1998, and the review by Warner 1995):
-
•
They are “novalike” CVs. Unlike the more well-known dwarf nova class of CV, members of the novalike class do not undergo quasiperiodic outbursts. Novalikes are instead characterized by an approximately steady, high rate of mass transfer (and correspondingly prominent accretion disk) that quenches the disk instability mechanism responsible for dwarf nova outbursts.
-
•
Their optical light curves show deep eclipses of the WD+disk by the secondary star, requiring the system inclination to be high ().
-
•
They have orbital periods of 3–4 hr, just above the 2–3 hr “period gap” (in which few non-magnetic CVs are found) that is thought to arise during the secular evolution of CVs due to a change in angular momentum loss mechanism, likely triggered by mass-loss-induced evolution of the donor star (e.g., Shafter 1992, Howell, Nelson, & Rappaport 2001). This range of orbital periods is also associated with the largest range and highest extreme of predicted rates of mass transfer in CVs (Wu, Wickramasinghe, & Warner, 1995), above expectations from the standard theory for the secular evolution of CVs.
-
•
They display high levels of spectral excitation, including He II emission that is often comparable in strength to H.
-
•
Their spectra exhibit single-peaked emission lines rather than the double-peaked lines expected from near-edge-on disks.
-
•
The Balmer and He I emission lines are only shallowly (or not at all) eclipsed compared to the continuum (implying emission originating above the orbital plane).
-
•
The zero-crossings of their emission line radial velocities exhibit pronounced phase offsets relative to their eclipse ephemerides (implying a non-uniform distribution of emitting regions in the disk).
-
•
Transient absorption features appear in their Balmer and He I emission line cores, typically around photometric phase (i.e, the superior conjunction of the secondary star, opposite the eclipse).
The number of confirmed and probable SW Sex stars has now swelled to systems222See “The Big List of SW Sextantis Stars” at http://spider.ipac.caltech.edu/staff/hoard/research/swsex/biglist.html., including more than half (16 out of 30) of all securely identified novalike CVs with –4 hr. In part, this is due to accepting that “SW-Sexiness” does not have a rigid definition linked to a specific CV morphology. Rather, the original SW Sex stars represent extreme cases of a pathology that is present at some level in many high mass transfer rate CVs. Consequently, SW Sex behavior has been recognized in CVs that do not eclipse (e.g., V442 Ophiuchi – Hoard, Thorstensen, & Szkody 2000), have orbital periods outside the range 3–4 hr (e.g., BT Monocerotis – Smith, Dhillon, & Marsh 1998), or in which the transient absorption occurs outside the orbital phase range –0.6 (e.g., UU Aquarii – Hoard et al. 1998).
DW UMa is one of the three archetype SW Sex stars. It was first studied in detail by Shafter, Hessman, & Zhang (1988, also see ), who obtained extensive photometric and spectroscopic data. Optical light curves of DW UMa show a deep, V-shaped asymmetric eclipse, and short time scale variability with amplitude mag at orbital phases away from eclipse. These light curves do not contain a pre-eclipse hump (caused by a bright spot at the impact site of the accretion stream from the secondary star with the outer edge of the disk). The optical spectrum of DW UMa shows strong, single-peaked emission lines of H and He (I and II), as well as C II and the C III/N III Bowen blend. There is no evidence of a bright spot at optical wavelengths in either the light curve of DW UMa or more detailed studies based on Doppler tomography (Kaitchuck et al., 1994; Hoard, 1998).
Although the mass transfer process in novalike CVs is (on average) steady, some novalikes (the so-called VY Sculptoris stars) occasionally undergo low states in which mass transfer is severely reduced or shut off completely. When this happens, the accretion disk decreases in size or disappears completely, and the overall system brightness fades by several magnitudes. When DW UMa was observed with the Space Telescope Imaging Spectrograph (STIS) on the Hubble Space Telescope (HST) in January 1999, it had just dropped into such a low state. This allowed Knigge et al. (2000) to determine, via comparison with normal – or “high” – state spectra obtained with the International Ultraviolet Explorer (IUE), that the accretion disk in DW UMa completely obscures the WD during the high accretion state. They concluded that the disk in DW UMa increases in thickness from near the WD to its outer edge (i.e., it is a “flared” disk), and the optically thick outer rim of the disk is responsible for the self-occultation of the WD and inner disk. Recently, Araujo-Betancor et al. (2003) used these same HST data to determine reliable system parameters for DW UMa, including a mass ratio of (with ), inclination of , orbital separation of , and distance of –900 pc. In this paper, we present an analysis of the first far-ultraviolet (FUV) observations of DW UMa, obtained with the Far Ultraviolet Spectroscopic Explorer (FUSE).
2 Observations
We observed DW UMa with FUSE during 6 exposures (separated by Earth occultations) between HJD 2452221.26–2452221.62 (2001 November 07, 18:14 – November 08, 02:43 UT; see Table 1). All data were obtained using the LWRS aperture and TTAG accumulation mode (for FUSE spacecraft and instrument details see, for example, Sahnow et al. 2000333Also see the FUSE Science Center web page at http://fuse.pha.jhu.edu/.). We used the CalFuse v2.2.3 pipeline software to extract the FUV spectra from the raw data files obtained during each FUSE exposure. We then used a custom-built IDL routine (following the recipes in the FUSE Data Analysis Cookbook444See http://fuse.pha.jhu.edu/analysis/cookbook.html.) to combine the various detector and mirror segments of the spectra. This yields a time-averaged spectrum with a total equivalent exposure time of kiloseconds. We excluded the LiF1 data for –1149 Å in order to avoid the artifact known as “The Worm” (only the LiF2 data in this region are used). The final combined spectrum (see Figure 1) was rebinned onto a uniform wavelength scale with dispersion 0.05 Å pixel-1 by averaging flux points from the original dispersion (0.007 Å pixel-1) into wavelength bins of width 0.05 Å.
We also repeated the spectrum extraction as described above, but using custom screening files that exclude data obtained during satellite day (when airglow contamination is strongest). This results in a total effective exposure time of only kiloseconds (about 22% of the total day+night exposure). The night spectrum (see Figure 2) was rebinned to a dispersion of 0.10 Å pixel-1 in order to more closely match the signal-to-noise ratio (S/N) obtained in the longer day+night spectrum. Comparison between the two spectra clearly demonstrates which features are artifacts due to airglow. The night spectrum also reveals some DW UMa emission features that were effectively masked by airglow in the day+night spectrum (especially at the short wavelength end of the spectrum). Meanwhile, the much longer exposure time of the day+night spectrum allows us to resolve finer detail in the profiles of the emission lines (e.g., in the emission complex between 1105–1130 Å).
The time-averaged (day+night) FUSE spectrum of DW UMa has a mean continuum level of erg s-1 cm-2 Å-1, with a sharp cut-off at the Lyman limit. A number of narrow interstellar absorption lines of various metal ions, H I, and molecular hydrogen (see Section 3.1) are visible in the spectrum. Although contemporaneous photometric data are not available, the presence of this wide array of strong emission features in the FUV spectrum confirms that DW UMa was in the normal, high accretion state during our FUSE observations. Some lines that are prominently visible in the spectrum include: numerous H I (including Lyman-) and He I lines, O VI , the C III multiplet at 1175.3 Å, and many S III, S IV, Si III, and Si IV multiplets. These emission lines have complex profiles in which, often, several ionic species and/or multiplet transitions are blended together; the additional presence of airglow (emission) and interstellar (absorption) features further complicates many of the line profiles.
In Table 2, we have listed the equivalent widths (EWs) for several lines in the FUV spectrum of DW UMa (measured by direct integration of pixel values between manually selected continuum points using the “e” routine in the IRAF555The Image Reduction and Analysis Facility is distributed by the National Optical Astronomy Observatories, which are operated by the Association of Universities for Research in Astronomy, Inc., under cooperative agreement with the National Science Foundation. task splot). Except where noted in the table as approximate values, the EWs are reproducible to within 10%. Although these lines were selected to be comparatively isolated and/or resolved multiplet members, the presence of superimposed interstellar and/or airglow features makes the precise values of our directly measured EWs somewhat uncertain. For comparison, we have also provided the results of Gaussian fits to the emission line profiles (using the “k” routine in splot). The closely-spaced Lyman- and O VI doublet lines were fit simultaneously (using the “d” routine in splot), as was the S III multiplet. The night-only spectrum was used for the Lyman- and O VI measurements to reduce airglow contamination (the residual Lyman- airglow in the night-only spectrum was masked off). EWs for a few interstellar H I lines in regions with reliable adjacent continuum levels are also listed in Table 2.
3 Analysis
3.1 Molecular Hydrogen Absorption
The wavelength range over which FUSE observes is susceptible to contamination by absorption features of the ubiquitous interstellar molecular hydrogen in the lines of sight to targets of interest666In fairness, we note that to some observers, these molecular hydrogen lines are the interesting features in a FUSE spectrum.. We used the “H2tautemplates” from the H2ools package (McCandliss, 2003)777Also see http://www.pha.jhu.edu/$∼$stephan/h2ools2.html. to model the effect of interstellar molecular hydrogen absorption in our FUSE spectrum of DW UMa. The H2tautemplates tabulate molecular hydrogen optical depths as a function of wavelength (on a 0.01 Å grid), computed for a maximum column density of , that can be used to calculate normalized template spectra of the H2 absorption lines. Rotational states from j=0–15 are included (the vibrational state is fixed at 0). We considered a maximum rotational state of j=4 (rotational states above j=4 are difficult to observe in typical interstellar clouds; Shull et al. 2000). The calculated template spectra assume a uniform continuum level of 1.0, so they must be scaled to the mean flux level in the observed spectrum. This is problematic, however, because of the undulations in the observed FUSE spectrum of DW UMa caused by intrinsic continuum variation, as well as the presence of emission lines (some of which have superimposed H2 absorption lines). To account for this, we fit a high order spline function to the day+night FUSE spectrum (with the airglow and ISM lines masked off) in the wavelength region 1000–1185 Å (i.e., the higher S/N LiF data region). We then normalized this fit to a mean level of 1.0 in the continuum regions and multiplied it with the H2 template spectra in order to approximate the changing flux level of the observed spectrum at different wavelengths. In addition, we convolved the templates with a Gaussian kernel with FWHM of 0.06 Å to simulate the instrumental resolution of the FUSE spectrum (this value is in agreement with both the measured resolving power of FUSE888From the FUSE Observer’s Guide; see http://fuse.pha.jhu.edu/support/guide/obsguide.html. and the widths of the non-H2 ISM lines in our spectrum).
We determined the best fitting H2 absorption model by manually adjusting the parameters that affect the calculation of the template spectra (scaling factor, radial velocity shift, column density, Doppler parameter999The Doppler parameter is the sum – added in quadrature – of the thermal and turbulent velocities in the absorbing cloud. The threshold column density at which a given line begins to saturate will be lower (higher) for a low (high) Doppler parameter.) until a minimum r.m.s. deviation between the template and data, in selected regions containing H2 lines, was reached. The best value of each parameter can be determined essentially independent of the other parameters by considering different aspects of the observed spectrum whose behaviors are most affected by a given parameter. First, the overall level of the template spectrum is scaled to match the mean continuum level of the observed spectrum. As used here, this scaling factor is physically meaningless, and only serves to match the flux scales of the template and observed spectra. The radial velocity shift of the absorbing cloud can be determined even before reasonable values of the other parameters have been estimated by simply comparing the centers of the observed H2 absorption lines with those in the template. The molecular hydrogen column density must be made large enough that the weakest H2 features are present in the template. The Doppler parameter can then be adjusted until the saturation level of the strongest lines in the template matches the observed spectrum.
In this manner, we found that the best fitting molecular hydrogen absorption model has a column density (molecules cm-2) of , a radial velocity shift of km s-1, and a Doppler parameter of km s-1. Figure 3 shows representative sections of the best-fitting template spectrum superimposed on the day+night FUSE spectrum of DW UMa. The column density of our model is a moderate value relative to the range seen in surveys of the Galactic interstellar molecular hydrogen content (–21; Savage et al. 1977, Shull et al. 2000, and Richter et al. 2003). Besides the interstellar H I, C II, and Fe II lines indicated in our FUSE spectrum, almost all of the other narrow absorption features can be accounted for by interstellar molecular hydrogen absorption. In principle, it is possible that multiple discrete molecular hydrogen clouds along the line-of-sight will all contribute absorption with possibly different parameters of column density, velocity shift, etc. However, we see no compelling need for more than a single absorbing cloud to adequately (and conservatively) reproduce the H2 absorption lines present in the FUSE spectrum of DW UMa.
3.2 Near- and Far-Ultraviolet Spectrum
DW UMa was observed on two occasions with IUE, during November 1985 and February 1987 (Szkody, 1987). We retrieved the available spectra from the IUE archive, and have plotted them together with our FUSE spectrum in Figure 4. The IUE short wavelength spectrum is SWP27097 (4500 sec obtained on 1985 Nov 13), while the IUE long wavelength spectrum is the mean of LWP07086 and LWP07087 (2100 sec and 2400 s, respectively, obtained on 1985 Nov 13). The flux levels at the long and short wavelength ends of the FUSE and IUE spectra, respectively, match quite closely. Overall, DW UMa (in the high accretion state) is revealed to have a near-to-far UV (900–3300 Å) spectrum dominated by strong emission lines, and a continuum with a “bump” between 1300–2300 Å. As mentioned in Section 1, DW UMa was also observed in the UV using STIS+HST (Knigge et al., 2000); however, those data were obtained during an extreme low accretion state of the CV, so are not directly comparable to our high state FUSE spectrum.
3.2.1 Attempted Disk Spectrum Modeling
We attempted to fit various steady-state accretion disk model spectra to the combined FUSE + IUE spectrum of DW UMa using the methods described by Froning et al. (2001) and the accretion disk models used by Long et al. (1994). We masked off the emission line regions in the UV spectrum in order to include only the continuum regions in the model fits. We used the system parameters from Araujo-Betancor et al. (2003) to initialize the models; however, because the flared disk in DW UMa is expected to occult the WD in the high accretion state (Knigge et al., 2000), we did not include a contribution from a WD in our model spectra. None of our attempts at modeling the UV spectrum of DW UMa yielded fits that adequately reproduced the observed continuum shape. In all cases, the flux in the disk models increases more rapidly to the blue than is observed in the spectrum of DW UMa, and the observed bump (described above) is not recreated in the models.
Knigge et al. (2000) have shown that the disk of DW UMa in the high accretion state has a flared edge that completely obscures the WD. This would effectively “remove” the inner disk region from the FUV spectrum by blocking our view of it, and produce a flatter-than-expected continuum that is dominated by the cool disk rim. A similar situation was found during attempts to fit accretion disk models to the FUSE + IUE spectrum of the eclipsing novalike CV, UX Ursae Majoris (Froning, Long, & Knigge, 2003b). In that case also, the disk model that best fits the FUV spectrum increases in flux too rapidly toward its blue end to match the observed data, although the discrepancy is smaller than we found for DW UMa (Froning, Long, & Baptista, 2003a). Froning et al. (2003b, and references therein) suggest several possible factors that might contribute to this effect, including truncation of the inner disk (which would remove flux from the bluest wavelengths), or the presence of an additional source of continuum flux (such as an optically thin accretion disk chromosphere). We note that obscuration by a thick accretion disk rim might also suffice; however, the eclipses in UX UMa are U-shaped (Baptista et al., 1995), whereas a flared disk would be expected to produce eclipses that are more V-shaped (Knigge et al., 2000), as seen in DW UMa and other SW Sex stars. Consequently, one of the other mechanisms suggested by Froning et al. (2003b) may be more important in UX UMa. Our collaboration has recently received approval for new observations of DW UMa using STIS+HST that will take place during Cycle 12; these should lead to a better understanding of the disk geometry by providing new, high S/N, time-resolved, high accretion state UV spectra (which can be directly compared to the STIS low state spectra and combined with the FUSE data to extend the UV coverage to longer wavelengths for additional modeling attempts).
3.3 FUV Light Curves
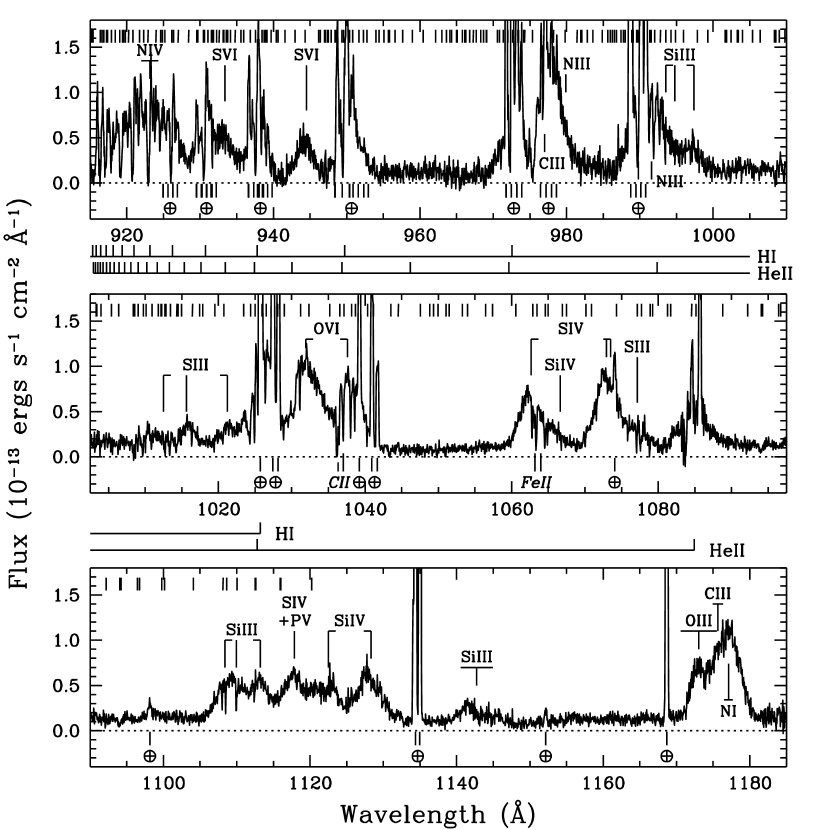
In order to explore any rapid FUV variability in DW UMa, we repeated the extraction process described in Section 2, but split each FUSE exposure into bins of 60 sec duration. This resulted in 44–56 spectra per exposure. The individual spectra are of too low S/N to be useful in their dispersed form, but by summing the fluxes over selected wavelength regions, we can construct FUV light curves for DW UMa. The top panel of Figure 5 shows the resultant light curves for continuum and emission line regions summed from the LiF2 spectra.
We performed period searches on the light curves using a number of methods: power spectrum analysis including application of the CLEAN algorithm (Roberts, Lehár, & Dreher, 1987), phase-dispersion-minimization (Stellingwerf, 1978), and sine-wave fitting with period as a free parameter (using custom IDL code). The only periodicity that we found corresponds to the orbital period of DW UMa ( sec, as refined from the ephemeris of Dhillon, Jones, & Marsh 1994 using an additional 14 optical eclipse timings obtained by Bíró 2000), along with two aliases of the signal. No coherent rapid variability on shorter time scales was detected. The top panel of Figure 6 shows the “dirty” (i.e., unCLEANed) power spectrum of the emission line light curve, with the orbital and alias peaks identified. Because the periodic variability in the light curve is not strictly sinusoidal, subtracting the sine fit leaves a residual of the orbital modulation that is still the strongest signal in the power spectrum (see the middle panel of Figure 6). Another iteration of subtracting a sine fit from the data, however, removes almost all of the orbital signal from the power spectrum (see the bottom panel of Figure 6). Yet, even with the modulation on removed, no other periodic signal is apparent in the power spectrum.
The middle and bottom panels of Figure 5 show the continuum and emission line data, respectively, folded on the orbital period of DW UMa. The modulation on is present in all three of the orbital periods of DW UMa spanned by the FUSE observations. The absolute amplitude of the modulation is larger in the emission line data, but the fractional semi-amplitude is comparable (–60% of the mean flux level) in both the emission line and continuum data. The phasings of the sine fits to the emission and continuum light curves are identical to within . We also examined additional continuum and emission line (e.g., O VI, C III) regions in the LiF2 spectra, as well as regions in the LiF1 spectra that either overlap with LiF2 regions or are unique to the LiF1 wavelength coverage. All regions show consistent characteristics and vary on ; the LiF2 data shown in Figure 5 are representative of the entire data set.
In the optical, the light curve of DW UMa does not show a pre-eclipse hump caused by a bright spot where the accretion stream strikes the outer edge of the disk, nor any other periodic, short time-scale variability other than the eclipse (e.g., Shafter, Hessman, & Zhang 1988; Dhillon, Jones, & Marsh 1994). Our FUV light curve, on the other hand, peaks shortly before the eclipse ( inferred from the sine fit shown in Figure 5) and has a minimum half an orbit later. This behavior is reminiscent of the orbital variability expected from irradiation-induced heating of the secondary star, but is out of phase with that mechanism (which should produce a maximum near , when the secondary star is viewed face-on). The coincidence of the phase of the observed FUV maximum with that expected for the pre-eclipse hump suggests that whatever is producing the modulation in our FUV light curve is related to the accretion flow.
3.4 Orbital-phase-resolved FUV Spectra
We repeated the spectral extraction yet again, this time using the photometric orbital ephemeris of Bíró (2000) to split the data into eight spectra corresponding to orbital phase bins centered around , , , , , , , and . The phase bins around and were not sampled during the FUSE observations. Table 3 gives total exposure times for the phase-resolved spectra and lists which FUSE exposures contributed to each spectrum. Sections of the phase-resolved spectra containing prominent emission lines are shown in Figures 7–9. There are obvious orbital-phase-dependent differences in the line profile shapes and velocity shifts, although none of the lines shows a clear “S-wave” signature (e.g., Honeycutt, Schlegel, & Kaitchuck 1987). Perhaps the best case for an S-wave is in the C III multiplet shown in Figure 9, in which the highest point in the line profile shifts from the red side of the emission profile at , to the blue side at –, then back to the red side at .
4 Discussion
4.1 Phenomenological Models for DW UMa
Of particular interest in Figure 9 are the narrow peaks seen in the C III emission profile in the (blue-shifted peak) and (red-shifted peak) phase bins. We verified that the peaks appear (with somewhat variable relative strengths) in data from each of the FUSE exposures that contribute to the time-resolved spectra for the and phase bins. The fact that these peaks are observed with opposite velocity shifts in spectra separated by half an orbit suggests that they originate from the same physical region in the CV. The separation and widths of the peaks imply a mean velocity of km s-1 and velocity dispersion of – km s-1, respectively, for the FUV emitting region. At the same time, the FUV light curve of DW UMa has a minimum at and a maximum at . Here, we explore the relative merit of several phenomenological models for the structure of DW UMa that might qualitatively account for this observed FUV behavior.
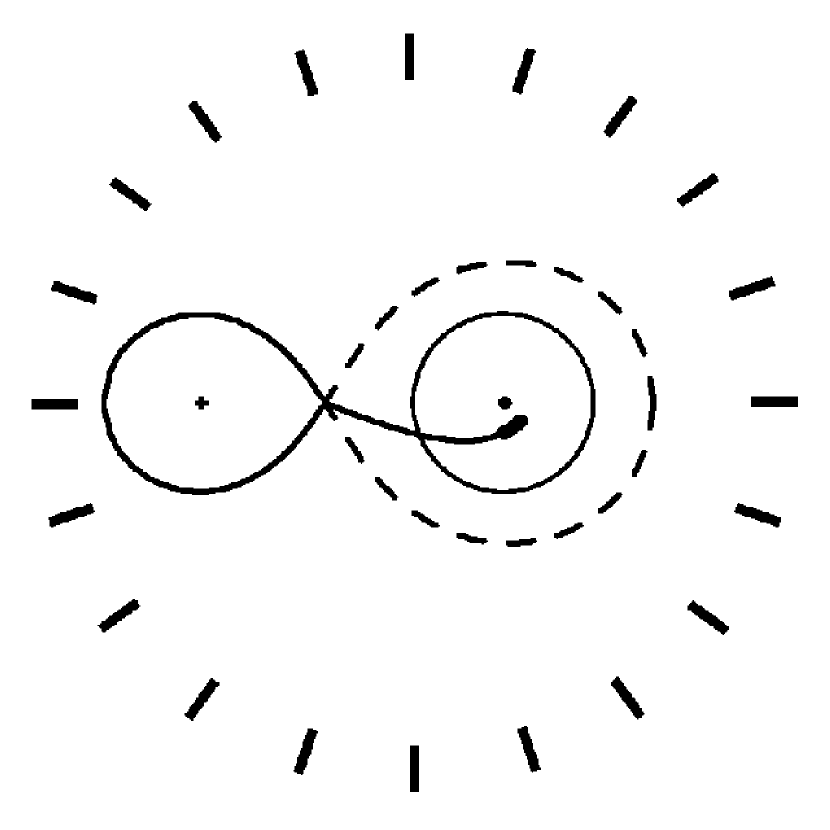
4.1.1 Model 1: Accretion with “Simple” Stream Overflow
Overflow of the accretion stream from its initial impact site with the disk edge and across the face of the disk (e.g., Lubow 1989, Hessman 1999) has been frequently proposed to play an important role in the origin of the SW Sex syndrome. A schematic diagram of a CV in which the stream continues over the disk face is shown in Figure 10. This is similar to the diagrams shown by Hellier & Robinson (1994) and Hellier (1996) in early attempts to explain the SW Sex stars. At , the terminus of the overflowing accretion stream is a kinematically plausible source for the red-shifted emission peak seen in DW UMa, since the stream trajectory (as well as the disk rotation) is directed approximately along this line-of-sight, in recession from the observer. Similarly, at , this region is viewed from the opposite side, with a net matter flow toward the observer, thereby producing the blue-shifted emission peak.
In the context of the SW Sex stars, the terminus of the overflowing accretion stream in the inner disk has also been blamed for the distribution of emission regions in their Doppler tomograms, their radial velocity curve phase offsets, and the presence of the transient absorption feature. However, in the case of DW UMa (and, by extension, possibly the other SW Sex stars also), this model has a fatal flaw. Knigge et al. (2000) concluded that the disk in DW UMa is strongly flared, and self-occults the WD and inner disk region. This would make it difficult (perhaps even impossible, when the disk is oriented with the stream terminus on the side closest to us) to observe the stream terminus in the inner disk, especially in a high inclination CV. This conclusion is supported by the FUSE spectra presented here, which show too little blue flux compared to accretion disk model spectra, indicating that (one way or another) the inner disk is not contributing to the spectrum.
4.1.2 Model 2: Accretion with “Complex” Stream Overflow
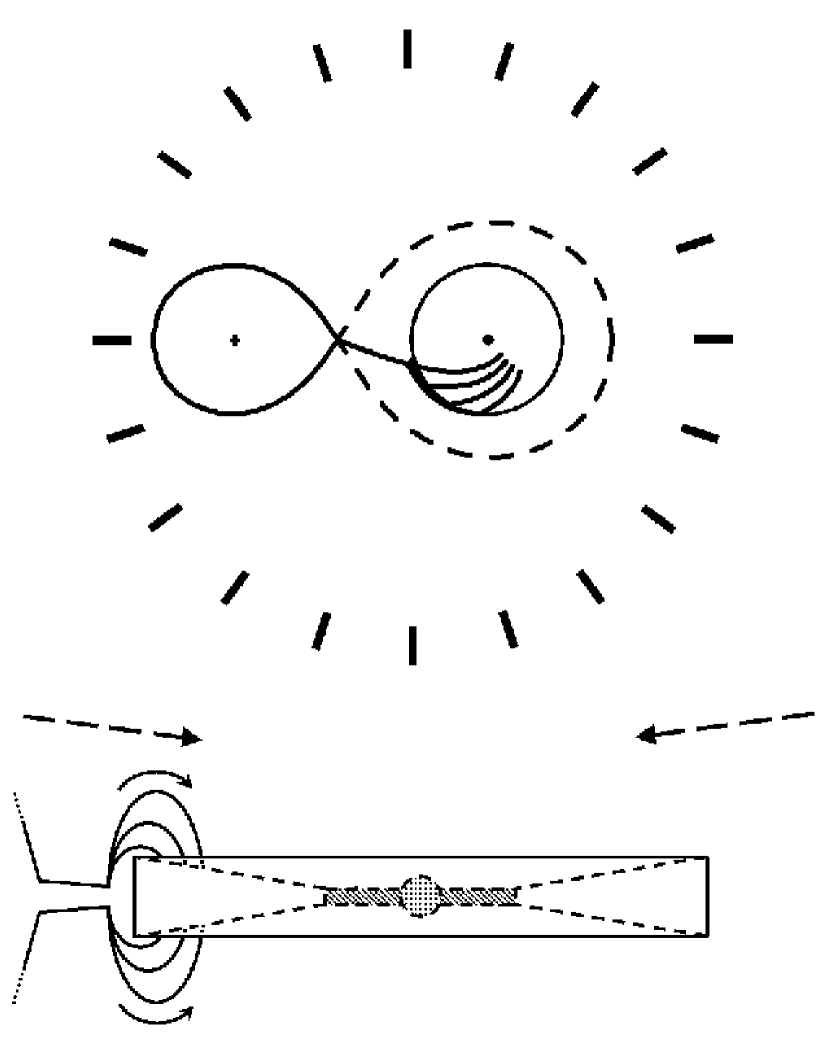
One way to overcome obscuration by a flared disk in a high inclination CV like DW UMa is to shift the emission region from the inner to outer disk. Simulations of the stream-disk interaction in CVs (e.g., Armitage & Livio 1996, 1998; Kunze, Speith, & Hessman 2001) have shown that the stream impact can result in an explosive “splash” that sends stream material along the edge of the disk (in the direction of disk rotation) and to substantial vertical height out of the disk plane. Figure 11 shows a schematic diagram of a CV with complex stream overflow in which stream material splashes up against the disk edge, and is swept down the edge of the disk, resulting in a “fan” of overflowing material. A model of this type for the SW Sex stars has also been extensively developed by Hoard (1998), Hoard et al. (1998), and Hoard, Thorstensen, & Szkody (2000), so we will not reproduce those discussions in detail here. As with Model 1, this model can account for the velocity-shift behavior of the C III emission line peaks. More importantly, both the location of the stream flow near the disk edge, and its vertical extension above the plane of the disk, allow the emitting region to be seen at high inclination despite the flared disk. A possible problem with this model is that the velocity dispersion of emitting material in the fan of overflowing material might be expected to be larger than that inferred from the widths of the narrow line peak components seen in DW UMa.
This model also offers a possible explanation for the FUV light curve of DW UMa, if the overflowing material initially emits strongly in the FUV (when it is visible along the sightline) but not after it is flowing over the disk (when it is visible along the sightline). Essentially, this is the same mechanism that produces a pre-eclipse hump in the light curves of CVs that have a bright spot where the accretion stream initially impacts the edge of the disk (but does not produce a hump in the light curve half an orbit later when the “back” side of the bright spot is visible). Unfortunately, this is difficult to reconcile with the lack of a bright spot in optical light curves of DW UMa, unless we speculate that the accretion stream impact/overflow site is uniformly hot enough that it emits only a negligible amount of luminosity in the optical wavelength range. (In principle, this is problematic for all three models discussed here, since they all involve stream overflow that might produce a bright spot; however, a prominent initial stream impact resulting in enhanced vertical structure on the disk rim plays a key role in Model 2.)
4.1.3 Model 3: Stream-fed Accretion in an Intermediate Polar
The physical geometry of an IP (i.e., a truncated inner disk with magnetically-controlled accretion curtains through which material flows from the inner disk edge to the WD) could account for many of the peculiar observational properties that originally defined the SW Sex stars, if: (1) the single-peaked line profiles arise in a magnetic accretion curtain close to the WD; (2) the shallow eclipse of low excitation lines results because material following the field lines initially rises above the disk plane; and (3) self-absorption in the accretion curtain accounts for the transient absorption feature. Thus, it is little surprise that recently there has been an increasing trend in the relevant literature to invoke a magnetic scenario for the SW Sex stars. Before we discuss such a model in application to DW UMa, and in the interest of providing a reference for future discussion, we summarize here key points of evidence culled from various literature sources that support a magnetic scenario for the SW Sex stars:
-
•
Perhaps the most blatant piece of evidence is that the observational properties of some CVs have caused them to be independently classified as both possible IPs/magnetic CVs and as possible SW Sex stars – see the summary in Table 4.
- •
-
•
“Flaring” in optical emission lines on time scales of tens of minutes, which is suggestive of the asynchronous spin of the WD in an IP, is present in DW UMa, V533 Herculis, BT Mon, and LS Peg (Szkody et al. 2001, Rodríguez-Gil & Martínez-Pais 2002 and references therein). The circular polarization observed in LS Peg and V795 Her is also modulated on similar time scales.
-
•
Patterson et al. (2002) observed superhumps and kilosecond QPOs in optical light curves of numerous SW Sex stars that can be ascribed to the presence of a WD magnetic field. (Note: these authors suggest that the magnetic fields in SW Sex stars are comparable in strength to the highly magnetic polars, rather than being the weakest of the IPs, as is commonly asserted in other literature sources.)
-
•
Hot spots in the disks of SW Sex stars that are revealed by eclipse mapping and/or Doppler tomography might be produced when the overflowing accretion stream encounters the WD magnetosphere; for example, as speculated by Rodríguez-Gil et al. (2001b) for the observations of SW Sex by Groot, Rutten, & van Paradijs (2001).
-
•
The typical Doppler tomograms of SW Sex stars (e.g., Kaitchuck et al. 1994; Hoard 1998) might also be explained by a magnetic propellor mechanism in which some material in the overflowing accretion stream is ejected from the inner disk by the spinning WD magnetosphere (Horne, 1999). (Note: this is a somewhat extreme variant of the magnetic scenario for SW Sex stars; to our knowledge, little additional work has been presented in support of it.)
-
•
Optical eclipse mapping studies of DW UMa (Bíró, 2000), SW Sex (Groot, Rutten, & van Paradijs, 2001), V1315 Aql, and other SW Sex stars (e.g., Rutten, van Paradijs, & Tinbergen 1992) show that their disk temperature profiles are best reproduced by assuming that the inner disk is suppressed or missing, as in the IPs. These results are somewhat ambiguous, as the temperature profiles could also be attributed to obscuration by the rim of a flared accretion disk. Knigge et al. (2000) showed that the V-shaped eclipses seen in DW UMa and other SW Sex stars can be accounted for by the flared accretion disk.
-
•
The low inclination SW Sex stars V795 Her (Casares et al., 1996), LS Peg (Martínez-Pais, Rodríguez-Gil, & Casares, 1999; Taylor, Thorstensen, & Patterson, 1999), and V442 Oph (Hoard, Thorstensen, & Szkody, 2000) display Balmer emission line components extending to large velocity offsets from the line centers (– km s-1), which produce prominent orbital S-waves in trailed spectra of these systems. It has been suggested (e.g., Martínez-Pais, Rodríguez-Gil, & Casares 1999) that these components are present in the high inclination systems also, but at smaller velocity offsets such that they do not detach from the emission line cores and are, instead, visible as wings of the Balmer lines. This behavior would require the emitting material responsible for the narrow components to have a vertical extent that allows a larger radial velocity to be seen at lower inclination. While this is consistent with the expected structure for the magnetically-controlled accretion flow in a polar or IP, it also might be explained by a non-magnetic model involving emitting material located out of the disk plane (e.g., Model 2 in Section 4.1.2).
-
•
Several SW Sex stars (including DW UMa) are also VY Scl stars. Hameury & Lasota (2002) have shown that the presence of a magnetic WD can suppress dwarf nova outbursts during the characteristic low states of the VY Scl stars (when the mass transfer rate is small enough that the disk instability mechanism is no longer quenched). We note, however, that (as described by Hameury & Lasota 2002) the presence of a low mass () and/or very hot ( K) WD can also suppress dwarf nova outbursts during VY Scl low states. The system parameters determined by Araujo-Betancor et al. (2003) show that DW UMa does not satisfy the former condition (), but it does satisfy the latter ( K). Thus, a magnetic field is not necessarily required to suppress dwarf nova outbursts in DW UMa or other SW Sex stars with hot WDs. In addition, Hameury & Lasota (2002) do not seem to have accounted for the fact that hotter WDs are larger (Koester & Schönberner, 1986), which (according to Equation 3 in Hameury & Lasota 2002) would cause dwarf nova outbursts to be suppressed at a lower WD temperature101010A more fundamental issue is that the low states of SW Sex stars may not have been well-enough observed to rule out the presence of dwarf nova outbursts. For example, the long-term optical light curve of DW UMa presented by Honeycutt, Livio, & Robertson (1993) has only sparse sampling of the low state. The light curve shows several isolated data points during low states that are brighter by a magnitude or more compared to the typical low state brightness. These might correspond to poorly sampled outbursts..
The lack of rapid coherent modulations (period a few kiloseconds) in our FUV light curve of DW UMa is an important factor that argues against a standard IP geometry for this CV. Such modulations are seen in known IPs across a wide wavelength range, and are the hallmarks of the asynchronous spin of the WD (Patterson, 1994). We are, perhaps, saved in this case because the WD in DW UMa is hidden by the disk in the high accretion state. Even so, we might expect to detect the spin period via reprocessing of light in other parts of the CV that are visible to us. As mentioned above, emission line “flaring” with a characteristic time scale on the order of several tens of minutes, which may be linked to the spin of a magnetic WD, has been tentatively identified in DW UMa in the optical. However, this does not help to explain the FUV behavior of this CV, which shows interesting spectral and photometric variability modulated only on the orbital period, instead of any putative, shorter WD spin period.
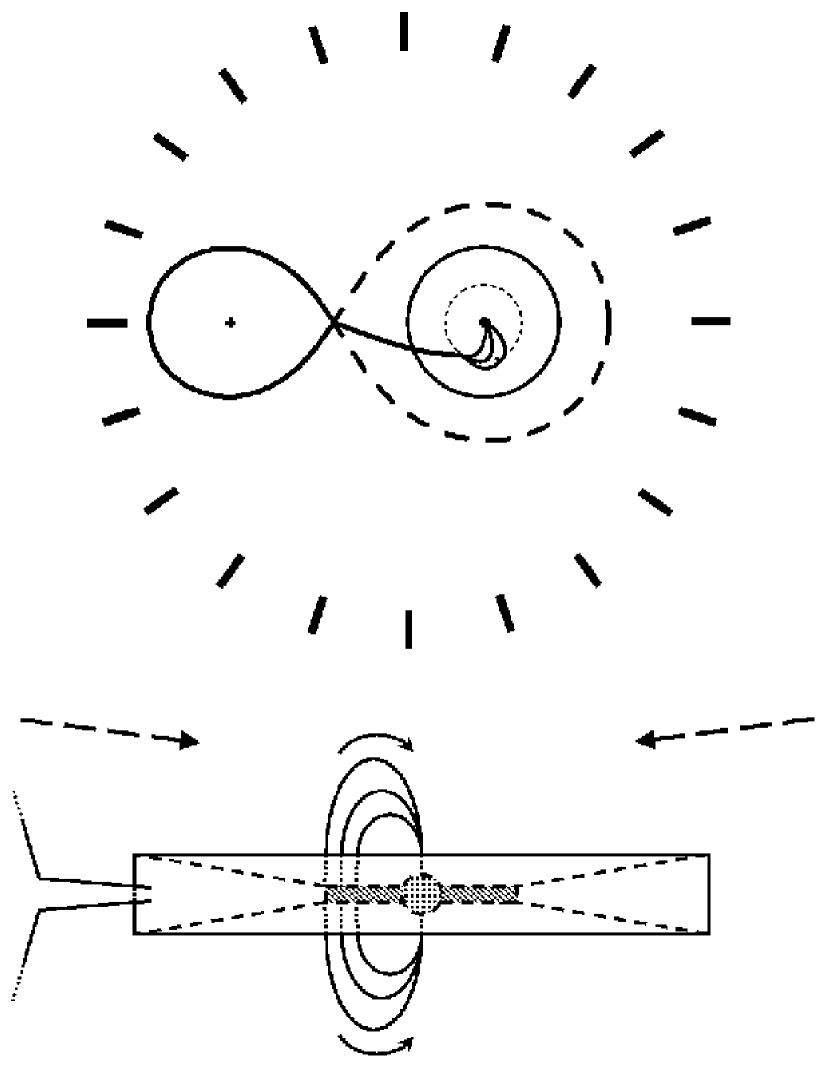
An alternative to the standard, accretion-curtain model for IPs is a stream-fed scenario, in which matter in an overflowing accretion stream encounters the WD magnetosphere at the inner edge of the truncated disk (e.g., Hellier 1993, Norton et al. 1997, Ferrario & Wickramasinghe 1999). The stream material is then entrained onto the field lines and funneled onto the WD. Groot, Rutten, & van Paradijs (2001) suggested that SW Sex itself shows evidence for a shocked hot spot in the inner disk that could occur when the overflowing stream hits the spinning magnetosphere. In this model (which is depicted schematically in Figure 12), the FUV-emitting region is moved back toward the inner disk, but the vertical extension of the accretion funnel above the plane of the disk allows us to observe it despite the obscuring rim of the flared disk. In principle, there should be two symmetric (more or less) funnels above and below the disk; geometric effects could cause only one of these to be visible in some systems. Hereafter, we assume a basic structure for the accretion funnel (e.g., Ferrario & Wehrse 1999) in which it is broad at the base (where it emanates from the stream overflow at the inner edge of the truncated disk) and narrow at the tip (where it connects to the pole of the WD); both temperature and density increase from base to tip. In general, the bottom side of the funnel (facing the WD+disk) will be hotter than the top side, because the former is irradiatively heated by the WD; the front side of the funnel (facing the WD) will be hotter than the back side because of both irradiative heating from the WD and the intrinsic temperature profile of the funnel.
Model 3 is different from the standard IP scenario, in that the location of the accretion funnel is tied to the overflowing stream trajectory in the disk, so it does not rotate with the WD like the accretion curtains do. If the magnetic axis of the WD is not severely misaligned with its spin axis, then this results in a persistent accretion funnel extending from the terminus of the overflowing stream onto the polar region of the WD. The spinning accretion curtains of a standard IP may or may not also be present; however, the lack of a short spin period modulation in our FUSE data implies that if they are present in DW UMa, then they are either not visible or do not contribute significantly in the FUV. If the magnetic and spin axes of the WD are misaligned, causing the tip of the funnel to “follow” the spin of the magnetic pole, then this could introduce a modulation on (or more likely on the beat period between and ) into the light curves, whose amplitude increases as the misalignment increases. Alternatively, the “active” funnel might switch between above and below the disk as the WD spins, to accomodate accretion onto the more geometrically favorable pole. Again, this could result in a modulation on . Clearly, the lack of detectable WD spin modulations, although mitigated somewhat in Model 3 compared to a standard IP model, is a hindrance to magnetic models for the SW Sex stars.
In DW UMa, near (before eclipse when the secondary star blocks our view of the disk), we see a maximum in the FUV light curve caused by the luminosity of the back side of the accretion funnel. A red-shifted peak is produced in the C III emission line because from that perspective, material in the funnel is flowing away from us with a relatively small velocity dispersion. At quadrature phases, we see only a moderate brightness in the FUV light curve due to the smaller projected area of the “side” of the accretion funnel. At the same time, there is little or no evidence for a preferred velocity shift in the line profile because the matter flow is mostly tangential to this line-of-sight. This is the perspective looking into the page at the bottom sketch in Figure 12. Near , we see primarily the front side of the accretion funnel. This produces a blue-shifted emission peak because material in the funnel is moving towards us along this line-of-sight. The FUV light curve displays a minimum at this phase because less FUV luminosity in the FUSE sensitivity band (i.e., – Å for the light curves shown here) is emitted from the hotter front side of the funnel than from the cooler back side. The front side has a smaller projected surface area than the back side, so we still see some of the back side; however, this is the bottom of the back side, which is also hotter than the top of the back side (which is viewed at ). This difference between the temperatures and emissive properties of the front and back sides of the funnel is supported by the difference in the profile shapes of the corresponding emission line peaks: the red-shifted, back-side peak is stronger and broader than the blue-shifted, front-side peak.
5 Conclusions
We have presented the first FUV spectra of the archetype SW Sex star, DW UMa, which are dominated by broad emission lines of a variety of ions of H, C, N, O, Si, and S. The emission lines vary in flux, profile shape, and velocity shift during the orbit of the CV; in particular, the C III emission complex at 1178 Å shows S-wave-like profile variations as a function of orbital phase. The relatively weak continuum in the time-averaged spectrum is difficult to model in terms of a steady state accretion disk. Although there are no coherent, short time scale periodicities ( a few kiloseconds) in the FUV light curves of DW UMa, both the continuum and line fluxes vary on the orbital phase, with a maximum at (just prior to the inferior conjunction of the secondary star – i.e., the eclipse) and a minimum half an orbit later.
It is clear from our FUSE observations that DW UMa displays substantial activity in the FUV wavelength regime. The hot inner region of this high-inclination CV, close to the WD (i.e., the canonical origin for high energy luminosity in disk-fed CVs), is believed to be self-occulted by a flared accretion disk rim; it may even be missing altogether, truncated by a spinning WD magnetosphere. This effectively rules out a “simple” stream overflow model (at least for high inclination SW Sex stars) in which the inner disk must be visible at all phases to account for their observational properties. Our FUSE data did not yield direct evidence linking DW UMa to the IP class of magnetic CVs. Nonetheless, the stream-fed IP scenario described in Section 4.1.3 offers at least a qualitative explanation for the FUV behavior of DW UMa. Observational evidence continues to mount that magnetic fields may play a key role in causing the SW Sex syndrome that has infected many novalike CVs. The SW Sex stars may indeed be the IPs with the highest mass accretion rates and/or weakest magnetic fields. That said, the IP model is certainly not demanded by our FUSE data. The lack of rapid coherent modulations in our FUV light curves of DW UMa, corresponding to the WD spin, casts doubt on the IP scenario. The “complex” accretion stream overflow model (see Section 4.1.2) can, arguably, offer an equally satisfactory explanation, especially when considered in conjunction with the presence of a flared, self-occulting accretion disk in DW UMa. We note, however, that these two models are not necessarily mutually exclusive and could operate simultaneously, with each mechanism contributing differently in different SW Sex stars. In particular, the model that (eventually) successfully explains the SW Sex stars (including the several known low-inclination systems) cannot rely solely on the presence of a flared disk, which is most explanatory in high inclination systems. Compelling evidence for the magnetic nature of the SW Sex stars would include reliable and repeatable detections, for many SW Sex stars, of both polarization and coherent modulations that can be securely linked to WD spin.
References
- Araujo-Betancor et al. (2003) Araujo-Betancor, S. et al. 2003, ApJ, 583, 437
- Armitage & Livio (1996) Armitage, P. J., & Livio, M. 1996, ApJ, 470, 1024
- Armitage & Livio (1998) Armitage, P. J., & Livio, M. 1998, ApJ, 493, 898
- Baptista et al. (1995) Baptista, R., Horne, K., Hilditch, R. W., Mason, K. O., & Drew, J. E. 1995, ApJ, 448, 395
- Bíró (2000) Bíró, I. B. 2000, A&A, 364, 573
- Casares et al. (1996) Casares, J., Martinez-Pais, I. G., Marsh, T. R., Charles, P. A., & Lazaro, C. 1996, MNRAS, 278, 219
- Dhillon, Jones, & Marsh (1994) Dhillon, V. S., Jones, D. H. P., & Marsh, T. R. 1994, MNRAS, 266, 859
- Dickinson et al. (1997) Dickinson, R. J., Prinja, R. K., Rosen, S. R., King, A. R., Hellier, C., & Horne, K. 1997, MNRAS, 286, 447
- Feldman et al. (2001) Feldman, P. D., Sahnow, D. J., Kruk, J. W., Murphy, E. M., & Moos, H. W. 2001, J. Geophys. Res., 106, 8119
- Ferrario & Wehrse (1999) Ferrario, L., & Wehrse, R. 1999, MNRAS, 310, 189
- Ferrario & Wickramasinghe (1999) Ferrario, L.,& Wickramasinghe, D. T. 1993, MNRAS, 309, 517
- Froning et al. (2001) Froning, C. S., Long, K. S., Drew, J. E., Knigge, C., & Proga, D. 2001, ApJ, 562, 963
- Froning, Long, & Baptista (2003a) Froning, C. S., Long, K. S., & Baptista, R. 2003, AJ, in press (astro-ph/0304328)
- Froning, Long, & Knigge (2003b) Froning, C. S., Long, K. S., & Knigge, C. 2003, ApJ, 584, 433
- Groot, Rutten, & van Paradijs (2001) Groot, P. J., Rutten, R. G. M., & van Paradijs, J. 2001, A&A, 368, 183
- Hameury & Lasota (2002) Hameury, J.-M., & Lasota, J.-P. 2002, A&A, 394, 231
- Hellier (1993) Hellier, C. 1993, PASP, 105, 966
- Hellier (1996) Hellier, C. 1996, ApJ, 471, 949
- Hellier et al. (2000) Hellier, C., Kemp, J., Naylor, T., Bateson, F. M., Jones, A., Overbeek, D., Stubbings, R., & Mukai, K. 2000, MNRAS, 313, 703
- Hellier & Robinson (1994) Hellier, C., & Robinson, E. L. 1994, ApJ, 431, L107
- Hessman (1999) Hessman, F. V. 1999, ApJ, 510, 867
- Hoard (1998) Hoard, D. W. 1998, PhD dissertation (U. of Washington)
- Hoard et al. (1998) Hoard, D. W., Still, M. D., Szkody, P., Smith, R. C., & Buckley, D. A. H. 1998, MNRAS, 294, 689
- Hoard, Thorstensen, & Szkody (2000) Hoard, D. W., Thorstensen, J. R., & Szkody, P. 2000, ApJ, 537, 936
- Honeycutt, Livio, & Robertson (1993) Honeycutt, R. K., Livio, M., & Robertson, J. W. 1993, PASP, 105, 922
- Honeycutt, Schlegel, & Kaitchuck (1986) Honeycutt, R. K., Schlegel, E. M., & Kaitchuck, R. H. 1986, ApJ, 302, 388
- Honeycutt, Schlegel, & Kaitchuck (1987) Honeycutt, R. K., Schlegel, E. M., & Kaitchuck, R. H. 1987, ApJS, 65, 451
- Horne (1999) Horne, K. 1999, Annapolis Workshop on Magnetic Cataclysmic Variables, ASP Conf. Ser. 157, eds. C. Hellier, K. Mukai (San Fransisco: ASP), 349
- Howell, Nelson, & Rappaport (2001) Howell, S. B., Nelson, L. A., & Rappaport, S. 2001, ApJ, 550, 897
- Kaitchuck et al. (1987) Kaitchuck, R. H., Hantzios, P. A., Kakaletris, P., Honeycutt, R. K., & Schlegel, E. M. 1987, ApJ, 317, 765
- Kaitchuck et al. (1994) Kaitchuck, R. H., Schlegel, E. M., Honeycutt, R. K., Horne, K., Marsh, T. R., White, J. C., & Mansperger, C. S. 1994, ApJS, 93, 519
- Knigge et al. (2000) Knigge, C., Long, K. S., Hoard, D. W., Szkody, P., & Dhillon, V. S. 2000, ApJ, 539, L49
- Koester & Schönberner (1986) Koester, D., & Schönberner, D. 1986, A&A, 154, 125
- Kunze, Speith, & Hessman (2001) Kunze, S., Speith, R., & Hessman, F. V. 2001, MNRAS, 322, 499
- Long et al. (1994) Long, K. S., Wade, R. A., Blair, W. P., Davidsen, A. F., & Hubeny, I. 1994, ApJ, 426, 704
- Lubow (1989) Lubow, S. H. 1989, ApJ, 340, 1064
- Martínez-Pais, Rodríguez-Gil, & Casares (1999) Martínez-Pais, I. G., Rodríguez-Gil, P., & Casares, J. 1999, MNRAS, 305, 661
- McCandliss (2003) McCandliss, S. R. 2003, PASP, in press (astro-ph/0302070)
- Norton et al. (1997) Norton, A. J., Hellier, C., Beardmore, A. P., Wheatley, P. J., Osborne, J. P., & Taylor, P. 1997, MNRAS, 289, 362
- Patterson (1979) Patterson, J. 1979, ApJ, 233, L13
- Patterson (1994) Patterson, J. 1994, PASP, 106, 209
- Patterson et al. (2002) Patterson, J. et al. 2002, PASP, 114, 1364
- Richter et al. (2003) Richter, P., Wakker, B. P., Savage, B. D., & Sembach, K. R. 2003, ApJ, 586, 230
- Roberts, Lehár, & Dreher (1987) Roberts, D. H., Lehár, J., & Dreher, J. W. 1987, AJ, 93, 968
- Rodríguez-Gil et al. (2001a) Rodríguez-Gil, P., Casares, J., Martínez-Pais, I. G., & Hakala, P. 2001a, The Physics of Cataclysmic Variables and Related Objects, ASP Conf. Ser. 261, eds. B. T. Gänsicke, K. Beuermann, K. Reinsch (San Fransisco: ASP), 533
- Rodríguez-Gil et al. (2001b) Rodríguez-Gil, P., Casares, J., Martínez-Pais, I. G., Hakala, P., & Steeghs, D. 2001b, ApJ, 548, L49
- Rodríguez-Gil & Martínez-Pais (2002) Rodríguez-Gil, P., & Martínez-Pais, I. G. 2002, MNRAS, 337, 209
- Rodríguez-Gil et al. (2001c) Rodríguez-Gil, P., Martínez-Pais, I. G., Casares, J., Villada, M., & van Zyl, L. 2001, MNRAS, 328, 903
- Rosen et al. (1994) Rosen, S. R., Clayton, K. L., Osborne, J. P., & McGale, P. A. 1994, MNRAS, 269, 913
- Rosen et al. (1998) Rosen, S. R., Prinja, R. K., Drew, J. E., Mason, K. O., & Howell, S. B. 1998, MNRAS, 299, 305
- Rosen et al. (1995) Rosen, S. R., Watson, T. K., Robinson, E. L., Prinja, R. K., Misselt, K., & Shafter, A. W. 1995, A&A, 300, 392
- Rutten, van Paradijs, & Tinbergen (1992) Rutten, R. G. M., van Paradijs, J., & Tinbergen, J. 1992, A&A, 260, 213
- Sahnow et al. (2000) Sahnow, D. J. et al. 2000, Proc. SPIE, 4013, 334
- Savage et al. (1977) Savage, B. D., Drake, J. F., Budich, W., & Bohlin, R. C. 1977, ApJ, 216, 291
- Shafter (1992) Shafter, A. W. 1992, ApJ, 394, 268
- Shafter, Hessman, & Zhang (1988) Shafter, A. W., Hessman, F. V., & Zhang, E. H. 1988, ApJ, 327, 248
- Shafter et al. (1990) Shafter, A. W., Robinson, E. L., Crampton, D., Warner, B., & Prestage, R. M. 1990, ApJ, 354, 708
- Shull et al. (2000) Shull, J. M. et al. 2000, ApJ, 538, L73
- Smith, Dhillon, & Marsh (1998) Smith, D. A., Dhillon, V. S., & Marsh, T. R. 1998, MNRAS, 296, 465
- Stellingwerf (1978) Stellingwerf, R. F. 1978, ApJ, 224, 953
- Szkody (1987) Szkody, P. 1987, AJ, 94, 1055
- Szkody & Piché (1990) Szkody, P., & Piché, F. 1990, ApJ, 361, 235
- Szkody et al. (2001) Szkody, P. et al. 2001, presented at the Cataclysmic Variable and X-ray Binary Workshop, Manchester, UK
- Taylor, Thorstensen, & Patterson (1999) Taylor, C. J., Thorstensen, J. R., & Patterson, J. 1999, PASP, 111, 184
- Thorstensen et al. (1991) Thorstensen, J. R., Ringwald, F. A., Wade, R. A., Schmidt, G. D., & Norsworthy, J. E. 1991, AJ, 102, 272
- Thorstensen & Taylor (2000) Thorstensen, J. R., & Taylor, C. J. 2000, MNRAS, 312, 629
- Tuohy et al. (1990) Tuohy, I. R., Remillard, R. A., Bradt, H. V., & Brissenden, R. J. V. 1990, ApJ, 359, 204
- Vogt, Krzeminski, & Sterken (1980) Vogt, N., Krzeminski, W., & Sterken, C. 1980, A&A, 85, 106
- Warner (1995) Warner, B. 1995, Cataclysmic Variable Stars (Cambridge: Cambridge University Press)
- White, Schlegel, & Honeycutt (1996) White, J. C., Schlegel, E. M., & Honeycutt, R. K. 1996, ApJ, 456, 777
- Wu, Wickramasinghe, & Warner (1995) Wu, K., Wickramasinghe, D. T., & Warner, B. 1995, ApSSL, 205, 315
- Zhang (1988) Zhang, E. 1988, Acta Astrophys. Sin., 8, 251
- Zhang et al. (1991) Zhang, E., Robinson, E. L., Ramseyer, T. F., Shetrone, M. D., & Stiening, R. F. 1991, ApJ, 381, 534
| Exposure | Start Time | Total Exposure | aaOrbital phase at start of exposure from the ephemeris of Bíró (2000). |
|---|---|---|---|
| # | (HJD2450000) | (s) | |
| 1 | 2221.260217 | 3256 | 0.059 |
| 2 | 2221.329574 | 3330 | 0.567 |
| 3 | 2221.398896 | 3332 | 1.074 |
| 4 | 2221.469028 | 3264 | 1.587 |
| 5 | 2221.541579 | 2988 | 2.119 |
| 6 | 2221.613471 | 2668 | 2.645 |
| Gaussian Fit | |||
|---|---|---|---|
| Line | EW | EW | FWHM |
| (Å) | (Å) | (km s-1) | |
| H I aaISM absorption line. | 0.29 | ||
| H I aaISM absorption line. | 0.31 | ||
| H I aaISM absorption line. | 0.33 | ||
| H I aaISM absorption line. | 0.26 | ||
| S VI | 11.5 | 12.7 | 815 |
| S III | 2.0 | 730 | |
| S III bbBlend of multiplet transitions. | 2.7 | 3.0 | 575 |
| S III bbBlend of multiplet transitions. | 3.7 | 795 | |
| H I ccBlended airglow line is masked off. | 36.3 | 1000 | |
| O VI | 47.3 | 45.1 | 1245 |
| O VI ddAffected by interstellar absorption. | 23.6 | 27.5 | 1075 |
| S IV d,e,fd,e,ffootnotemark: | 21.7 | 20.9 | 1250 |
| S IV b,d,e,gb,d,e,gfootnotemark: | 34.7 | 29.3 | 1120 |
| Si III bbBlend of multiplet transitions. | 10.5 | 11.9 | 1585 |
| Orbital Phase | Data from | Total |
|---|---|---|
| Bin CenteraaBin widths are . | Exposures | Exposure |
| (s) | ||
| 0.1 | 1, 3, 5 | 2340 |
| 0.2 | 1, 3, 5 | 3540 |
| 0.3 | 1, 3, 5 | 3360 |
| 0.4 | 3, 5 | 330 |
| 0.6 | 2, 4, 6 | 1780 |
| 0.7 | 2, 4, 6 | 3540 |
| 0.8 | 2, 4, 6 | 3525 |
| 0.9 | 4, 6 | 410 |
| CV Name | IP ClassificationaaWe have only listed here those CVs that were considered as possible magnetic systems before they were considered as possible SW Sex stars. With the advent, circa 1996, of the IP-like model for SW Sex stars, there is no shortage of CVs that have been recently considered simultaneously as possible IPs and SW Sex stars. | SW Sex star Classifiation |
|---|---|---|
| TT Arietis | Patterson (1994) | Patterson et al. (2002) |
| V533 Herculis | Patterson (1994) | Rodríguez-Gil & Martínez-Pais (2002) |
| Patterson (1979) | Thorstensen & Taylor (2000) | |
| V795 Herculis | Patterson (1994) | Dickinson et al. (1997)bbThese authors suggest a possible magnetic scenario for V795 Her as an SW Sex star. Rosen et al. (1995, 1998) argue against, but do not rule out, an IP model for V795 Her. |
| Zhang et al. (1991) | Casares et al. (1996)bbThese authors suggest a possible magnetic scenario for V795 Her as an SW Sex star. Rosen et al. (1995, 1998) argue against, but do not rule out, an IP model for V795 Her. | |
| Shafter et al. (1990) | ||
| EX Hydrae | Patterson (1994) | Hellier et al. (2000) |
| Kaitchuck et al. (1987) | ||
| Vogt, Krzeminski, & Sterken (1980) | ||
| BT Monocerotis | White, Schlegel, & Honeycutt (1996) | Smith, Dhillon, & Marsh (1998) |
| V348 Puppis | Tuohy et al. (1990)ccRosen et al. (1994) conclude that “…ROSAT observations of [V348 Pup] do not provide any conclusive evidence in favor of the IP classification…” | Rodríguez-Gil et al. (2001c) |