HEGRA Contributions to the
28th International Cosmic Ray Conference
Tsukuba, Japan
Contents
-
1.
The Giant Radio Galaxy M 87 as a TeV -Ray Emitter observed with the HEGRA Cherenkov Telescopes 5
-
2.
Highlights from 6 years of TeV gamma-ray astrophysics with the HEGRA imaging Cherenkov telescopes 9
-
3.
Search for TeV Gamma-Rays from the Andromeda Galaxy and for Supersymmetric Dark Matter in the Core of M31 13
-
4.
Studies of the Crab Nebula based upon 400 hours of Observations with the HEGRA System of Cherenkov Telescopes 17
-
5.
High Energy Emission from H1426+428 and Absorption on the Extragalactic Background Light 21
-
6.
An new method to determine the arrival direction of individual air showers with a single Air Cherenkov Telescope 25
-
7.
Scans of the TeV Gamma-Ray Sky with the HEGRA System of Cherenkov Telescopes 29
-
8.
The Technical Performance of the HEGRA IACT System 33
-
9.
The New Unidentified TeV Source in Cygnus (TeV J2032+4130): HEGRA IACT-System Results 37
-
10.
TeV Observations of Selected GeV Sources with the HEGRA IACT-System 41
-
11.
Observations of 54 Active Galactic Nuclei with the
HEGRA Cherenkov Telescopes 45 -
12.
Study of the VHE Gamma Ray Emission from the AGN
1ES1959+650 with the HEGRA Cherenkov Telescope CT1 49 -
13.
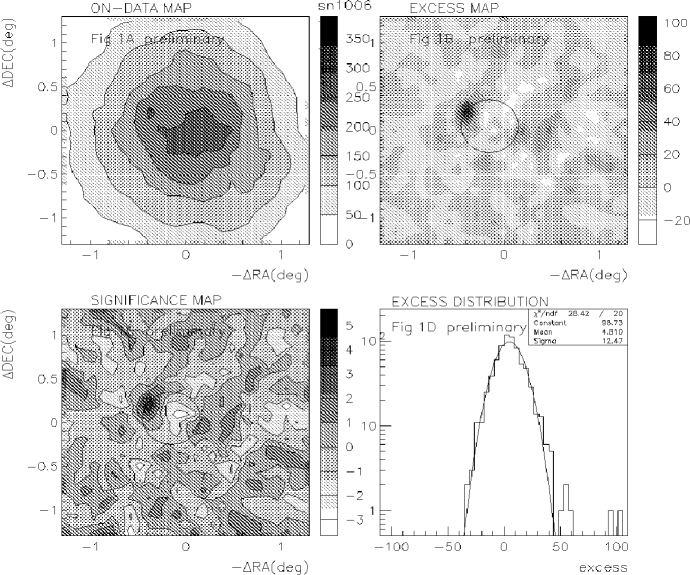
Observation of VHE Gamma Rays from the Remnant of SN 1006 with HEGRA CT1 53
Chapter 1 The Giant Radio Galaxy M 87 as a TeV -Ray Emitter observed with the HEGRA Cherenkov Telescopes
Niels Götting, Martin Tluczykont and
Götz Heinzelmann
for the HEGRA Collaboration
Institut für Experimentalphysik, Universität Hamburg,
Luruper Chaussee 149,
D-22761 Hamburg, Germany
Abstract
For the first time an excess of photons above an energy threshold of 730 GeV from the giant radio galaxy M 87 has been measured with a significance of 4.1 . The data have been taken during the years 1998 and 1999 with the HEGRA stereoscopic system of 5 imaging atmospheric Cherenkov telescopes. The excess corresponds to an integral flux of 3.3 % of the Crab flux. Making use of the imaging atmospheric Cherenkov technique, this is the first object of the AGN class observed in this energy range not belonging to the BL Lac type objects.
1. Introduction
Extragalactic TeV -ray emission has been observed with the imaging atmospheric Cherenkov technique so far from AGN only of the BL Lac type, i. e. objects ejecting matter in a relativistic jet oriented very close to the observer’s line of sight. In BL Lacs, TeV photons are commonly believed to originate in the jets, most popularly due to inverse Compton scattering. The well studied objects Mkn 421 ( 0.030), Mkn 501 ( 0.034), 1ES 1959+650 ( 0.047) and H 1426+428 ( 0.129) belong to this type of TeV -ray emitters. However, other types of AGN, e. g. giant radio galaxies, also show jets, though, in contrast to BL Lac type objects, under large viewing angles. Amongst these the nearby radio galaxy M 87 () – containing a supermassive black hole with [11] – has been speculated to be a powerful accelerator of cosmic rays, including the highest energy particles observed in the universe, see e. g. [10, 8]. The angle of the M 87 jet axis to the line of sight was determined to be – [7].
The HEGRA collaboration has extensively observed M 87 in 1998 and 1999 with the stereoscopic system of 5 imaging atmospheric Cherenkov telescopes (IACT system) [9] as one of the prime candidates for TeV -ray emission from the class of radio galaxies. In this paper the encouraging results of these observations are reported, applying a very sensitive analysis method (see also [3]). Astrophysical conclusions concerning the nature of the observed excess are discussed.
2. Observations and results of analysis
M 87 was observed in 1998 and 1999 with the HEGRA IACT system for a total of 83.4 h [3] above a mean energy threshold of 730 GeV for a Crab-like spectrum [14]. Only data of good quality were considered for the analysis.
All M 87 observations were performed in the wobble mode allowing for simultaneous estimation of the background (“OFF”) rate induced by charged cosmic rays [1]. This analysis uses a ring segment as extended OFF-region reducing the statistical error on the number of background events [3]. The radius and width of the ring are set according to the position and size of the ON-source area in order to provide the same acceptance for ON- resp. OFF-source events. The event reconstruction (described elsewhere, e. g. [2]) makes use of algorithm #3 for the reconstruction of the air shower direction [13]. A “tight shape cut” (parameter mscw ) [14] is applied for an effective -hadron separation. The optimum angular cut was derived using -ray events from the Crab nebula on the basis of a nearly contemporaneous data set at similar zenith angles.


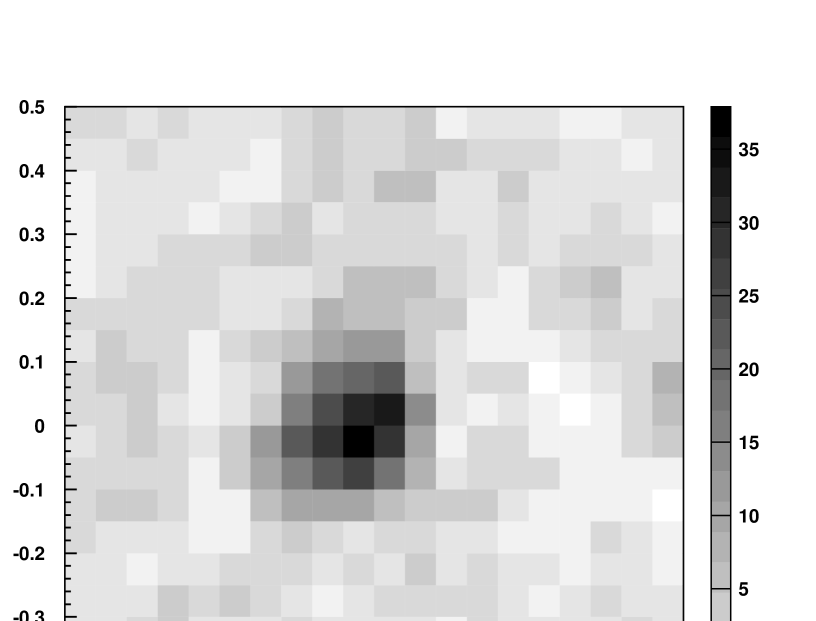
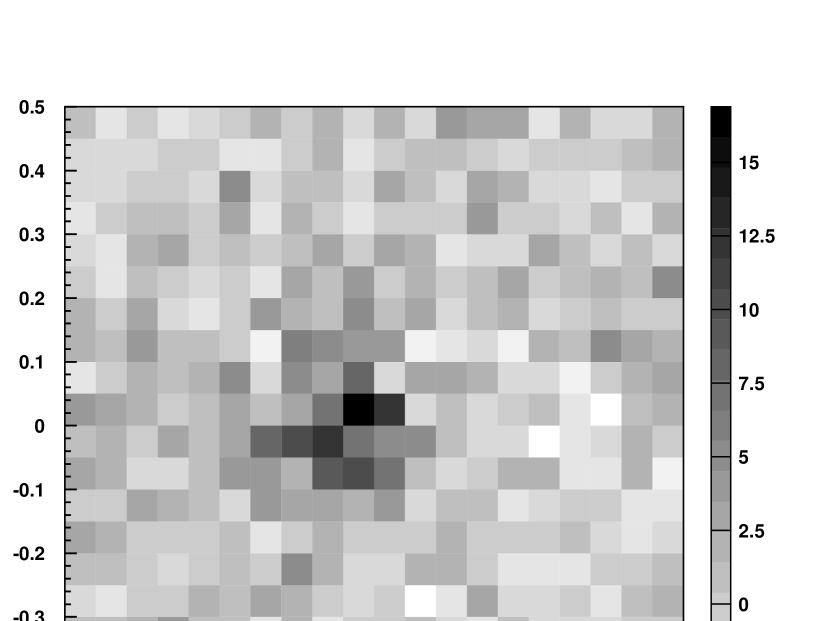
Figure 1 (left panel) shows the event distribution for the ON-source and the OFF-source regions as a function of the squared angular distance of the shower direction to the source position. The statistical significance of the observed excess from M 87 is 4.1 , calculated using formula (17) from [16]. On the basis of the limited event statistics the excess is compatible with a point-like source for the HEGRA IACT system at the position of M 87, although a slightly extended emission region cannot be excluded.
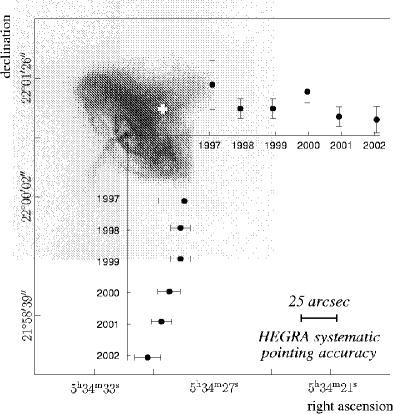
The event distribution in the field of view was used to determine the center of gravity position (CoG) of the TeV -ray excess at , (see Figure 1, right panel). The accuracy of the CoG determination is limited by a systematic pointing error of about 25 ′′ [18]. Within the large statistical errors, the CoG is consistent with the M 87 position. Currently, it is not possible to localize a candidate TeV -ray production site to particular inner radio structures of M 87.
The observed excess can be converted into an integral flux of ( % of the Crab nebula flux. A conversion into absolute flux units results in an M 87 -ray flux of A spectral analysis of the data of the M 87 data has been performed using the analysis technique described in [4]. The data can be well described with a power law with .
3. Summary and Conclusions
The radio galaxy M 87 has been observed with the HEGRA IACT system for a total of 83.4 h. For the first time a significant excess of 4.1 has been detected at energies above a mean energy threshold of 730 GeV from a member of this class of objects using the imaging atmospheric Cherenkov technique.
Due to the limited number of excess events detected so far it is difficult to draw a conclusion about the origin of the TeV -radiation. Assuming a spectral shape following a power law d/d the integral photon flux of ( % of the Crab nebula flux converts into an energy flux of Given the distance to M 87 of about 16 Mpc, this corresponds to a -ray luminosity above 730 GeV of about under the assumption of isotropic emission. The integral flux observed by HEGRA is not in conflict with an upper limit of phot. cm-2s-1 above 250 GeV reported by the VERITAS collaboration from data collected in 2000 and 2001 [15].
Several different possibilites for the origin of GeV/TeV -radiation are conceivable. M 87 with its pc scale jet has recently been modeled within the Synchrotron Self Compton scenario as a BL Lac object seen at a large angle to its jet axis [5]. Note, that a recent Chandra monitoring of the optical knot HST-1 in the M 87 jet (located only 0.8′′ away from the core) revealed a strong hint for a synchrotron origin of the observed X-ray emission [12]. The TeV -radiation of M 87 has also been modeled using the so-called Synchrotron Proton Blazar model [19]. In both models, the flux observed by HEGRA can be accommodated. The large scale (kpc) jets with several knots detected at radio to X-ray frequencies is also a possible -ray production site in M 87. Moreover, -rays could be produced in the interstellar medium at larger distances from the center of M 87. It should be noted that M 87 is also considered as a possible source of TeV -rays from the hypothetical neutralino annihilation process [6].
A weak signal at the centi-Crab level is at the sensitivity threshold for the HEGRA IACT system. Deep observations of M 87 with next generation Cherenkov telescopes like HESS, MAGIC and VERITAS will provide a high sensitivity together with a low energy threshold. Due to the proximity to M 87 (16 Mpc compared to 110 Mpc for the closest TeV BL Lac Mkn 421) these measurements will allow an accurate location and spectral analysis of the -ray emission site in M 87 thus greatly advancing our understanding of its TeV -radiation.
Acknowledgements
The support of the German Federal Ministry for Research and Technology BMBF and of the Spanish Research Council CICYT is gratefully acknowledged. G. Rowell acknowledges receipt of a von Humboldt fellowship. We thank the Instituto de Astrofísica de Canarias (IAC) for the use of the HEGRA site at the Observatorio del Roque de los Muchachos (ORM) and for supplying excellent working conditions on La Palma.
References
1. Aharonian, F. A., et al. 1997, A & Ap 327, L5
2. Aharonian, F. A., et al. 1999, A & Ap 342, 69
3. Aharonian, F. A., et al. 2003a, A & Ap 403, L1
4. Aharonian, F. A., et al. 2003b, A & Ap 403, 523
5. Bai, J. M., & Lee, M. G., 2001, ApJ 549, L173
6. Baltz, E. A., et al. 2000, Phys. Rev. D 61 023514
7. Bicknell, G. V., & Begelman, M. C., 1996, ApJ 467, 597
8. Biermann, P. L., et al. 2000, Nucl. Phys. B (Proc. Suppl.) 87, 417
9. Daum, A., et al. 1997, Astropart. Physics 8, 1
10. Ginzburg, V. L. & Syrovatskii, S. I., 1964, Pergamon Press, New York
11. Harms, R. J., et al. 1994, ApJ 435, L35
12. Harris, D. E., et al. 2003, ApJ 586, L41
13. Hofmann, W., et al. 1999, Astropart. Physics 12, 135
14. Konopelko, A., et al. 1999, Astropart. Physics 10, 275 ff.
15. Lebohec, S., et al. 2001, Proc. of the 27th ICRC, OG 2.3.191, Vol. 7, 2643
16. Li, T.-P., & Ma, Y.-Q., 1983, ApJ 272, 317
17. Owen, F. N., et al. 2000, ASP Conf. Series, Vol. 199 (astro-ph/0006152)
18. Pühlhofer, G., et al. 1997, Astropart. Physics 8, 101
19. Protheroe, R. J., et al. 2003, astro-ph/0303522
Chapter 2 Highlights from 6 years of TeV gamma-ray astrophysics with the HEGRA imaging Cherenkov telescopes
Götz Heinzelmann1,
for the HEGRA Collaboration2
(1) Universität Hamburg, Institut für Experimentalphysik,
Luruper Chaussee 149, D-22761 Hamburg, Germany
(2) http://www-hegra.desy.de/hegra/
Abstract
The HEGRA (High Energy Gamma Ray Astronomy) experiment achieved outstanding results during the operation of the six Cherenkov telescopes (end of 1996 - end of 2002), pioneering with 5 telescopes the stereoscopic observation mode. Concerning the Galactic sources these include the detection of Cassiopeia A, being the only shell type supernova remnant at TeV energies seen up to now in the northern sky and recently the observation of a yet unidentified TeV gamma-ray source TeV J2032+4130 in the Cygnus region. Also a scan of a large fraction of the Galactic plane has been achieved. Concerning the extragalactic sources most precise spectra at the highest energies have been obtained from the well studied blazars Mkn 501 and Mkn 421 as well as from H1426+428 and 1ES1959+650 established in the last two years only. Also extensive multi-wavelength campaigns have been successfully performed. Recently strong evidence for the nearby giant radio galaxy M87 being a TeV -ray source has been obtained. Some of the highlight results are addressed below.
1. Introduction and experimental method
The imaging atmospheric Cherenkov telescopes (Table 1) of HEGRA (Canary island La Palma, 28.750 N, 17.890 W, 2200m a.s.l.) started with a prototype telescope in 1992 and consisted in fall 1996 of a stand alone telescope (CT1) [1] pioneering observations during partial moon time and 5 telescopes (CT2-CT6) [2] introducing the very successful stereoscopic observation mode adopted by most of the next generation experiments. The stereoscopic observation of an air shower i.e. the simultaneous measurement of an air shower with several telescopes, under different viewing angles, allows to reconstruct unambiguously the shower direction and impact point and also the shower height on an event by event basis. This leads to an improved angular and energy resolution, an improved gamma/hadron separation and suppression of background from night sky light and muons (due to the coincidence method). The stereoscopy also allows to record simultaneously events from well defined background regions giving the quoted errors a high credibility and to perform sky searches in the field of view of the camera. The flux sensitivity achieved is a 10 detection within 1 hour for a source with a flux of 1 Crab. The telescopes CT2-CT6 ceased operation end of 2002.
| Telescope | Observ. | Mirror | PM-Camera | FoV | Ethres | ||
|---|---|---|---|---|---|---|---|
| mode | area [m2] | #pixels | [deg] | [GeV] | [deg] | [%] | |
| CT1 | alone | 5 10 | 37 127 | 3 | 700-900 | 0.2 | 25 |
| CT2-CT6 | stereo | 5 x 8.5 | 5 x 271 | 4.3 | 500-600 | 0.1 | 10-20 |
2. Galactic sources and Galactic accelerators of nuclei
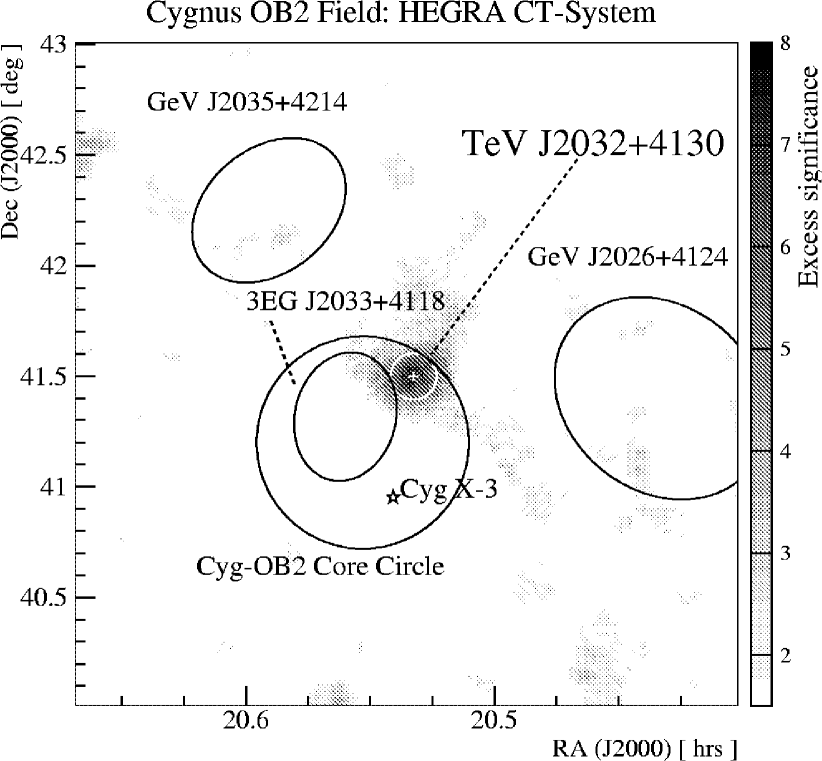
It is one of the main goals of the TeV -astronomy to find the sources of the Galactic cosmic rays commonly believed to be the shell type supernova remnants. In fact HEGRA detected [3] with Cassiopeia A the only shell type supernova remnant seen so far at TeV energies in the northern sky after a long observation time of 210 h (in 3 years) resulting in a flux of 3 % of the Crab nebula. Although not yet unequivocally proven it is very likely [4] that Cas A is one of the long sought hadronic accelerators. A scan of 1/4 of the Galactic plane (longitude l= -2o to 85o) yielded upper limits in the range of 0.15-0.5 Crab flux units for 63 SNR’s, 86 pulsars and 9 unidentified EGRET sources [5]. Recently HEGRA detected [6] with TeV J2032+4130 (Fig. 1) a new source up to now unidentified (i.e. no counterpart at radio, optical and X-ray energies) in a direction about 0.5 degrees north of Cygnus X-3. The source is detected meanwhile with a significance above 7 [6], exhibits a hard spectrum (index -1.9) and is possibly extended (on a 3 level). Several source mechanisms are conceivable and it may turn out that this source plays an important role in the context of the Galactic accelerators.
| Type | distance | significance | Flux | Experim. | |
| [] (HEGRA) | [Crab flux] | ||||
| Crab nebula | Plerion | 1.6 kpc | 10 | 1.0 | many |
| Cas A | SNR (shell) | 3.4 kpc | 6 | 0.03 | H |
| TeV J2032+4130 | unknown | unknown | 7 | 0.03 | H |
| Mkn 421 | BL Lac | (z = 0.030) | 10 | 0.04-7.40 | many |
| Mkn 501 | BL Lac | (z = 0.034) | 10 | 0.33-6.00 | many |
| 1ES 1959+650 | BL Lac | (z = 0.047) | 10 | 0.05-2.20 | H,V,C,T |
| H1426+428 | BL Lac | (z = 0.129) | 7 | 0.03-0.08 | H,V,C |
| 1ES 2344+514 | BL Lac | (z = 0.044) | 4 | 0.03 | H,V |
| M87 | radio gal. | (z = 0.0044) | 4 | 0.03 | H |
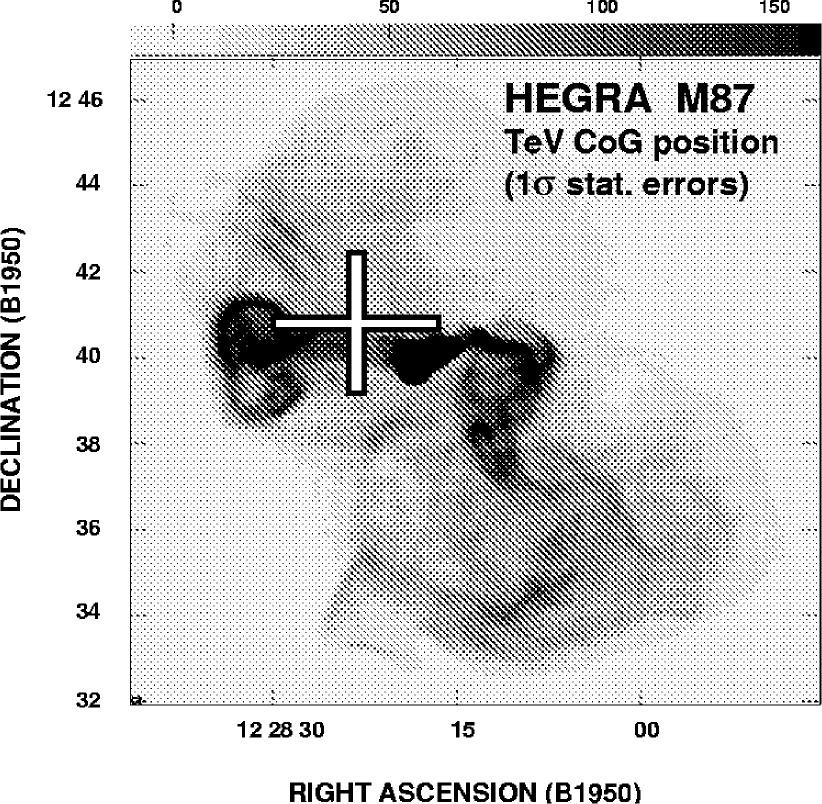
Right: Radio image of M87 at 90 cm showing the structure of the M87 halo. The center of gravity position of the TeV -ray excess from the HEGRA M87 observations is marked by the cross (statistical 1 errors) [11].
3. Extragalactic sources
Right after the completion of 4 telescopes ready for the stereoscopic observation Mkn 501 showed strong flares in 1997 during the whole observation period, allowing a measurement of an extended light curve and energy spectra of unprecedented precision in this field up to 16 TeV [7]. Remarkably, the shape of the energy spectrum essentially did not depend on the flux level in 1997. This is in contrast to Mkn 421 which exhibited also flaring states and showed examples for a hardening of the spectrum with rising flux level in the HEGRA data [8]. The Mkn 501 spectrum however became softer in the subsequent years. In the last two years two more blazars have now been well established, namely 1ES1959+650 and H1426+428. 1ES1959+650, reported by the Seven Telescop Array with 3.9 (1998), has been detected by HEGRA end of 2001 with 5.2 and showed subsequently strong flares in May 2002 reaching a significance level above 20 [10] in the HEGRA data (detected also by VERITAS and CAT). H1426+428 is the most distant TeV -source up to now and has been detected by all three northern instruments VERITAS, HEGRA and CAT (Table 2).
The precise HEGRA energy spectrum of Mkn 501 has been used by several authors to infer the density of the extragalactic background light (EBL) in the optical to infrared range due to the absorption process . In fact, the spectra of Mkn 501 (and Mkn 421) in the TeV range yield the best limits for the EBL density in the mid-infrared range to date, which is of great cosmological interest. With more precise data also from other sources such as H1426+428, which is a factor four more distant (and with a better understanding of the sources) even more stringent results will be possible. The present HEGRA data for H1426+428 already indicate a modulation of the measured energy spectrum [10] due to the imprint of the absorption process mentioned above. To understand the underlying acceleration processes in the jets of the blazars several multi-wavelength campaigns have been performed e. g. together with the X-ray satellite RXTE especially for Mkn 421 and Mkn 501. Correlated flux variations have been observed which indicate that an inverse Compton origin is in general able to describe the TeV data though other processes can not be excluded.
Analyzing the data from observations of further 52 objects from the AGN class with a total observation time of 658 h yielded signals on the 4 level from the blazar 1ES2344+514 [11] (reported earlier by Whipple) and very recently from the radio galaxy M87 (Fig. 1) [12] which still has to be confirmed. M87 at the center of the Virgo cluster is of specific interest since it is the first TeV AGN being observed using the imaging technique and not belonging to the blazar class, thus opening the field of TeV -astronomy to a new class of sources. This very nearby object may also play an important role for the acceleration of cosmic rays up to the highest energies. Further results will be presented at this conference.
4. Conclusion
The contributions of HEGRA to the TeV -astronomy on the way to a mature field have been extremely important by pioneering new experimental techniques and related analysis methods, by obtaining high statistics and precise data for light curves and energy spectra and by detecting new sources such as Cas A, TeV J2032+4130, 1ES 1959+650 and M87, thus promising a great future to the next generation Cherenkov telescopes.
References
1. Mirzoyan, R. et al. 1994, NIM A 351, 513
2. Daum, A. et al. 1997, Astropart. Phys., 8, 1
3. Aharonian, F.A. et al. 2001, A&Ap 370, 112 and Pühlhofer, G. these proc.
4. Berezhko, E.G., Pühhofer, G. and Völk, H.J. 2003, A&Ap 400,971
5. Aharonian, F.A. et al. 2001, A&Ap 375, 1008
6. Aharonian, F.A. et al. 2002, A&Ap 393, L37 and Rowell, G. et al. 2003, these proc.
7. Aharonian, F.A. et al. 2001, A&Ap 366, 62
8. Aharonian, F.A. et al. 2002, A&Ap 393, 89
9. Aharonian, F.A. et al. 2003, A&Ap submitted and astro-ph/0305275
10. Aharonian, F.A. et al. 2003, A&Ap 403, 523 and Horns, D. et al. 2003, these proc.
11. Tluczykont, M. et al. 2003, these proceedings
12. Aharonian, F.A. et al. 2003, A&Ap 403, L1 and Götting, N. et al. 2003, these proc.
Chapter 3 Search for TeV Gamma-Rays from the Andromeda Galaxy and for Supersymmetric Dark Matter in the Core of M31
W. Hofmann, D. Horns and H. Lampeitl, for the HEGRA collaboration
Max-Planck-Institut für Kernphysik, D 69029 Heidelberg, P.O. Box 103989
Abstract
Using the HEGRA system of imaging atmospheric Cherenkov telescopes, the Andromeda galaxy (M31) was surveyed for TeV gamma ray emission. Given the large field of view of the HEGRA telescopes, three pointings were sufficient to cover all of M31, including also M32 and NGC205. No indications for point sources of TeV gamma rays were found. Upper limits are given at a level of a few percent of the Crab flux. A specific search for monoenergetic gamma-ray lines from annihilation of supersymmetric dark matter particles accumulating near the center of M31 resulted in flux limits in the cm-2s-1 range, well above the predicted MSSM flux levels except for models with pronounced dark-matter spikes or strongly enhanced annihilation rates.
1. Introduction
M31, as the nearest large galaxy at a distance of 770 kpc, most likely with a black hole of M⊙ at its core [7], is an obvious target for TeV observations. While conventional sources such as the Crab Nebula would not be visible over the distance to M31, given the current sensitivity of the instruments, the energy output of some of the X-ray sources detected in M31 is at a level which, if continued to higher energy, might be detectable. A particular mechanism for gamma-ray emission is the annihilation of supersymmetric dark matter particles accumulating at the core of M31; rotation curves suggest that M31 contains a significant amount of dark matter.
2. The HEGRA telescope system and the M31 data set
M31 was observed in August, September and November 2001, using all five telescopes of the HEGRA system of Cherenkov telescopes on the Canarian Island of La Palma. Each of the telescopes has a 8.5 m2 mirror and is equipped with a 271-pixel photomultiplier camera with a field of view. The system has an energy threshold around 500 GeV and a angular resolution. The detection rate for gamma rays is rather uniform within the central of the field of view, and drops to 63% of its peak value at from the optical axis. In order to cover all of M31, observation time was distributed between three tracking positions, one centered on the core of M31 at RA 0h 42’ 44” DEC 16’ 9.12”, one displaced by to the SW at RA 0h 40’ 30” DEC 39’ 0” and one displaced to the NE at RA 0h 44’ 43” DEC 53’ 0”. After data cleaning, 20.1 h of good observation time were selected, most of which were taken at Zenith angles below . For calibration and reference, 9.7 h of Crab Nebula data taken in October and November were selected.
In a first analysis step, the entire field was searched for indications of gamma-ray point sources. The data analysis and selection of gamma-ray candidates follows to a large extent the procedures developed for earlier surveys [1,2]. For each grid point, gamma ray candidates with reconstructed directions within , consistent within the angular resolution, were counted. Since no specific off-source data were taken, the expected background for each grid point is determined from the data itself, using appropriate background regions in equivalent locations of the field of view of the cameras.
No obvious excess of signal events is visible at any grid point. The significance for each grid point is then calculated based on [8]. The distribution of significances for all grid points approximates a Gaussian distribution with unit width, as expected in the absence of a genuine signal; the point with the highest significance of 3.5 is well compatible with the expected tail of the Gaussian distribution, and should be interpreted as an upward fluctuation.
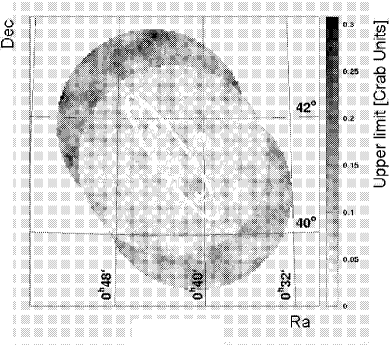
We conclude that there is no statistically significant indication of a TeV gamma ray point source in M31, and extract upper limits for the source flux. The 99% confidence level on the number of excess events is calculated for each grid point, and is converted into a flux using the measured gamma-ray rate from the Crab Nebula. The resulting flux limits are shown in Fig. 1 (left), and range from 3.3% of the Crab flux for the center of M31 to about 30% at the periphery. For two other objects in the survey range, M32 and NGC205, limits of 4.4% and 2.8% of the Crab flux are derived, respectively. More details can be found in [3].
3. Search for supersymmetric dark matter in M31
Beyond the general survey, the good energy resolution of the HEGRA telescope system allows a dedicated search for supersymmetric dark matter in M31, looking for the line emission from the self-annihilation of the lightest stable particle (LSP). We have searched for line emission in the energy spectrum from the central part of M31 ( kpc), and compare the results with predictions of the flux of gamma-rays from the annihilation of neutralinos () in the framework of the minimal supersymmetric standard model (MSSM) using a spatial distribution of the radial density of neutralinos in M31 in concordance with the measured rotation curve [6].
In order to reduce the background from isotropic cosmic ray events, in the event selection a tight cut on the direction has been chosen for the central part of M31. Only events from within a cone of radius are accepted. At a distance of 770 kpc this corresponds to the inner kpc of M31. The sensitivity for line emission depends on the energy resolution of the detector. For this analysis, an improved energy reconstruction algorithm has been applied. The relative energy resolution () reaches 10 % for a wide energy band from the threshold of 500 GeV up to 10 TeV. The search bin in energy is wide, concentrating on the central section of a monoenergetic line in order to achieve best signal to noise ratios. The energy bins are equally spaced on a logarithmic scale such that the bin centers are separated by 0.025 on a decadic logarithmic scale, making the bins correlated.
The background expectation of the measurement is determined using seven independent OFF-regions with similar acceptance to the ON-region. For the calculation of upper limits on the number of excess events , the 99 % c.l. upper limits were caculated and an upper limit on the rate from a -ray line was derived. The corresponding flux limits were calculated using collection areas derived from Monte Carlo simulations applying the same reconstruction methods and event selection as for the data analysis. The resulting exclusion region is indicated in Fig. 1 (right) as the grey shaded region.
A prediction for the line flux emission was derived using scans of the 7-parameter space of MSSM performed by [4]. The expected flux is given by Eq. (6) of [6] or the equivalent Eq. (13) of [4] (scaled to the distance to M31):
Apart from trivial factors, it depends on the velocity-weighted annihilation cross section and on the line-of-sight and solid-angle integrated squared LSP mass density
written as in units of GeV2 cm-5. The envelope of the allowed vs. space was used as given in Figs. 1 and 2 of [4]. The unitless parameter corresponds to of [6], scaled to the inner 1.4 kpc on the basis of the distributions of Fig. 3(b) of [6] and using a distance of 770 kpc. This value of represents the upper range of the different models for the dark matter halo of M31 discussed in this reference. The predicted line flux is given in Fig. 2 (right). We have indicated the two individual final states with line emission ( and ) in the figure. The model prediction given here is based upon smoothly distributed dark matter. Within this model, no signal from M31 with the current sensitivity of Cherenkov detectors is to be expected. Very favorable conditions as for example clumpiness of dark matter would lead to a considerable increase of the annihilation rate [5,9]. It is conceivable that the flux level of some models would become detectable by tuning the distribution of the dark matter halo and by invoking mechanisms to allow for larger cross sections. However, in the absence of a signal, no exotic speculations are required.
Acknowledgement
The support of HEGRA by the Spanish CICYT and the German Ministry for Education and Research BMBF is gratefully acknowledged.
1. Aharonian, F.A., Akhperjanian, A.G., Barrio, J.A., et al. 2001, A&A 375, 1008
2. Aharonian, F.A., Akhperjanian, A.G.,Beilicke, M., et al. 2002, A&A 395, 803
3. Aharonian, F.A., Akhperjanian, A.G., Beilicke, M., et al. 2003, A&A 400, 153
4. Bergström, L., Ullio, P., & Buckley, J.H., 1998, Astropart. Phys. 9, 137
5. Bergström, L, Edsjö, J, Gondolo, P, & Ullio, P., 1999, Phys. Rev. D59, 043506
6. Falvard, A., Giraud, E., Jacholkowska, A., et al. 2002, astro-ph/0210184
7. Kormendy, J., & Bender, R., 1999, ApJ 522, 772
8. Li, T., & Ma, Y., 1983, ApJ 272, 317
9. Taylor, J.E., & Silk, J. 2002, submitted to MNRAS, astro-ph/0207299
Chapter 4 Studies of the Crab Nebula based upon 400 hours of Observations with the HEGRA System of Cherenkov Telescopes
D. Horns (dieter.horns@mpi-hd.mpg.de), for the HEGRA collaboration
MPI f. Kernphysik, Postfach 10 39 80, D-69117 Heidelberg, Germany
Abstract
The Crab nebula has been observed extensively with the HEGRA system of imaging air Cherenkov telescopes. Roughly 400 hours of prime observation time at zenith angles between 5 and 65 degrees have been dedicated to the standard candle in TeV astronomy. Based upon the data set gathered during the 5 years of operation of the HEGRA telescopes, the energy spectrum has been reconstructed. The energy spectrum extends from 500 GeV beyond 20 TeV and allows to constrain the position of a possible high-energy cut-off.
1. Introduction
The Crab nebula has been a prime target of observations since the beginning of operation of the instrument primarily for calibration and monitoring of the instrument’s -efficiency in the initial stage of operation and during the routine operation. The observational results include the energy spectrum [3], upper limits on the angular size of the emitting region [4], and constraints on the fraction of pulsed radiation [5]. After the end of the live-time of the instrument (it has been dismantled in October 2002), an analysis of the entire dataset taken from the Crab nebula with increased statistics and improved reconstruction technique with respect to previous publications [2] (the most recent published spectrum from the Crab nebula is based upon hrs of observations) is justified and first preliminary results on the energy spectrum are presented here.
2. Observations and Results
The observations had been carried out between September 1997 and September 2002. During it’s life-time as a 4 (later 5) telescope system, the setup of the individual telescopes (including cameras and electronics) has not been modified. However, the degradation of the mirrors and the ageing of the photomultipliers have been compensated by an increase of the high voltage on an annual basis. The performance of the instrument has been closely monitored by various checks on the acceptance, absolute calibration with muon-rings, cut efficiencies, pointing calibration, and careful scrutinizing of the photomultiplier characteristics [7]. The benefit of the thorough calibration and understanding of the instrument’s performance is the reliable data-taking that in turn allows to combine data taken over many years with a minimum of systematics introduced by changes of the detector.
The simulations of the detector have been performed using two independent Monte-Carlo type air-shower and detector simulations [8]. Both simulations agree within 10 % on the relevant parameters (cut efficiency, rate of cosmic ray events, angular resolution, energy resolution). All detector simulations have been carried out for individual periods (one moon cycle) taking the degrading photomultiplier and optical gain into account to model the response of the detector and particularly its change with time. Additionally, whenever required, the simulations have been done with different telescope setups (3, 4, and 5-telescope setups) in case of failures of individual telescopes.
| Season | alt | |||||
|---|---|---|---|---|---|---|
| year | ksec | ksec | ksec | ksec | ksec | hrs |
| 1997/98 | 162.04 | 96.83 | 54.48 | 49.67 | 363.02 | 100.84 |
| 1998/99 | 217.84 | 60.82 | 92.15 | 115.72 | 486.52 | 135.15 |
| 1999/00 | 108.89 | 9.10 | 0.66 | 0.15 | 118.80 | 33.00 |
| 2000/01 | 129.09 | 39.59 | 17.02 | 2.96 | 188.66 | 52.40 |
| 2001/02 | 125.36 | 52.69 | 32.90 | 13.62 | 224.58 | 62.38 |
The observations are taken in wobble-mode, where the telescopes point with an offset of to the direction of the source, alternating the sign of the displacement from run to run. A summary of the observational time is given in Table LABEL:my_008277-1:table:observations The listed observational times are selected for good weather conditions and instrument performance. Overall, less than 10 % of the runs have been rejected by requiring the event rate to deviate by less than 25 % from the expected value (for a given observational period and zenith angle).
The analysis technique is based upon the method first introduced for HEGRA data in [2] with the modification of applying a slightly tighter cut on the main /hadron separation quantity mean scaled width. The mean scaled width is related to the width of the images scaled to the expectation for a -ray induced event.
For individual events at a given zenith angle, an energy estimate is calculated with a relative resolution of % [6]. Using Monte-Carlo calculated tables of collection areas as a function of reconstructed energy for 5 discrete zenith angles a collection area for each event is calculated using interpolation in zenith angle and energy. Finally, the sum of the inverse of the collection areas is calculated for a given energy bin and using the dead-time corrected on-time, a differential flux is calculated. The background is calculated by averaging over 5 regions in the camera with the same distance to the camera center and diameter as the source region.
We have omitted to include the observations below an altitude of . Further results on large zenith angle observations will be presented at the conference. The preliminary result is presented in Fig. LABEL:my_008277-1:fig:Crab The deep exposure is sufficient to collect photons used in the analysis covering 2 decades in energy. The signal in the highest energy bin centered on 39 TeV is beyond . Inclusion of large zenith angle observations will overcome the difficulties of saturation and boost the statistics of photons up to even higher energies.
The data is well described by a pure power-law fit ph/(cm2 s TeV), . A functional form with a curvature term describes the data slightly better: , . A similar is reached for a power-law with an exponential cut-off: . The very slight curvature changes the photon-index from 2.43 at 1 TeV to 2.65 at 40 TeV.

3. Discussion
The observations presented here cover for the first time a wide range in energies (two decades) with a single instrument. The advantage of such an observation is clearly that relative calibration uncertainties between different measurements are absent. However, there are systematic uncertainties that need to be addressed before conclusions on the physics are derived. The statistical errors of the measurement are very small ( % for energies between 1 and 4 TeV) and therefore the systematic uncertainties are dominating.
The strong energy dependence of the response function of the telescopes in the threshold region is introducing uncertainties in the region below 1 TeV. Different reconstruction methods and event selections have been carried out and the variation of the response at lower energies has been studied. The conservative estimate of the systematic uncertainty below 1 TeV is a % uncertainty region. This estimate is largely based upon the remaining variations in the energy spectrum below 1 TeV in different zenith angle bands and over the years of observation.
For the high energy end of the spectrum, saturation of the electronics used for digitization of the pulses is crucial. The dynamical range of the FADC electronics is limited to one order of magnitude before the individual time slices of the FADC saturate. However, using the overall pulse shape makes a larger dynamical range accessible. This introduces possible systematic effects by either over- or under-compensating. From the measured image amplitudes of cosmic ray induced events we expect these effects to be small ( %). In a previous analysis [2] of large zenith angle observations where the image amplitude even for events with energies beyond 10 TeV are not saturating, no strong systematic effect was visible.
Further studies on the pulsed emission from the Crab pulsar and morphology of the -ray emitting region at different energies are on the way.
4. References
1. Aharonian, F.A., et al. 1999, A&A 346, 913
2. Aharonian, F.A., et al. 1999, A&A 349, 11
3. Aharonian, F.A., et al. 2000, ApJ 539, 317
4. Aharonian, F.A., et al. 2000, A&A 361, 1073
5. Aharonian, F.A., et al. 1999, A&A 346, 913
6. Hofmann, W. et al. 2000, Astrop.Physics 12, 207
7. Pühlhofer, G. et al. 2003, submitted to Astrop.Physics
8. Konopelko, A. et al. 1999, Astrop.Physics 10, 275, Bernlöhr, K. internal report, Horns, D. PhD thesis 2000
Chapter 5 High Energy Emission from H1426+428 and Absorption on the Extragalactic Background Light
D. Horns, F.A. Aharonian, L. Costamante, for the HEGRA Coll.
MPI f. Kernphysik, Postfach 10 39 80, D-69117 Heidelberg, Germany
Abstract
The Blazar H1426+428 () has been observed with the HEGRA stereoscopic system of imaging air Cherenkov telescopes for 270 hrs in the years 1999, 2000, and 2002. The object is detected with a significance of 7.5 . The energy spectrum measured by HEGRA extends up to TeV with indications for a change in the spectral slope at energies above 2 TeV. The integral flux above 1 TeV in 1999 and 2000 amounts to % of the flux of the Crab Nebula. In 2002, the flux drops to a level of % of the Crab Nebula. The extragalactic background light (EBL) at wavelengths between 1 and 10 microns causes substantial () absorption of photons in the measured energy spectrum. The intrinsic spectra after correction for absorption are discussed. Nearly simultaneous observations with the X-ray observatory RXTE in 2000 and 2002 indicate flux and spectral variability in the X-ray band between 2 and 20 keV.
1. Introduction
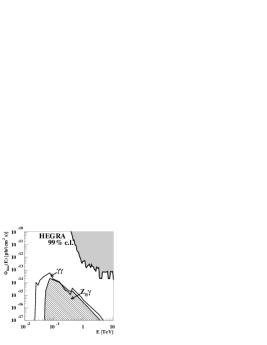
The ongoing exploration of Blazar type objects over a broad region of the electromagnetic spectrum has revealed surprising properties that are of relevance for the study of injection, acceleration, and radiative cooling of particles in relativistic jets. However, a deep understanding of these objects based upon the observations at TeV energies suffers from the ambiguity of the observed spectrum with respect to absorption effects on the extragalactic background light (EBL). Currently, the object H1426+428 at a red shift of is the most distant emitter of photons up to energies of TeV detected. Unfortunately, the observational uncertainty on the measured energy density of the EBL is quite large (up to a factor of 10 at m, see also Fig. 1b). Given the consequently large uncertainty on , a reasonably accurate (better to within a factor of 10) correction for the effect of absorption is not possible. Here, another approach is followed: Using widely different descriptions of the EBL, absorption corrections are applied to the observed energy spectrum to infer the intrinsic source spectrum. The intrinsic source spectrum is then checked for consistency with our current understanding of Blazar physics.
2. Observations and Results
2.1. X-ray observations
The instruments on-board the Rossi X-ray Timing Explorer (RXTE) have been used to measure the X-ray flux from H1426+428 during the years 2000, 2001, and 2002. The overall flux level is quite different between the observations, varying by a factor of 4 between 2000 and 2001 (see Table LABEL:my_008277-2:table_data for a summary of the pointed observations). During all three pointings a hard spectrum described by a power law with with is observed. This indicates that the object is showing only weak spectral variations, remaining in a hard state for different flux levels. Interpreting the corresponding spectral energy distribution in the framework of a combined synchrotron and Compton dominated emission model, this would imply that the position of the synchrotron peak is at or beyond 10 keV, and possibly similar to previous observations [3] located in the hard X-ray band. In 2000, the spectrum seems to soften above 8 keV. In 2002 the spectrum seems to harden beyond 15 keV. A pure power-law does not satisfactorily describe the data in these cases.
The all-sky monitor (ASM) on-board the RXTE satellite offers a continuous coverage of the object. Averaging the daily measurements of the flux for the HEGRA observational nights during the 1999, 2000 data set results in an ASM rate of counts/sec whereas in 2002 the ASM count rate drops by a factor of 1.7 to counts/sec. In the context of a leptonic emission model, a correlation of the X-ray flux and the TeV flux is expected and is confirmed by the HEGRA data (see next section).
| Pointing | Exposure | |||
|---|---|---|---|---|
| year | ksec | keV-1s-1cm | ||
| 2000 | 12.7 | |||
| 2001 | 4 | |||
| 2002 | 110 |
2.2. TeV observations
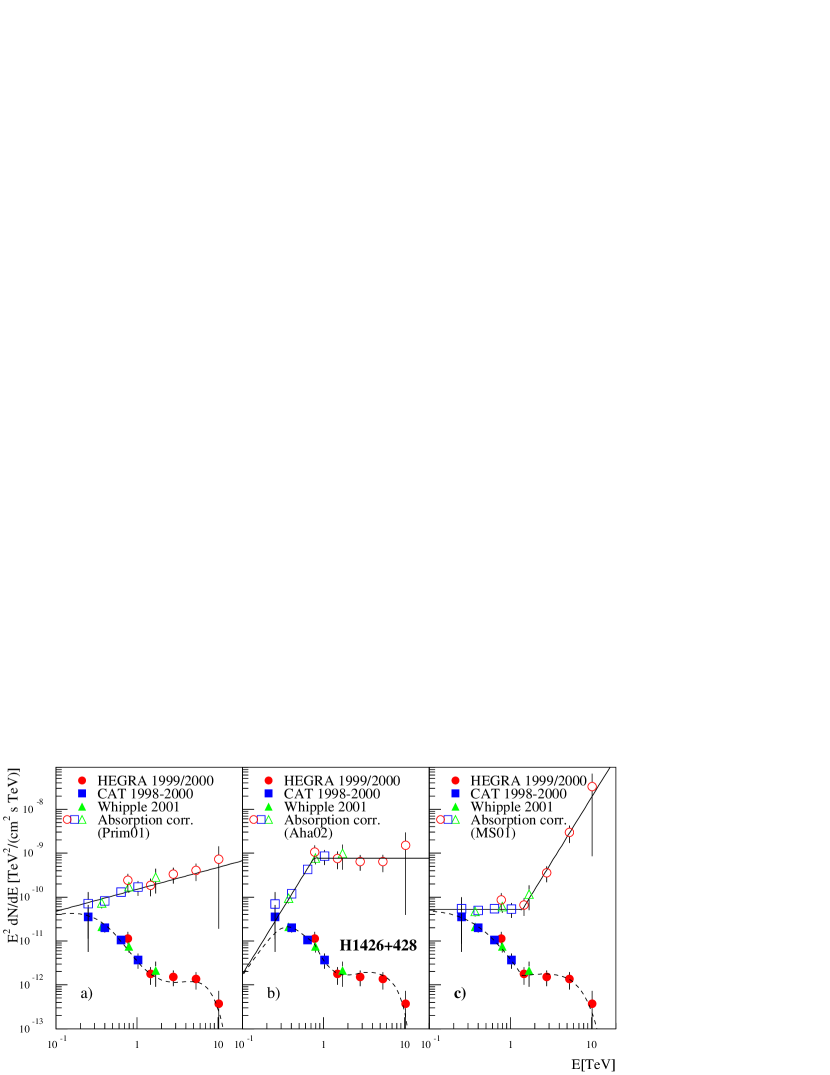
The observations carried out with the HEGRA system of 5 imaging air Cherenkov telescopes detected the object in 1999/2000 during a 40 hrs observation at a flux level of 8 % of the Crab Nebula [1]. In order to verify the observed energy spectrum with better statistics, an extended observational campaign has been carried out in 2002, accumulating 217 hrs of good data [2]. However, the source showed a lower flux of merely 3 % of the Crab Nebula. The spectral analyses presented here are based upon an improved analysis technique tailored for weak sources. The event-selection criteria have been adopted to weak sources by applying tighter cuts on the arrival direction and on mean scaled width in order to increase the signal-to-noise ratio. An improved energy reconstruction algorithm has been used which benefits from the stereoscopical reconstruction of the position of the shower maximum and achieves a relative energy resolution () of 15 % at the threshold and of 10 % at higher energies. The new method has successfully been used for data taken on the Crab Nebula and on the original 40 hrs data set of H1426+428 taken in 1999 and 2000. The resulting data points are shown in Fig. LABEL:my_008277-2:fig:spec1 Generally, good agreement between the previously published energy spectrum and the reanalysed data of 1999/2000 is seen. The 2002 data confirm a hardening in the energy spectrum above 1 TeV. Combining the excess above 2 TeV of all the data results in a significance of .
![[Uncaptioned image]](/html/astro-ph/0307334/assets/x8.png)
![[Uncaptioned image]](/html/astro-ph/0307334/assets/x9.png) Fig. 1.: a) The differential energy spectrum of H1426+428 as measured by HEGRA in the two different
flux states seen in 1999, 2000, and 2002. For comparison, the previously published results
are included.
b) A selection of measurements and models for the EBL from UV to far infrared
(taken from [2]).
Fig. 1.: a) The differential energy spectrum of H1426+428 as measured by HEGRA in the two different
flux states seen in 1999, 2000, and 2002. For comparison, the previously published results
are included.
b) A selection of measurements and models for the EBL from UV to far infrared
(taken from [2]).
3. Conclusions
Based upon the fact that similar flux levels of H1426+428 have been observed by the CAT, Whipple, and HEGRA group and that the ASM observations confirm a similar level for these observations at X-ray energies, it seems feasible to combine the different data sets to benefit from a wider energy band covered. Especially at energies below 1 TeV, a steep rise of the energy spectrum because of absorption effects is expected and confirmed by the different groups [4]. The resulting energy spectra are shown in Fig. 2(a-c) together with absorption corrected spectra using the SEDs of the EBL shown in Fig. 1b. Note, the models Aha02 and MS01 result in an unreasonable rise of the source spectrum () either at the low energy part (Aha02, Fig. 2b) of the spectrum or the high energy part of the spectrum (MS01, Fig. 2c). Consulting Fig. 1b it becomes clear that the Aha02 description of the EBL data (especially the high flux between 1-2 m) results in a steep rise of for GeV. The high value of the SED in the near-infrared as given by MS01 causes a quickly increasing optical depth above TeV.
In summary, the TeV observations of extragalactic objects offer an indirect approach to constrain the EBL. The HEGRA observations of H1426+428 with a clear detection of 6 above 2 TeV are important to constrain the shape of the SED of the EBL in the near infra-red above 2 m. Combined data from CAT, Whipple, and HEGRA constrain the EBL at wavelengths below 2 m.
4. References
1. Aharonian, F.A., et al. 2002, A&Ap 384, L23
2. Aharonian, F.A., et al. 2003, A&Ap in press
3. Costamante, L., et al. 2001, A&Ap 371, 512
4. Petry, D., Bond, I.H, Bradbury, S.M. et al. 2002 ApJ, 580, 104, Djannati-Ataï, A., Khelifi, B., Vorobiov, S. et al. 2002, A&Ap, 391, L25
Chapter 6 An new method to determine the arrival direction of individual air showers with a single Air Cherenkov Telescope
Daniel Kranich,1,2 and Luisa Sabrina Stark,2 for the HEGRA Collaboration
(1) Max-Planck-Institut für Physik, München, Germany
(2) Swiss Federal Institut of Technology Zurich, Zurich, Switzerland
Abstract
We present a new method to reconstruct the arrival direction of individual air showers. The method is based in part on the arrival direction reconstruction method of Lessard et al. [1] from the Whipple collaboration, but yields a significant 30% improvement in the obtained angular resolution. The method was successfully tested on Monte Carlo Simulations and real data of Mkn 421, Mkn 501 and 1ES1959 from the HEGRA Cherenkov Telescope CT1. Based on the same data an angular resolution of could be derived.
1. Introduction
The determination of the arrival direction of -ray photons is essential for the investigation of extended sources and the search for sources with unknown or inaccurate positions. In the case of an observation with a few Cherenkov telescopes the images of at least 2 (sometimes 3) detectors are needed in order to determine the arrival direction without ambiguity. However, even for a single telescope it is possible to circumvent this problem. Since all -rays have a similar orientation (limited by the source’s extension) one can use the images of several shower events to estimate the arrival direction of an individual -ray photon.
2. The Method
The method to derive 2-dimensional source maps for a single telescope is based on the procedure described in [1] and which can be summarized as follows: The arrival direction for a given shower event is estimated as the point on the major axis of the shower image located at a distance DISP to the shower centroid. The DISP parameter is a function of the elongation of the shower image and is defined as . The scaling parameter has to be determined from real observations or MC data. The final source map is build up from the arrival directions of all shower events. In the case of the CT1 data, the DISP parameter was slightly modified to include the LEAKAGE parameter:
| (1) |
The LEAKAGE parameter is defined as the ratio between the light content in the camera edge pixels and the total light content of the shower event. The inclusion of this parameter corrects for truncation effects of the LENGTH parameter in the small CT1 camera ( diameter). The free variables in Equ. LABEL:my_009254-1:eq_disp, and were determined from Monte Carlo simulations as and .
As a modification of this method we determine a set of possible
arrival directions for each shower event (in the following called
arrival distribution):
Taking into account the value and error of both the parameter
and the orientation of the major axis of each shower image one can
calculate the most probable intersection point for any (randomly
chosen) triple of shower images by means of a fit (see
Fig. LABEL:my_009254-1:fig_triple). The arrival distribution for a given shower
event is then defined by the subset of all those intersection points,
where this event has been part of the triple***Due to the large
computational overhead of this method the number of intersection points
per shower event have been limited to 500.. Poorly defined
intersection points with a were rejected. Each
derived arrival distribution was then normalized to unity. The final
ON source map is given by the superposition of arrival distributions
from all individual shower events and the final excess arrival
distribution is derived by subtracting the normalized OFF from the ON
source map.
The basic idea behind this approach is that all intersection points of
pure shower triples should point towards the same sky region
whereas a more or less isotropic distribution is expected whenever
hadronic shower images are involved.
3. Results and Conclusions
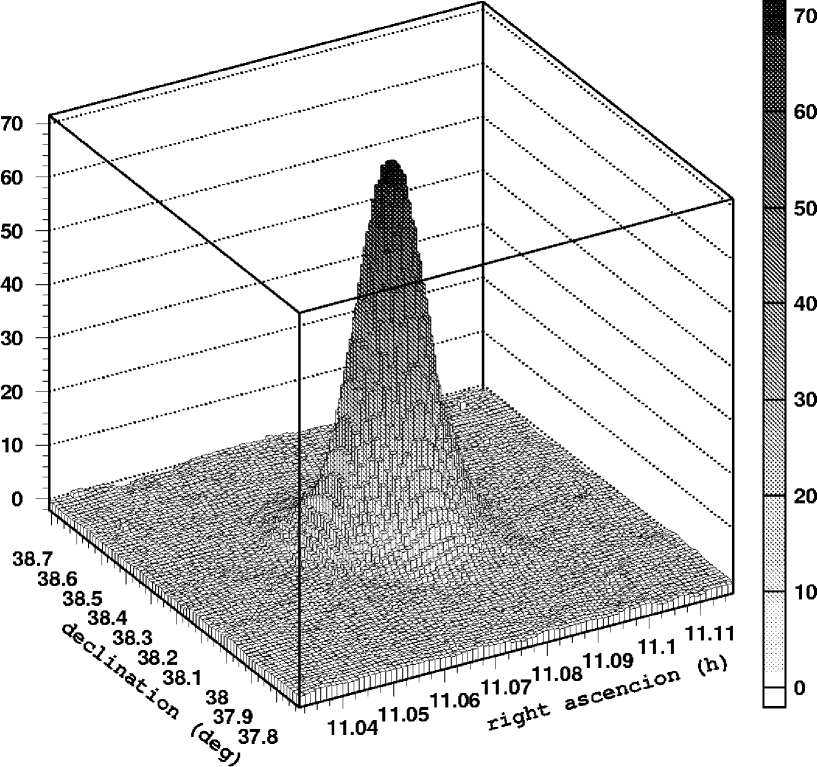
The excess arrival distribution for the Mkn 421 CT1 data sample is
shown in Fig. LABEL:my_009254-1:fig:3don A fit of a two dimensional Gaussian
onto the data has been used to derive estimates for the angular
resolution ( and ) and the reconstructed
source position ( and ). The
results from this fit on several CT1 data samples are shown in Table
LABEL:my_009254-1:results_tab for both, the original method of Lessard et al. [1]
and the modified method as presented here. As can be seen from the
table, the new method yields a significant 30% improvement in the
angular resolution for almost all sources. The reconstructed direction
of the objects coincides with the known position within the accuracy
of the shaft encoder steps (). It is also evident
from Table LABEL:my_009254-1:results_tab, that the angular resolution strongly
decreases for off-axis sources (i.e. where the telescope was pointing
aside the source). This effect seems not to be related to the method
itself since data which was artificially shifted towards an off-axis
position†††Here the image parameters ALPHA and DIST were
recalculated relative to a shifted camera center while the WIDTH and
LENGTH parameters were kept. didn’t result in a decreased angular
resolution. One possible reason could be that for off-axis
observations the small CT1 camera (about diameter) leads to
a larger number of truncated images, which then lower the
effectiveness of both arrival direction estimation methods. This is
currently under investigation.
The decrease in angular resolution between the 1997 (Mkn 501) and the
2001/2002 (Mkn 421, 1ES1959) data is addressed to the CT1 mirror
upgrade at the end of 1997. The new CT1 mirror was increased from to and shows some increased
aberration effects due to the larger mirror diameter.
Even though the derived angular resolution for 1ES1959 is similar for
both methods, the distribution of the excess arrival direction as
obtained with the new method is superior (see Fig. LABEL:my_009254-1:fig:1es1959)
and yields a much clearer excess peak.
In summary the presented method to determine the arrival direction of individual photons for a single Cherenkov telescope gives a 30% improvement compared to the original method. The derived angular resolution of is similar to the result one would obtain from a system of Cherenkov telescopes [2]. This improvement should also allow for an increased cut sensitivity, which, however, has not been investigated yet.
| data sample | new method | original method | ||||||
|---|---|---|---|---|---|---|---|---|
| Mkn 421, 2001 | 0.075 | 0.073 | 0.005 | 0.014 | 0.100 | 0.099 | 0.004 | 0.015 |
| Mkn 501, 1997 | 0.058 | 0.056 | -0.023 | -0.035 | 0.078 | 0.077 | -0.023 | -0.035 |
| Mkn 501, oa, 1997 | 0.082 | 0.068 | 0.017 | -0.010 | 0.109 | 0.101 | 0.008 | -0.030 |
| 1ES1959, 2002 | 0.077 | 0.085 | 0.035 | -0.001 | 0.082 | 0.088 | 0.052 | 0.003 |
| MC | 0.052 | 0.052 | -0.010 | 0.022 | 0.073 | 0.072 | -0.010 | 0.023 |
| MC oa | 0.081 | 0.081 | -0.040 | 0.019 | 0.119 | 0.123 | -0.039 | 0.022 |
Acknowledgements: The support of the HEGRA experiment by the BMBF (Germany) and the CYCIT (Spain) is acknowledged. We are grateful to the Instituto de Astrofisica de Canarias for providing excellent working conditions on La Palma.
4. References
1. Lessard R. W. et al. 2001, APh 15, 1
2. Daum A. et al. 1997, APh 8, 1
Chapter 7 Scans of the TeV Gamma-Ray Sky with the HEGRA System of Cherenkov Telescopes
Gerd Pühlhofer1, for the HEGRA collaboration2
(1) Max-Planck-Institut für Kernphysik, Heidelberg, Germany
(2) http://www-hegra.desy.de/hegra
Abstract
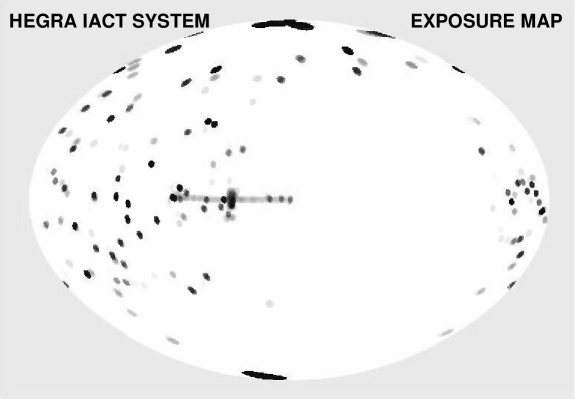
Between 1997 and the end of the detector operation in fall 2002, about 5500 hours of observational data were recorded with the HEGRA system of Imaging Atmospheric Cherenkov Telescopes (IACT). Besides dedicated scan observations of extended sky regions, a considerable fraction of the sky has been looked at as a side effect during the observations of selected source candidates. Altogether, more than 3% of the total sky has been observed with the HEGRA IACT system. We report on a search for possible new TeV sources within this entire data set.
1. Introduction
A large fraction of the observation time of the HEGRA IACT system [3] was dedicated to individual objects such as known supernova remnants and active galactic nuclei, which were known from other wavebands. Given the system’s large field of view (FoV) of 4.3∘ with a homogeneous -ray acceptance over more than 2∘ in diameter, scans of extended sky regions were also possible (e.g. [2]). Summing up scans as well as observations of individual objects, more than 3% of the entire sky has been observed with the HEGRA telescope system.
In the case of observations which were targeted at a point source, a large fraction of the FoV is not affected by the possible emission from the target object, and is usually only used to derive background estimates for the source candidate. It is however obviously possible, in analogy to scanning observations, to regard any position in the FoV as possible source candidate, and derive background estimates from other parts of the FoV.
2. Analysis challenges
The main analysis challenge is a reliable background estimate for an arbitrary position in the FoV. Gamma-ray event candidates are identified against the much larger hadronically induced background solely by the shapes of the event images. The image cut typically rejects 92% of the hadrons, the remaining hadrons generate background in the -ray shape cut domain. Depending on the total observation time and the angular extension of the search area, the systematic accuracy of the determination of the absolute background level at the source candidate location must be 1% for very deep observations.
In HEGRA system data analysis, the standard approach to determine a background estimate uses only -ray event candidates after image cuts; then different positions in the FoV are used as background control regions. An alternative method (the so-called ’template model’ [1]) uses hadron candidates which were reconstructed to originate from the same direction as the source candidate. In this case, a normalisation is needed to estimate the background level in the -ray regime from the event counts in the hadron domain; this value must be derived from an average across the whole FoV.
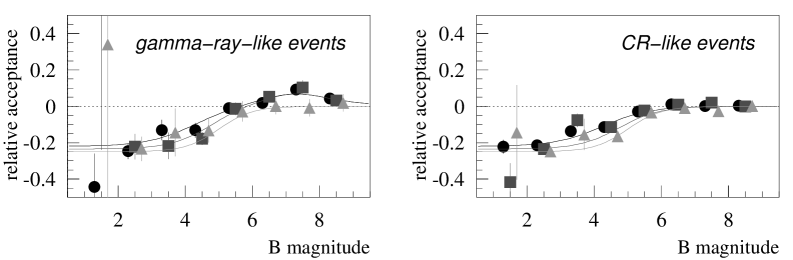
Both background estimates rely on the homogeneity of the (-ray or hadron) acceptance across the FoV. While detector acceptance inhomogeneities are typically of the order of 5% or less, they may reach 10-20% in special cases such as large zenith angle observations or strong sky brightness variations due to stars. Much effort went into the development of an acceptance correction which accounts for as many as possible known systematic effects. Figure 1 shows as an example the acceptance at the positions of stars in the FoV relative to the surrounding acceptance, as a function of the B-band of stellar magnitude. The values were derived from data, averaging over all stars in the respective magnitude interval which have no other stars nearby. The lines show empirical parametrisations which are used as part of the overall acceptance correction. The functional dependence for the -ray and hadron regimes is quite similar, supporting the idea that the ’template’ background estimate may be better able to cope with inhomogeneities (of whatever type) at individual pointings. Fortunately, the two different discussed background estimates are affected by different uncertainties of the acceptance determination; since the results derived with both methods are generally in good agreement, we conclude that both estimates are reliable.
The ’template’ background estimate is in principle applicable to the investigation of source candidates which cover a large portion of the FoV, or to look for diffuse -ray emission. However, the cited systematic problems in the FoV homogeneity prevent us currently from searching for source candidates which cover a large portion of the FoV.
3. Search for new gamma-ray sources
In the current analysis, two different grid search patterns were applied: a dense grid of spacing with a tight angular cut optimized for point sources, and a wider grid of with a wider angular cut for slightly extended sources. In both cases, the significances for neighbouring grid points are correlated since the cuts are a bit larger than the grid spacing. Strong known -ray sources were, a priori, excluded from the search grid.
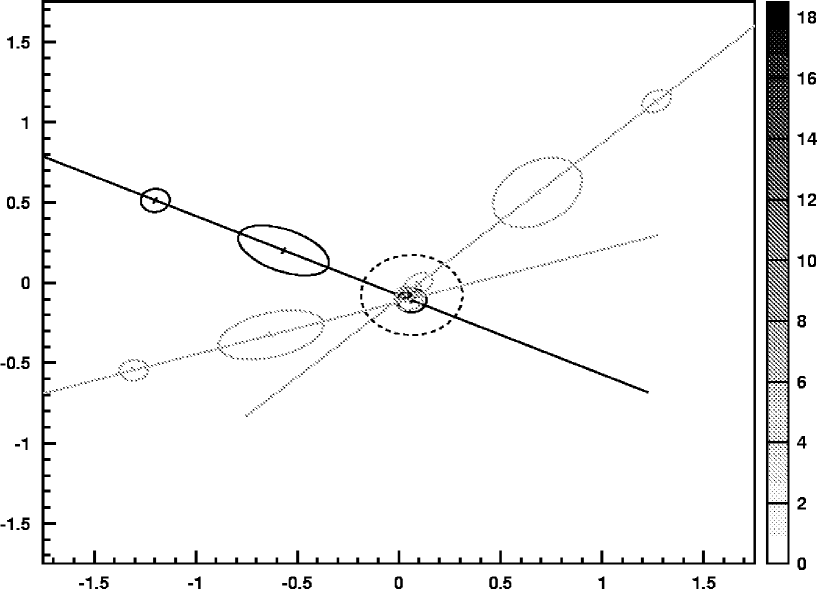
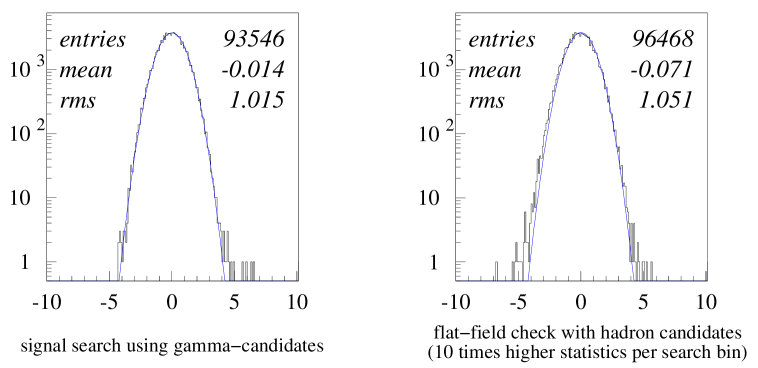
Figure 3 shows significance distributions for the wider grid from a preliminary analysis containing data up to 2001. The plot on the left hand side represents the search for new -ray sources. Here, -candidates in a ring surrounding the search position were used for background estimate. An excellent agreement with the Gaussian expectation for most of the scan positions is obtained, proving that the method works well. A few scan points show a -ray signal at a level of ; these include objects that were detected as TeV emitters already in earlier analyses which were dedicated to these source candidates (e.g. Cas A, H 1426+428). A few new -ray source candidates have been identified; final results for the entire data set are under way and will be presented at the conference. Strong unknown TeV emitters in the sky – at least where HEGRA was pointed – can however be excluded.
The analysis was also performed for hadron events where no localized sources are expected. The hadron domain has ten times more counts per search bin than the -ray regime, the significance distribution (right panel of Fig. 2) is hence a very sensitive tracer for possible systematic errors in the flat-field procedure. The distribution is nearly Gaussian, which is a good additional check that systematic acceptance variations are well under control.
4. References
1. Aharonian, F., Akhperjanian, A., Beilicke, M. et al., A&A 393 (2002), L37
2. Aharonian, F., Akhperjanian, A., Beilicke, M. et al., A&A 395 (2002), 803.
3. Daum, A., Hermann, G., Heß, M., et al., Astropart. Phys 8 (1997), 1.
Chapter 8 The Technical Performance of the HEGRA IACT System
Gerd Pühlhofer1, for the HEGRA collaboration2
(1) Max-Planck-Institut für Kernphysik, Heidelberg, Germany
(2) http://www-hegra.desy.de/hegra
Abstract
Between the beginning of 1997 and fall 2002, the HEGRA collaboration was operating a stereoscopic system of 4 (later 5) Imaging Atmospheric Cherenkov Telescopes (IACT) on the Canary Island La Palma. We review the calibration schemes which were developed for the system, and report on the performance of the detector over this period. The system had an energy threshold of 500 GeV under optimum detector conditions at zenith. With the calibration schemes described here, a systematic accuracy of 15 percent on the absolute energy scale has been achieved. The continuous sensitivity monitoring provides a relative accuracy of a few percent, and shows that the threshold did not exceed 600 GeV throughout the whole period of operation. The readout electronics and the imaging quality of the dishes were well monitored and stable. The absolute pointing had an accuracy of better than 25′′.
1. Introduction
The HEGRA stereoscopic Imaging Atmospheric Cherenkov Telescope system was located in the Canary Islands, at 2200 m above sea level on the Roque de los Muchachos on La Palma (17∘52′34′′ West, 28∘45′34′′ North). The system consisted of 5 identical telescopes (CT 2 - CT 6), which operated in coincidence for the stereoscopic detection of air showers in the atmosphere. Now, after the disassembly of the system, we present an account of the long-term performance and stability of the system. A far more detailed description can be found in [2].
2. Telescope pointing and point spread function
The 3.4 m reflectors were azimuthally mounted and driven by stepper motors. The telescopes’ pointing was calibrated and monitored offline by dedicated calibration runs, so called point runs, which used stars as reference objects. Those calibration runs were typically performed every few months. During data taking, the tracking algorithm relied solely on the position of the telescopes’ axes, which were measured by 14 bit optical shaft encoders. The pointing was corrected offline using an analytical model of the mechanical structure of the telescopes, the parameters of which were determined from the point runs. The resulting pointing accuracy was 25′′ in right ascension and declination.
The temporal stability and accuracy of the pointing calibration was verified for example by the examination of the center of gravity of the TeV emission of the Crab Nebula. In Figure 1, the white cross denotes the reconstructed center of the TeV emission for the whole HEGRA data sample; for reference, the Chandra X-ray image was placed at the year 2000 coordinates of the pulsar. Additionally, the HEGRA data were split up into yearly intervals, with results as shown in the insets. Within the systematic and statistical errors, the centers of the X-ray and TeV -ray emission are in agreement over the full lifetime of the experiment.
Each telescope dish held 30 spherical glass mirrors with diameters of 60 cm; the total mirror area per telescope was . The quality of the optical point spread function (psf) was monitored using the same point runs. The influence of the psf on -ray induced shower images is best obtained from the regular observations of strong TeV -ray sources. For two short periods only, the mirror alignment had been distorted by ice such that the image shape parameters needed to be tuned, until the mirror alignment was corrected. For the rest of the system lifetime, the image parameters were stable.
3. Camera electronics calibration, relative sensitivity monitoring
Each telescope held a camera with 271 photomultipliers, viewing 4.3∘ of the sky. The signals were digitized with 120 MHz FADCs. Less than 2% of channels were excluded due to technical problems in 95% of the runs. The relative gain of the camera pixels and the relative pixel timing was calibrated by laser runs, in which the camera was illuminated uniformly by laser flashes. These runs were performed every night, to provide a continuous FADC gain flat-field. In addition, the individual pixel HV’s were adjusted every few months, based on the laser run results; a trigger acceptance flat-field of 5% or better was thereby achieved.
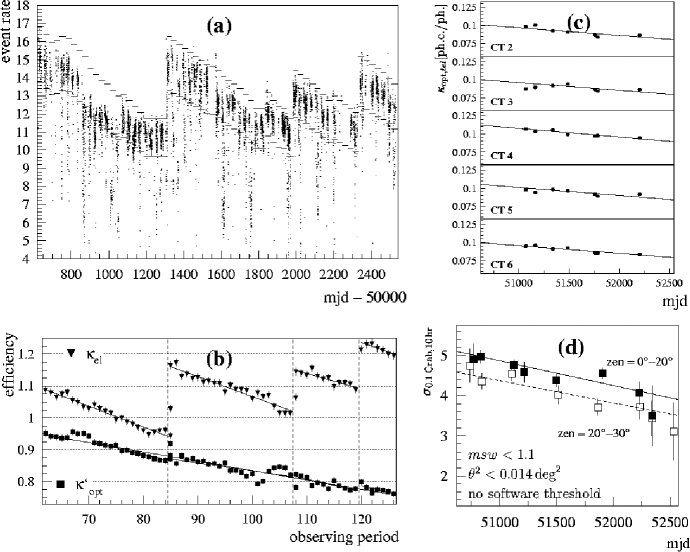
Continuous monitoring of changes in the light sensitivity of the complete detectors was provided by the event trigger rate which originates from the steady background flux of charged cosmic rays (CR) (see Fig. 2a). The numbers directly translate into a change of the energy threshold of the system. Assuming an energy threshold of 500 GeV under optimum conditions (see next section), the threshold deduced from the CR rate never exceeded 600 GeV.
The main contribution to the sensitivity decrease of the detectors came from the electronics chain, presumably due to aging of the PM’s last dynodes. The absolute gain of the camera electronics was monitored using the laser runs, values are given in Fig. 2b. To compensate for these losses, the global HVs of all cameras were increased three times (indicated by the vertical dashed lines). The remaining part of the sensitivity loss was caused by losses in the optical throughput, presumably mirror aging (cf. in Fig. 2b, and also Fig. 2c).
4. Absolute energy threshold, gamma-ray sensitivity
The absolute energy threshold of the system was obtained by shower and detector simulations [1]; for early detector conditions, a value of was estimated. The standard method of comparing the CR event rate to expectations from simulations is limited by uncertainties in the CR energy spectrum and composition. However, the detector sensitivity itself can be derived from the investigation of muon images in the cameras, and also from special laser calibration setups using a calibrated photodiode as reference. Figure 2c shows results from muon runs, which were performed a few times per year; the values already include the correction by . The muon run results agree within 15% with the values used for the CR event rate simulations, confirming the estimated energy threshold.
Finally, in Fig. 2d we show the sensitivity of the HEGRA system for weak -ray sources, derived from Crab observations. The values denote the expected significances for a ten hour observation, in units of standard deviations , for a -ray source which has 10% of the Crab’s source strength. The slight sensitivity decrease over the detector lifetime is presumably caused by a deterioration in the background rejection power, which could not be compensated for by the global HV increases [2].
To conclude, the telescope system was very well understood, regarding both the absolute calibration and the slight performance changes over the years. We believe that with the HEGRA system, an important contribution has been made to the effort of establishing ground based imaging Cherenkov telescopes as precision detectors, well suited within the broad range of astronomical instruments.
5. References
1. Konopelko A., Hemberger M., Aharonian F., et al. 1999, Astropart. Phys., 275
2. Pühlhofer G., Bolz O., Götting N., et al. 2003, accepted in Astropart. Phys.
Chapter 9 The New Unidentified TeV Source in Cygnus (TeV J2032+4130): HEGRA IACT-System Results
Gavin Rowell1, Dieter Horns 1, for the HEGRA Collaboration2
(1) MPI für Kernphysik, Postfach 103980, D-69029 Heidelberg, Germany
(2) see http://www-hegra.desy.de/hegra/
Abstract
The first unidentified TeV source in Cygnus is confirmed by follow-up observations carried out in 2002 with the HEGRA stereoscopic system of Čerenkov Telescopes. Using all 279 hrs of data, this new source TeV J2032+4130, is steady over the four years of data taking, is extended with radius 6.2′, and has a hard spectrum with photon index . Its location places it at the edge of the core of the extremely dense OB association, Cygnus OB2. Its integral flux above energies TeV amounts to 3% of the Crab nebula flux. No counterpart at radio, optical and X-ray energies is as-yet seen, leaving TeV J2032+4130 presently unidentifed. Summarised here are observational parameters of this source and brief astrophysical interpretation.
1. Introduction & Data Analysis
Analysis of archival data ( h) of the HEGRA system of Imaging Atmospheric Čerenkov Telescopes (HEGRA IACT-System see for e.g. [13]) devoted to the Cygnus region revealed the presence of a new TeV source [1]. This serendipitous discovery is now confirmed in follow-up observations from 2002 (158 h) by the same telescopes. Given the lack of a counterpart at other energies, TeV J2032+4130 may represent a new class of particle accelerator.
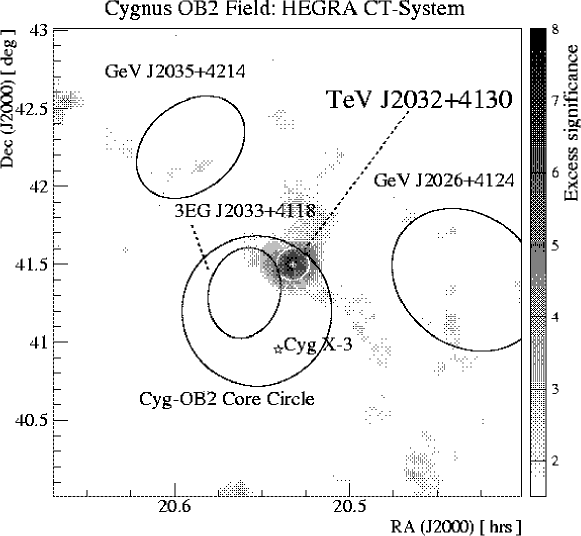
For these analyses, cosmic-ray (CR) background events are rejected via a cut on the mean-scaled-width parameter [2]. Event directions are reconstructed using the so-called ‘algorithm 3’ [6], and a cut is made on the angular separation between the reconstructed event and assumed source direction. So-called tight cuts are implemented: , , and also demanding a minimum images for the and calculation. The background is estimated using the template model [1,14], and consistent results are also obtained using an alternative displaced background model which employs ring-segments within the FoV. For the centre of gravity (CoG) and source extension determination, an additonal cut on the estimated error in reconstructed direction () is applied, reducing systematic effects (e.g. [7]). The CoG and source extension are estimated by fitting a 2D Gaussian convolved with the instrument’s point spread function to a histogram of -ray-like () events binned over a FoV. At the CoG, the excess significance now exceeds 7 from all 278.2 h of data, and the source extension is confirmed as non point-like. The reconstruction of event energy follows the method of [8] and we use tight cuts plus a cut on the reconstructed air-shower core distance of the event core200 m. A pure power law explains well the energy spectrum, showing no indication for a cut-off. A lower limit to the cut-off energy , 4.2 and 4.6 TeV is however estimated when fitting a power law+exponential cutoff term and fixing the power index at values 1.7, 1.9 and 2.2 respectively. The integral flux for energies TeV is or about 3% of the Crab nebula flux. Results are summarised in Table LABEL:my_009463-1:tab:numbers and Fig LABEL:my_009463-1:fig:skymap (upper panel).
| (a) CoG & Extension () |
| RA : | 20hr 31m 57.0s | |
| Dec : | 41∘ 29′ 56.8′′ | |
| 6.2′ |
| (b) Tight cuts: , , |
| Backgr. | |||||
|---|---|---|---|---|---|
| Template | 1245 | 5926 | 0.168 | 252 | +7.1 |
| Displaced | 1245 | 15492 | 0.065 | 243 | +7.1 |
| (c) Spectral Cuts: Tight Cuts + corem |
| Backgr. | |||||
|---|---|---|---|---|---|
| —– Energy estimation method: See [8] —– | |||||
| Displaced | 974 | 5122 | 0.143 | 242 | +7.9 |
| (d) Fitted Spectrum: Pure Power-Law |
| = | ||
| = | ||
| = |

2. Modelling TeV J2032+4130
Possible origins of TeV J2032+4130 have been discussed in literature [1,4,12]. One interpretation involves association with the stellar winds of member stars in Cygnus OB2, individually or collectively, which provide conditions conducive to strong and stable shock formation for particle acceleration. Certainly the existence of TeV emission suggests particles accelerated to multi-TeV energies. We have therefore matched the spectral energy distribution of TeV J2032+4130 with coarse leptonic and hadronic models (Fig. LABEL:my_009463-1:fig:skymap lower panel). Another scenario involves particle acceleration at a termination shock, which are expected at the boundary where a relativistic jet meets the interstellar medium. TeV J2032+4130 actually aligns well within the northern error cone of the bi-lobal jet of the famous microquasar Cygnus X-3 [10,11].
For simplicity we assume the TeV emission arises from either a pure sample of non-thermal hadronic or leptonic parent particles. Under the hadronic scenario the -decay prediction explains well the TeV flux when using a parent proton power law spectrum of index 2.0 with a sharp limit up to energies 100 TeV. The neighbouring EGRET source 3EG J2033+4118 (likely not related to TeV J2032+4130) provides no constraint on this model. Associated synchrotron X-ray emission would also be expected from tertiary electrons (). We have not yet modelled this component which essentially represents an absolute lower limit on any synchrotron emission visible. Assuming a pure leptonic scenario, TeV data are matched well by an inverse-Compton spectrum (up-scattering the cosmic microwave background) arising from an uncooled electron spectrum with power law index and hard cutoff at 40 TeV. This allows us to predict the synchrotron emission as a function of local magnetic field, constrained by the available upper limits at radio and X-ray energies. The most conservative synchrotron prediction arises from the G choice, which is realistically the lowest such field expected in the Galactic disk. But in fact, much higher fields (G) are generally expected in such regions containing young/massive stars with high mass losses and colliding winds (e.g. [5]). Deep observations by XMM and Chandra will provide strong contraints on the leptonic component.
References
1. Aharonian F.A, et al. 2002 A&A 393, L37
2. Aharonian F.A, et al. 2000 ApJ 539, 317
3. Butt Y. et al. 2003 ApJ submitted (astro-ph/0302342)
4. EGRET Catalogue (3rd) http://heasarc.gsfc.nasa.gov/
5. Eichler D., Usov V. 1993 ApJ 402, 271
6. Hofmann W., et.al 1999 Astropart. Phys. 10, 275
7. Hofmann W., et.al 2000 A&A 361, 1073
8. Hofmann W., et.al 2000 Astropart. Phys. 12, 207
9. Li T.P., Ma Y.Q. 1983 ApJ 272, 317
10. Martí et al. 2000 ApJ 545, 939
11. Martí et al. 2001 A&A 375, 476
12. Mukherjee R. et al. 2003 ApJ in press, (astro-ph/0302130)
13. Pühlhofer G. et. al 2003 Astropart. Phys. submitted
14. Rowell G.P. 2003 A&A(Supp) submitted
Chapter 10 TeV Observations of Selected GeV Sources with the HEGRA IACT-System
Gavin Rowell1, for the HEGRA Collaboration2
(1) MPI für Kernphysik, Postfach 103980, D-69029 Heidelberg, Germany
(2) see http://www-hegra.desy.de/hegra/
Abstract
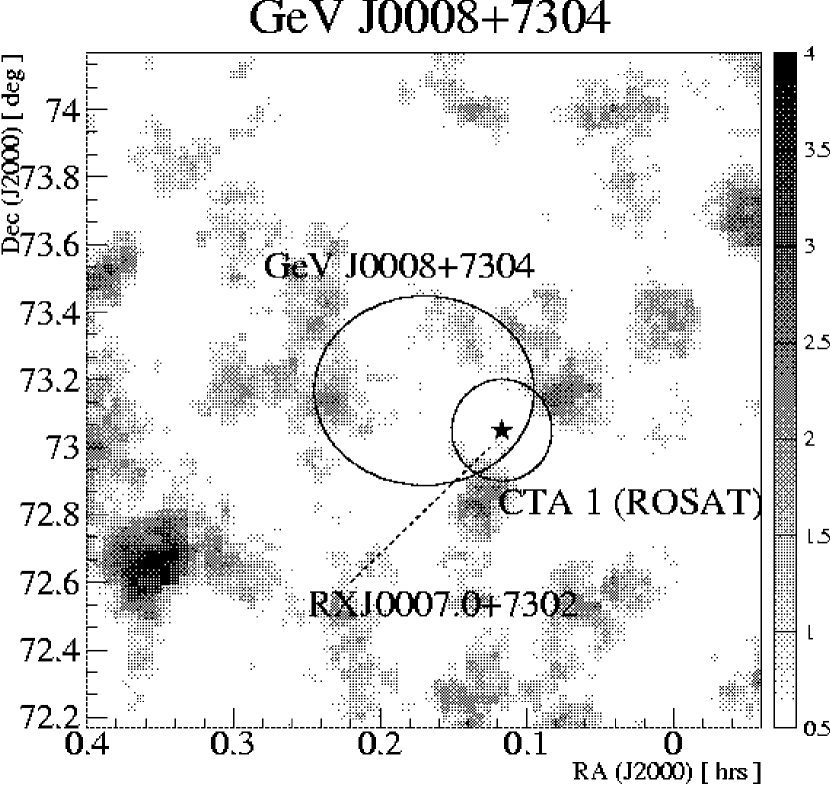
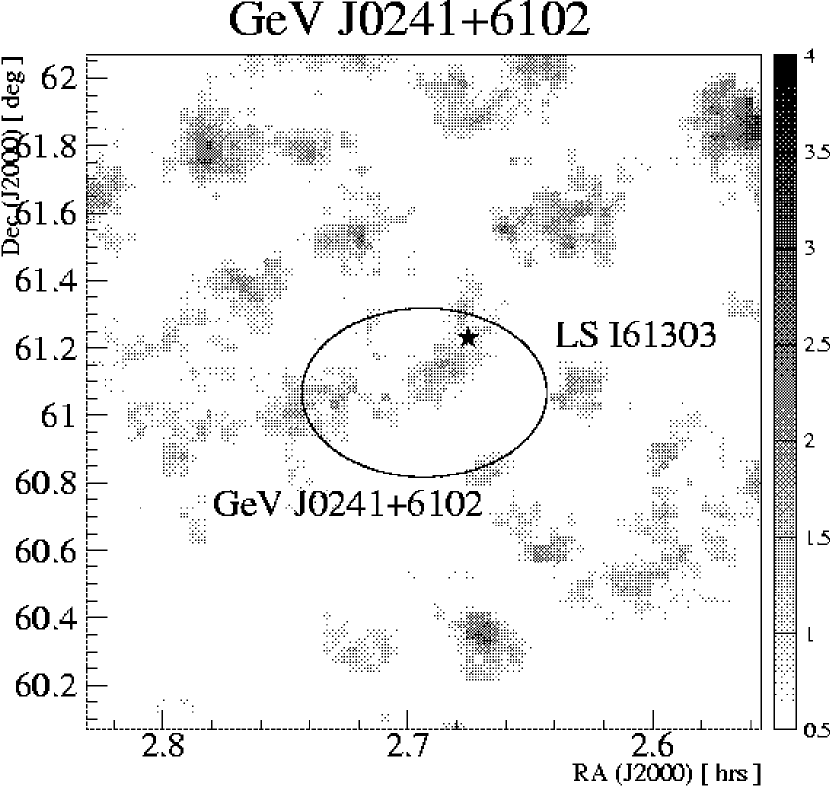
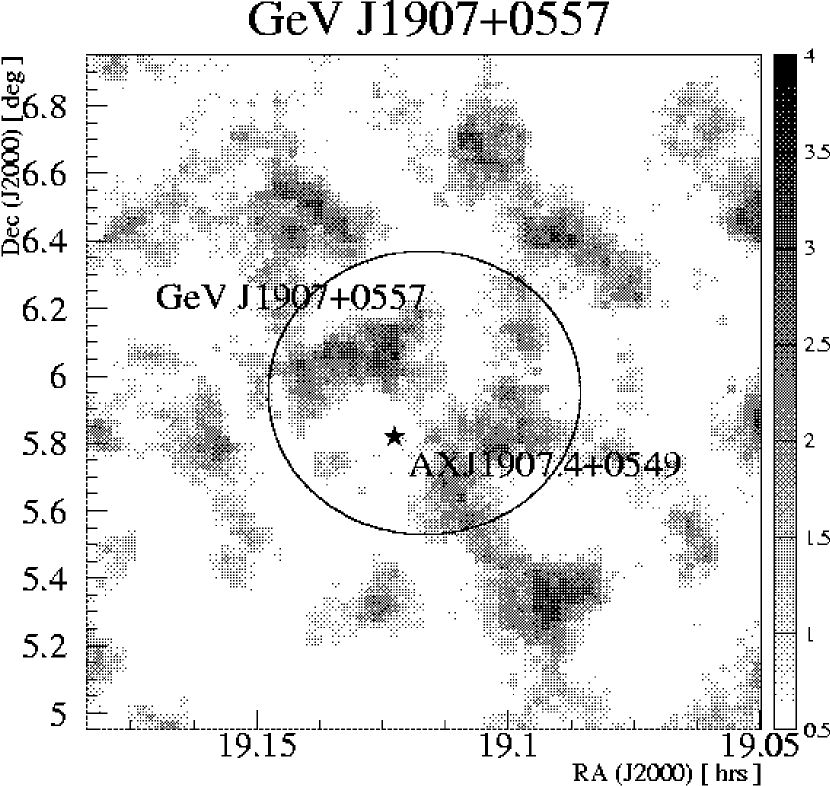
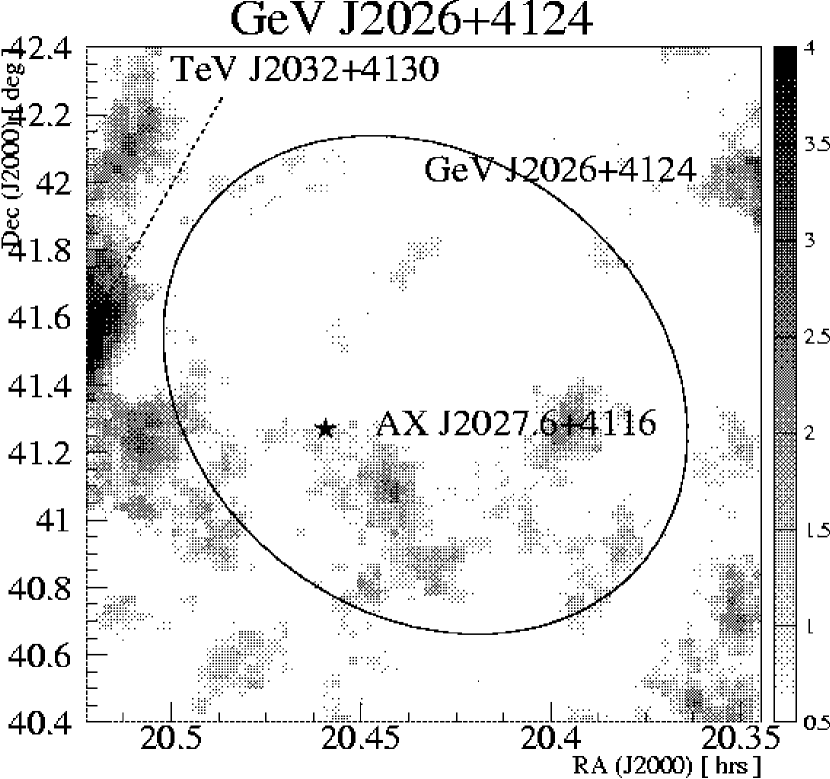
Results from a search for TeV -ray emission from the vicinity of five X-ray-studied GeV sources is presented. A number of possible X-ray counterparts have been suggested based on ASCA and ROSAT observations (e.g. the SNR CTA 1, and X-ray binary LS I+61∘303). Our search has yielded no convincing evidence for TeV emission at these GeV source positions and also a number possible counterparts. Preliminary upper limits in the range 1% to 10% of the Crab flux have been estimated above various energy thresholds 0.7 to 1.3 TeV.
1. Introduction & Data Analysis
A number of EGRET sources visible above 1 GeV [8,10]
were earlier studied in X-rays with ASCA [12],
revealing possible counterparts. The large field of view (FoV) of the HEGRA IACT-System
(Imaging Atmospheric Čerenkov Telescope System, see [11]) allows good
coverage of many GeV sources even if they were not the original targets of observation.
We have selected five of these GeV sources for further analysis:
GeV J0008+7304: This source could be associated with the nearby ( distant)
supernova remnant CTA 1 (radio shell 100′ diameter) and may contain a radio quiet
pulsar [3]. This pulsar may power
the extended, centre-filled non-thermal X-ray emission from CTA 1. Our observations were centred on the ROSAT point source
RX J0007.0+7302 [15]. Previous TeV observations by the CAT [7] and Whipple [5] collaborations
give upper limits for CTA 1.
GeV J0241+6102: The GeV contours are quite consistent with the unusual X-ray binary
LS I+61∘303 [4]. An association with the COS B
source 2CG135+01 in the past has led to various -ray production models for LS I+61∘303.
Our observations were centred on 2CG135+01.
GeV J1907+0557: This GeV source is located from the microquasar SS-433.
ASCA studies reveal a weak source possibly comprised of two pointlike components within the GeV 95%
contour. Our observations were taken from the HEGRA SS-433 archive.
GeV J2026+4124: ASCA studies reveal a single point source within the 95% contour. This
GeV source is from Cyg X-3.
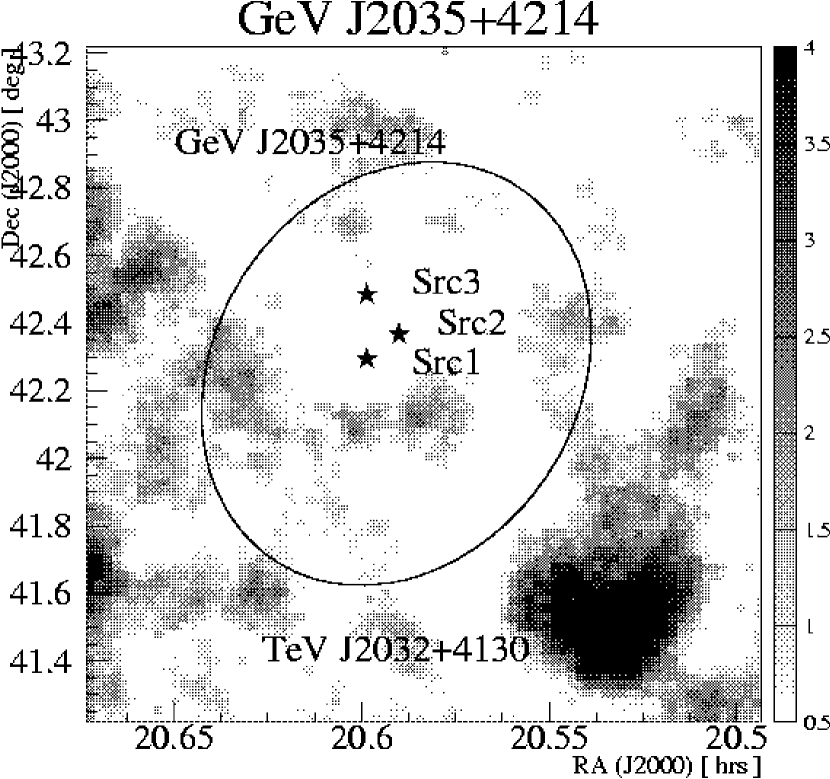
GeV J2035+4214: Two pointlike (possibly non-thermal, labelled Src1 & Src2) and one
marginally extended
(thermal, Src3) ASCA sources are seen within the GeV 68% contour. HEGRA observations of these latter two
GeV sources come from the extensive archive on Cyg X-3 and TeV J2032+4130 [14].
In these analyses we employ the mean-scaled-width [2] cut as a means to reject the cosmic-ray background, and also a cut in the angular separation between reconstructed (employing the so-called ‘algorithm 3’ [6]) and assumed arrival directions for each event. A point-source search utilises a cut. Extended sources with radius utilise a cut . A minimum of three telescope images per event are demanded in calculating and . The cosmic-ray background is estimated using the so-called template model [1,13]. Quite consistent results are also obtained using independent (e.g. so-called displaced) background models.
| Source | Obs. time | |||||||
| [h] | [TeV] | [deg] | [] | |||||
| —– GeV J0008+7304 —– | ||||||||
| GeVJ0008+7304 | 26.0 | 1.3 | 0.120 | 72 | 615 | 0.114 | +0.2 | 0.74 |
| RXJ0007.0+7302 | 26.0 | 1.3 | 0.120 | 70 | 598 | 0.114 | +0.2 | 0.73 |
| CTA 1e | 26.0 | 1.3 | 0.195 | 181 | 1618 | 0.114 | 0.2 | 1.09 |
| —– GeV J0241+6102 —– | ||||||||
| GeVJ0241+6102 | 28.8 | 0.8 | 0.120 | 55 | 338 | 0.130 | +1.5 | 1.74 |
| LS I+61∘303 | 28.8 | 0.8 | 0.120 | 59 | 380 | 0.130 | +1.3 | 1.50 |
| —– GeV J1907+0557 —– | ||||||||
| GeVJ1907+0557 | 114.1 | 0.7 | 0.120 | 183 | 1019 | 0.164 | +1.1 | 0.66 |
| AXJ1907.4+0549 | 114.1 | 0.7 | 0.120 | 187 | 1101 | 0.164 | +0.4 | 0.62 |
| —– GeV J2026+4124 —– | ||||||||
| GeVJ2026+4124 | 275.0 | 0.7 | 0.120 | 541 | 3429 | 0.168 | 1.3 | 0.29 |
| AXJ2027.6+4116 | 275.0 | 0.7 | 0.120 | 771 | 4497 | 0.168 | +0.6 | 0.42 |
| —– GeV J2035+4214 —– | ||||||||
| GeVJ2035+4214 | 275.0 | 0.7 | 0.120 | 784 | 4457 | 0.168 | +1.2 | 0.45 |
| AXJ2036.0+4218(Src1) | 275.0 | 0.7 | 0.120 | 620 | 4005 | 0.168 | 1.8 | 0.22 |
| AXJ2035.4+4222(Src2) | 275.0 | 0.7 | 0.120 | 663 | 4083 | 0.168 | 0.7 | 0.27 |
| AXJ2035.9+4229(Src3) | 275.0 | 0.7 | 0.120 | 584 | 3626 | 0.168 | 0.9 | 0.28 |
| a. Estimated -ray threshold energy for mean zenith : . | ||||||||
| b. Normalisation factor for the background . | ||||||||
| c. Statistical significance using Eq. 17 of [9]. | ||||||||
| d. 99% upper limit [ ph cm-2s-1] | ||||||||
| e. For CTA 1, a radius is used (the inner region for ROSAT spectral analysis [15]). | ||||||||
2. Results & Discussion
As a-priori targets, we have chosen the ASCA sources identified by [12], some pre-identified objects (e.g. CTA 1, LS I+61∘303 etc.), and also a point source centred on each GeV source (SIMBAD coordinates). Numerical results are presented in Table LABEL:my_009463-2:tab:numbers and 2D skymaps of excess significances are given in Fig LABEL:my_009463-2:fig:skymaps For all of our a-priori-chosen positions, no convincing evidence for TeV emission was found. Upper limits at the 99% confidence level were estimated for each position using the expected Crab event rate from Monte Carlo simulations scaled according to an estimate of the -ray acceptance in the FoV. These preliminary upper limits are in the range 1% to 10% of the Crab flux at various energy thresholds ( 0.7 to 1.3 TeV, based on the mean zenith angle of events). Further discussion and comparison with models will be presented at the conference.
References
1. Aharonian F.A, et al. 2002 A&A 393, L37
2. Aharonian F.A, et al. 2000 ApJ 539, 317
3. Brazier K.T.S. et al. 1998, MNRAS 295, 819
4. Frail D.A., Hjellming R.M. 1991 AJ 101, 2126
5. Hall T.A. et al. 2001 Proc 27th ICRC (Hamburg) OG167
6. Hofmann W., et.al 1999 Astropart. Phys. 10, 275
7. Khelifi B. et al. 2001 Proc 27th ICRC (Hamburg)
8. Lamb R.C., Macomb D.J. 1997, ApJ 488, 872
9. Li T.P., Ma Y.Q. 1983 ApJ 272, 317
10. Macomb D.J., Lamb R.C. 1999 Proc. 25th ICRC (Salt Lake City) OG 2.4.21
11. Pühlhofer G. et. al 2003 Astropart. Phys. submitted
12. Roberts S.E., Romani R.W., Kawai N. 2001, ApJS 133, 451
13. Rowell G.P. 2003 A&A(Supp) submitted
14. Rowell G.P., Horns D. et al. 2003 these proceedings
15. Slane P. et al. 1997, ApJ 485, 221
Chapter 11 Observations of 54 Active Galactic Nuclei with the HEGRA Cherenkov Telescopes
M. Tluczykont1, N. Götting1 and G. Heinzelmann1 for the HEGRA Collaboration2
(1) Institut für Experimentalphysik, Luruper Chaussee 149,
22761 Universität Hamburg
(2) http://www-hegra.desy.de/hegra
Abstract
In total 54 Active Galactic Nuclei (AGN) apart from Mrk-421 and Mrk-501 have been observed between 1996 and 2002 with the HEGRA Cherenkov Telescopes in the TeV energy regime. Among the observed 54 AGN are the meanwhile well established BL Lac type objects H 1426+428 and 1ES 1959+650. The BL Lac object 1ES 2344+514 and the radio galaxy M 87 show evidence for a signal on a 4 level. Fluxes resp. upper limits are given for each of the 54 AGN.
1. Introduction
In the commonly adopted view AGN are powered by a central super massive black hole with surrounded by an accretion disk. Two relativistic plasma outflows (jets) perpendicular to the accretion disk are pointing in opposite directions away from the center black hole . Most detections of extragalactic TeV –rays refer to objects of the BL Lac type, i.e. AGN having their jet pointing close to the observers line of sight. In this work the results of an analysis of the observations of 54 AGN with the HEGRA telescope system are presented. The HEGRA collaboration was operating a stereoscopic system of imaging air Cherenkov telescopes (IACT-System) and one stand alone telescope (not used for the present analysis) on the Canary island of La Palma (28.75∘ N, 17.90∘ W) at an altitude of 2200 m a.s.l. The stereoscopic reconstruction technique first introduced by HEGRA allows the complete reconstruction of the shower geometry and results in improved angular and energy resolutions as well as a very good -hadron separation (hadron rejection up to a factor of 100) using the so called mean scaled width (mscw) parameter. The data set used for this work amounts to a total exposure time before rejection of runs with poor quality of 1150 hours (without Mkn–421 and Mkn-501) corresponding to more than one year of continuous observations in moonless nights with the HEGRA IACT-System. After quality cuts, 1017 hours remain in the analysis. The applied event cuts are optimized on data of the Crab Nebula which is used as a calibration source in TeV astronomy. The significance of an excess is calculated following . Observed Crab-–rates are used to compute integral flux upper limits .
2. Results
A distribution of the significances for steady state emission (DC) of all analyzed objects is shown in Fig. 1. The objects 1ES 1959+650, H 1426+428, 1ES 2344+514 and M 87 show significances deviating from the expectation of a Gaussian distribution in case of pure background fluctuations.
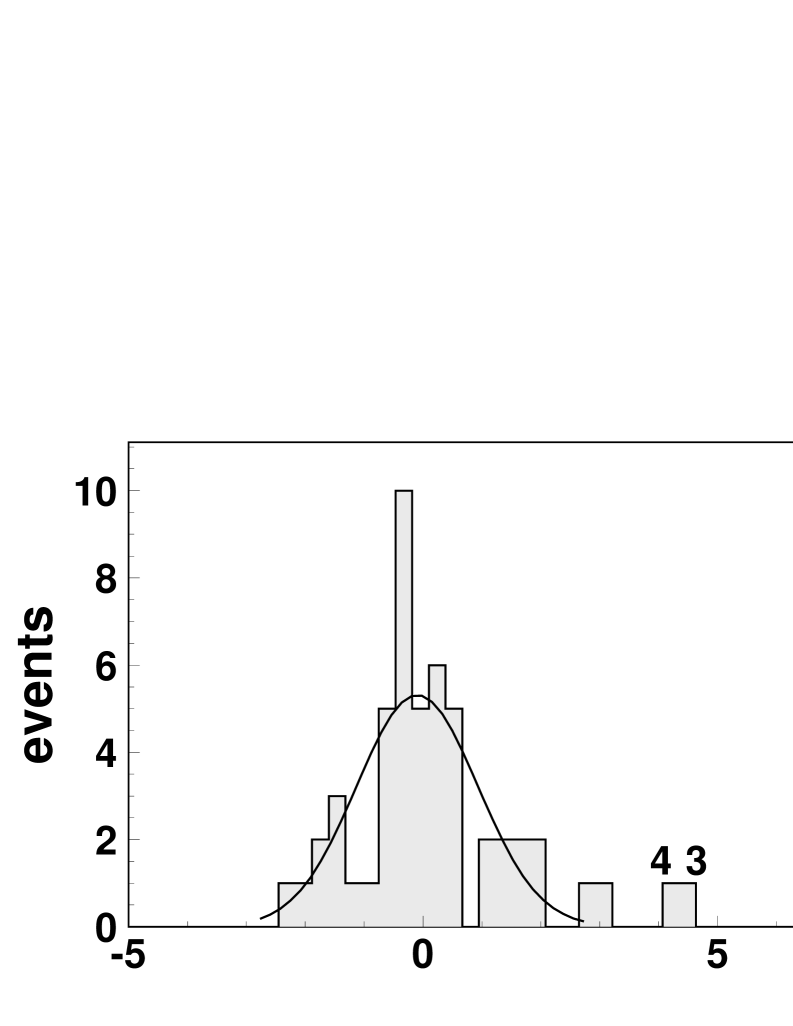
In Tab. 1 a list of all objects analyzed in this work ordered by ascending redshift is shown along with their observation time and the results of this analysis.
| Object | time | Ethr | ||||||
|---|---|---|---|---|---|---|---|---|
| h | # | # | TeV | |||||
| 1ES 0647+250 | —- | 4.1 | 12 | 10 | 0.74 | 0.13 | 3.65 | |
| MG 0509+0541 | —- | 15.8 | 60 | 50 | 0.79 | 0.11 | 2.61 | |
| M87 | .004 | 70.0 | 241 | 184 | 0.76 | 0.033 | ||
| NGC 315 | .016 | 14.6 | 31 | 33 | 0.75 | 0.05 | 1.29 | |
| NGC 1275 | .018 | 87.6 | 231 | 236 | 0.75 | 0.03 | 0.84 | |
| H 1722+119 | .018 | 5.1 | 21 | 14 | 0.76 | 0.21 | 5.51 | |
| PKS 2201+04 | .028 | 17.8 | 59 | 46 | 0.79 | 0.08 | 1.89 | |
| V Zw 331 | .029 | 4.1 | 9 | 9 | 0.75 | 0.09 | 2.44 | |
| NGC1054 | .032 | 57.9 | 134 | 155 | 0.75 | 0.02 | 0.46 | |
| 3C 120 | .033 | 25.4 | 64 | 70 | 0.78 | 0.05 | 1.14 | |
| NGC 4151 | .033 | 7.0 | 16 | 18 | 0.74 | 0.07 | 1.99 | |
| UGC01651 | .037 | 14.3 | 44 | 36 | 0.74 | 0.07 | 1.79 | |
| UGC03927 | .041 | 6.3 | 7 | 16 | 0.86 | 0.09 | 1.93 | |
| 1ES 2344+514 | .044 | 72.5 | 235 | 171 | 0.80 | 0.033 | ||
| Mkn0180 | .046 | 9.8 | 29 | 32 | 1.38 | 0.12 | 1.24 | |
| 1ES 1959+650 | .047 | 163.7 | 1202 | 454 | 1.17 | 0.053-2.200 | ||
| 3C 371.0 | .050 | 5.4 | 16 | 18 | 1.40 | 0.19 | 1.88 | |
| B2 0402+37 | .054 | 6.7 | 9 | 17 | 0.74 | 0.05 | 1.32 | |
| I Zw 187 | .055 | 16.0 | 44 | 32 | 0.78 | 0.09 | 2.21 | |
| Cyg-A (3C 405.0) | .057 | 59.0 | 159 | 161 | 0.77 | 0.03 | 0.83 | |
| 1ES 2321+419 | .059 | 22.3 | 53 | 66 | 0.76 | 0.03 | 0.86 | |
| 3C 192.0 | .060 | 2.9 | 8 | 7 | 0.78 | 0.20 | 5.01 | |
| 4C+31.04 | .060 | 3.0 | 8 | 9 | 0.74 | 0.14 | 4.01 | |
| BL Lacertae | .069 | 26.7 | 94 | 67 | 0.87 | 0.28 | 5.97 | |
| 1ES 1741+196 | .083 | 10.2 | 28 | 26 | 0.78 | 0.07 | 1.88 | |
| 4C+01.13 | .084 | 7.7 | 30 | 31 | 0.81 | 0.10 | 2.45 | |
| PKS 2155-304 | .116 | 1.8 | 4 | 4 | 4.62 | 0.27 | 0.39 | |
| 1ES 1118+424 | .124 | 2.0 | 5 | 4 | 0.79 | 0.24 | 5.88 | |
| 1ES 0145+13.8 | .125 | 3.2 | 2 | 1 | 0.75 | 0.06 | 1.73 | |
| EXO0706.1+5913 | .125 | 33.7 | 81 | 85 | 0.86 | 0.06 | 1.32 | |
| H 1426+428 | .129 | 258.5 | 796 | 624 | 0.77 | 0.024-0.060 | ||
| 3C197.1 | .130 | 15.0 | 22 | 24 | 0.79 | 0.05 | 1.17 | |
| 1ES 1212+078 | .130 | 2.4 | 6 | 8 | 0.78 | 0.17 | 4.26 | |
| 1ES 0806+524 | .138 | 1.0 | 2 | 2 | 0.86 | 0.29 | 6.19 | |
| 1ES 0229+200 | .139 | 3.0 | 11 | 8 | 0.78 | 0.17 | 4.25 | |
| RBS 0958 | .139 | 3.8 | 18 | 9 | 0.75 | 0.28 | 7.57 | |
| 1ES 1255+244 | .140 | 5.9 | 14 | 14 | 0.79 | 0.12 | 2.88 | |
| MS1019.0+5139 | .141 | 17.5 | 44 | 43 | 0.78 | 0.07 | 1.78 | |
| 1ES 0323+022 | .147 | 14.3 | 24 | 32 | 0.81 | 0.04 | 1.00 | |
| OQ 530 | .152 | 9.4 | 32 | 30 | 0.89 | 0.10 | 2.05 | |
| 3C 273.0 | .158 | 12.2 | 44 | 46 | 0.91 | 0.09 | 1.82 | |
| 1ES 1440+122 | .162 | 13.1 | 35 | 41 | 0.77 | 0.08 | 1.95 | |
| PKS 0829+046 | .180 | 18.0 | 59 | 55 | 0.81 | 0.06 | 1.35 | |
| PG 1218+304 | .182 | 3.9 | 7 | 8 | 0.75 | 0.12 | 3.22 | |
| 1ES 0347-121 | .185 | 1.9 | 13 | 7 | 1.34 | 0.56 | 5.90 | |
| 1ES 0927+500 | .186 | 13.3 | 30 | 29 | 0.79 | 0.06 | 1.44 | |
| PKS 2254+074 | .190 | 16.3 | 44 | 48 | 0.77 | 0.05 | 1.27 | |
| MS0317.0+1834 | .190 | 2.7 | 5 | 6 | 0.74 | 0.12 | 3.30 | |
| 1ES 1011+496 | .200 | 2.0 | 1 | 3 | 0.81 | 0.11 | 2.58 | |
| 1ES 0120+340 | .272 | 18.9 | 36 | 44 | 0.75 | 0.04 | 1.03 | |
| 2E 0414+0057 | .287 | 4.5 | 18 | 15 | 0.81 | 0.13 | 3.07 | |
| S5 0716+714 | .300 | 1.7 | 6 | 4 | 1.46 | 0.38 | 3.54 | |
| 3C 066A | .444 | 1.3 | 3 | 3 | 0.75 | 0.17 | 4.70 | |
| PKS 0219-164 | .698 | 1.7 | 5 | 10 | 1.67 | 0.27 | 2.04 |
The results of the observations of the BL Lac objects 1ES 1959+650 and H 1426+428 as well as a tentative detection of a signature of absorption by pair production on the diffuse extragalactic background radiation in the TeV spectrum of H 1426+428 were reported elsewhere . The results of a dedicated analysis of the M87 data are presented separately at this conference and have been published recently . The first TeV detection of 1ES 2344+514 was reported by the Whipple group in 1998 with 6 in one night only . The results of the HEGRA observations of 1ES 2344+514 of the year 1997 and 1998 were first reported by with a DC significance of 3.3 . The analysis presented here includes the complete dataset (1997 – 2002) and results in an excess of –like excess events (Non = 235, Noff = 171) on a significance level of 4.4 and no evidence for burst-like behaviour. However, the excess is accumulated almost exclusively in the observation periods of August to November 1998 and September 2002 ( excess events). In Fig. 2. the distribution of the squared angular distance of the reconstructed shower events to the object position as well as a plot of the excess rate vs. observation periods are shown.
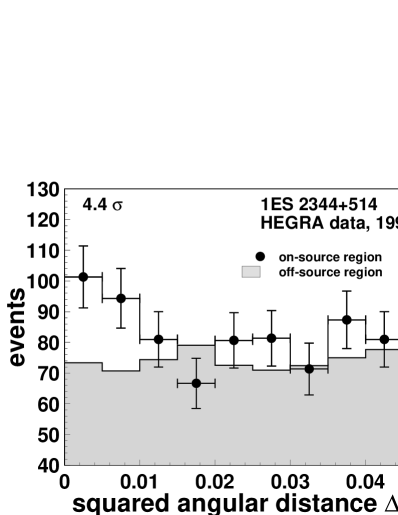

The observed excess results in a flux of (E0.80 TeV) = corresponding to 3.3% of the Crab-Nebula flux.
3. Summary
The two objects 1ES 1959+650 and H 1426+428 can be considered as well established sources of TeV -radiation. The evidence for 1ES 2344+514 being a TeV source is strong taking the detection by the Whipple collaboration into account. The detection of TeV –rays from M87, if confirmed, would be the first detection of photons in the TeV energy regime of an AGN not classified as a BL Lac object.
Acknowledgements
The support of the German Federal Ministry for Education an Research BMBF and of the Spanish Research Council CICYT is gratefully acknowledged. We thank the Instituto de Astrofísica de Canarias (IAC) for the use of the HEGRA site at the Observatorio del Roque de los Muchachos (ORM) and for supplying excellent working conditions on La Palma.
1. Rees, M. J. 1984, Ann. Rev. Astron. & Astroph. 22, 471
2. Daum, A. et al. 1997, Astropart. Phys. 8, 1
3. Mirzoyan, R. et al. 1994, Nucl. Inst. Meth. A 351, 513
4. Li, T. P. and Ma, Y. Q. 1983, ApJ 272, 317
5. Helene, O. 1983, Nucl. Inst. Meth. 212, 319
6. Aharonian, F. A. et al. 2003 submitted to A&Ap, astro-ph/0305275
7. Aharonian, F. A. et al. 2003, A&Ap 403, 523
8. Götting, N. 2003, These Proceedings
9. Aharonian, F. A. et al. 2003, A&Ap 403, L1
10. Catanese, M. et al. 1998, ApJ 501, 616
11. Konopelko, A. 1999, Proc. 26th ICRC 3, 426
Chapter 12 Study of the VHE Gamma Ray Emission from the AGN 1ES1959+650 with the HEGRA Cherenkov Telescope CT1
Nadia Tonello1 and Daniel Kranich1, for the HEGRA Collaboration
(1) Max-Planck-Institute for Physics (Werner-Heisenberg-Institute), Foehringer Ring 6, Munich 80805, Germany
Abstract
The BL Lac object 1ES1959+650 has been observed by the HEGRA Collaboration in the years 2000, 2001 and 2002. Here we report on the results obtained in 2002 with the standalone CT1 telescope. While the source has only shown weak TeV activity until mid-May 2002, significant TeV emission has been observed later in 2002. During 2002 the source has been monitored for about 200 hours, of which 30 hours data were taken under moonlight conditions. The signal from the ’dark’ time 2002 data set showed a significance of 11. Preliminary results on the light curve and the spectrum of the 2002 ’dark’ time data up to 45∘ zenith angle are presented.
1. Introduction
The galaxy 1ES1959+650 has a strong emitting jet from the nucleus, oriented along the line of sight. It was predicted by [8] to be a TeV -ray emitter candidate from scaling its X-ray observed spectrum, and from studies based on the synchrotron-self Compton model [2]. It was detected for the first time as a TeV -ray emitter by the Telescope Array experiment [7], that reported a signal with a significance of 3.9 after 56.7 hours of observation in 1998.
In 2000 and 2001 the HEGRA collaboration observed 1ES1959+650 with the CT System for 94 hours. The source was at low state and an averaged signal of 5.4 of significance level was recorded [3]. In May 2002 the VERITAS Collaboration reported a strong TeV -ray signal from 1ES1959+650 [11]. The detection had a significance of 13 from observation in 2 consecutive nights. The followed observations by the HEGRA Collaboration confirmed 1ES1959+650 as a highly variable VHE -ray source [1,4]. The results of observations with the HEGRA CT System are reported elsewhere on this conference.
2. Observations with the HEGRA CT1 Telescope and Data Analysis
The HEGRA Cherenkov Telescopes are installed at the Roque de los Muchachos Observatory on the Canary Island of La Palma (28.75∘ N, 17.89∘ W, 2200 a.s.l.). The telescope CT1 [6] has a mirror area of 10.3 m2 and a camera of 127 pixels of 0.25∘ diameter each. The camera has a FOV of 3∘ diameter. In zenith position, the telescope has an energy threshold of 750 GeV and a typical source discovery sensitivity of 3.5 , with in hours, for a Crab-like source. Table 1 summarizes the CT1 observation times of different background light conditions of 1ES1959+650. The observation angle ranged between 36.4∘ and 54.2∘ (with rather few data above 45∘). A total of 1.6 million triggers have been recorded in 2002.
| Observation conditions | 2000 | 2001 | 2002 | |
|---|---|---|---|---|
| nom | good ’dark’ night conditions, nominal HV | 58 h | 86 h | 156 h |
| hv00 | weak moonlight, no HV reduction | - | 24 h | 8.1 h |
| hv04 | moonlight, 4% HV reduction | - | 12 h | 16.1 h |
| hv08 | moonlight, 8% HV reduction | - | 8 h | 6.1 h |
| hv12 | moonlight, 12% HV reduction | - | 7 h | 2.9 h |
Quality cuts are applied to the raw data in order to reject accidental noise triggers and nights with bad atmospheric conditions. The image parameters of the recorded events were calculated. The adopted /hadron separation method is described in [5]: the so-called dynamical super-cuts in the parameters DIST, WIDTH and LENGTH are applied, in order to take into account variations of the image parameters with the zenith angle, the energy of the primary particle and the impact parameter of the shower (estimated mainly from the image parameter DIST). The ALPHA parameter distribution after the dynamical super-cuts for ’dark’ nights data, taken up to a zenith angle of 45∘, is shown in Figure 1. The number of recorded events has been estimated by fitting this distribution with a Gaussian function in the signal region 0 and a smooth background (BG) has been estimated by fitting the same data sample with a polynomial of second order (without linear term) in the range , where no signal is expected. The BG was then extrapolated down to ALPHA = 0∘. In Figure 1b the BG parametrization is verified for a pure BG sample.
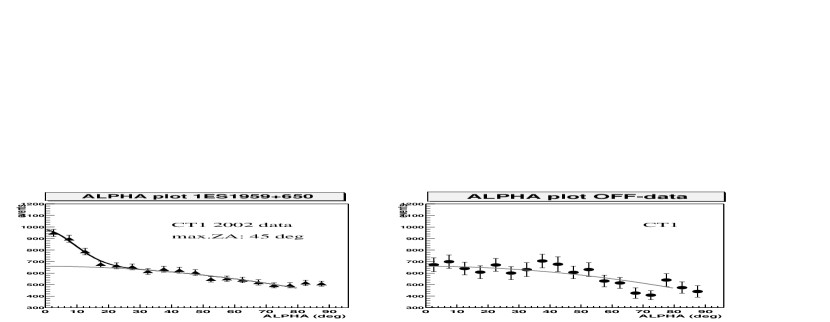
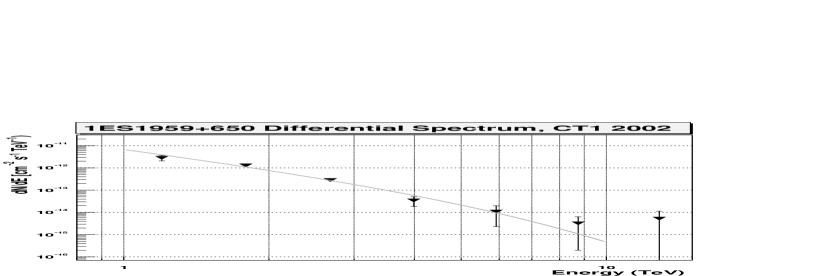
3. Results
The CT1 data taken in 2000 and 2001 (not shown here) reveal that the source was in a low state. The averaged estimated -ray flux above 1TeV was between 5% and 6% of the Crab flux at the same energy range [9,10].
The ALPHA distribution analysis for the data taken during the year 2002 for 150 h of observation (Figure 1) shows a -ray signal from 1ES1959+650 with a significance of 11.1, with 664 40 excess and 1672 37 BG events for ALPHA 13∘. The error takes the BG extrapolation uncertainty into account.
The TeV light curve of the year 2002 is shown in Figure 3 together with the 2-12 keV activity monitored by RXTE ASM [12]. Two periods of stronger activity were recorded in that year: one in May (MJD 52414), when the Crab flux was reached, and a flare in July (MJD 52460 and 52470). The first comparisons between the X-ray fluxes and the TeV fluxes show no evident correlation between the two considered energy ranges. The differential spectrum of the source is shown in Figure 2. It can be fitted with a power law function, with a spectral index = 3.49 0.19 (/d.o.f. = 9.1 /6). On the other hand, the Extragalactic Background Light should already affect the spectrum above a few TeV. We tried also a power law approach modified by an exponential energy cutoff. Using a cutoff of Ec = 2.4 TeV [3] resulted in a somewhat better fit with = 2.54 0.21, /d.o.f. = 7.1 /6. The data quality is too poor above a few TeV to draw decisive conclusions.
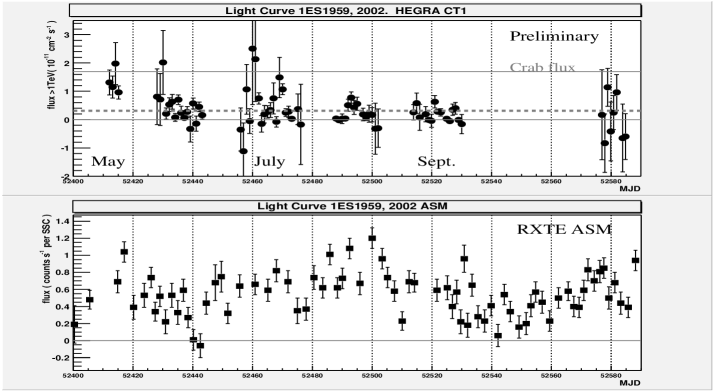
4. Discussion and Conclusions
The AGN 1ES1959+650 has been observed with the HEGRA CT1 telescope. In May and July 2002, a short period of high emissions in the TeV range was observed, followed by a gradual decrease. The analysis of the 150 ’dark’ hours of observations with good conditions show a signal with a significance of 11.1. The averaged spectrum can be described by an unbroken power law, but a cutoff around 2.4 TeV is equally likely. A simple attempt to study X-ray-TeV correlation showed no significant correlation. In particular, we note that the X-ray flux did not vary significantly around the TeV flare at MJD 52460-52470. It is expected that next generation low threshold IACTs might allow detailed clarifying studies.
Acknowledgments. We would like to thank the IAC for the excellent working conditions on the La Palma Observatorio Roque de los Muchachos. We acknowledge the rapid availability of the RXTE ASM data. This work was supported by the German Ministry of Education and Research, BMBF, the Deutsche Forschungsgemeinschaft, DFG, and the Spanish Research Foundation, CICYT.
References
1. Aharonian F. et al. 2003, submitted to A&A Letters, astro-ph0305275
2. Costamante L., Ghisellini G. 2002, A&A 384, 56
3. Horns D. et al. 2002, The Universe Viewed in Gamma-Rays, Kashiwa, Japan
4. Konopelko A. et al. April 2002, APS/HEAD Meeting, Albuquerque
5. Kranich D. 2001a, PhD Thesis, TUM, Munich, Germany
6. Mirzoyan R. et al. 1994, NIM A 351, 513
7. Nishiyama T. et al. 1998, Proc. 26th ICRC , OG.2.1.21
8. Stecker F.W., de Jager O.C., Salamon M.H. 1996, ApJ 473, L75-L78
9. Tonello N., Kranich D. March 2002 , DPG Tagung, Aachen, Germany
10. Tonello N. PhD Thesis in preparation, TUM, Munich, Germany
11. Weekes T. et al. 17 May 2002, IAU, Circular No.7903
12. http:heasarc.gsfc.nasa.govcgi-binxteweather
Chapter 13 Observation of VHE Gamma Rays from the Remnant of SN 1006 with HEGRA CT1
Vincenzo Vitale,1, for the HEGRA Collaboration
(1) Max Planck Institute for Physics,
Föhringer Ring 6, Munich, Germany
1. Abstract
The HEGRA collaboration observed the shell-type remnant SN1006 with the telescope CT1 for 219 h. For the observations we pointed the telescope towards the SNR center. An excess is observed from NE part of the rim with a statistical significance of 5 . Only large zenith angle (ZA) observations ( 70∘) are possible from the telescope site. The energy threshold is 18 TeV. We discuss the analysis and the problems related to large ZA observations.
2. Introduction
Supernova remnants (SNRs) are considered as the most likely sources of galactic cosmic ray. The shell type remnant G327.6+14.6 is originated from the SN 1006. This remnant is nearly circular (angular diameter 0.5∘, radius of 9.5 pc, distance 2.18 0.08 Kpc )[1], limb-brightened and shows the NE and SW regions significantly brighter than the rest of the shell (bipolar or barrel-shaped)[1]. The shell expands with velocity 2890 100 km/s [2] into a low density ISM. ASCA and ROSAT detected non-thermal X rays from the NE (the brighter one) and SW regions [5],[6]; while Cangaroo [7] detected TeV rays only from the NE part of the rim. Non-thermal X rays were explained as synchrotron emission from 10-100 TeV electrons . The possible origins of the TeV radiation are : 1) the above electron population, which can produce TeV rays via inverse Compton scattering on the CMBR and local IR photons ; 2) a possible contribution from accelerated hadrons ()[6].
3. Observations and Analysis
We observed SN 1006 for 219 hours from 1999 to 2001 with the HEGRA telescope CT1. CT1 is part of the HEGRA cosmic ray detector complex on La Palma (28.75∘ N, 17.9∘ W, 2225 m asl). SN 1006 (Ra 15:02:48.8, Dec -41:54:42) culminates at less than 20∘ elevation when observed from La Palma. Therefore only large zenith angle (ZA) observations are possible. We collected in total 346000 so-called ON-source events restricting observations to a narrow zenith range between 71-73∘ ZA as well as a small set of OFF-source data at the same ZA. We recorded also a large background sample of muons passing through the camera. Such muons leave narrow images, which might mimic events. The data reconstruction proceeded in the following way: At first we applied the usual filter cuts rejecting accidental noise triggers or event samples recorded during non-optimal atmospheric conditions [8,9,10]. As a next step the image parameters were reconstructed and various cuts applied to select events. Because of the large ZA observations we had to modify considerably our standard /h separation procedure. The image dimensions shrink with the ZA (roughly ). The shape of small images is determined with less precision than in the zenith position because the pixel diameter is constant. Therefore the /h separation power decreases. The change of the image parameters could be either evaluated by Monte Carlo simulations or by studying real hadron events and assuming that image parameters would scale in the ratio. We opted for the second procedure and studied a large sample of hadronic images covering the entire ZA range between 0∘ and more than 70∘ [10]. Up to 45∘ we could verify the scaling of the image parameters with events from a large sample of Crab Nebula and Mkn 421 data. We assumed that the scaling is also applicable to data at 72∘ ZA. ( An error in the extrapolation should not fake a possible source but would mainly result in a less than optimal selection of s). The scaled image cuts in Width and Length were applied to the data. Muons are more likely to generate background at large ZA observations because muons are more likely to pass simultaneously the glass envelope of many PMs. We studied the muon rate with closed camera and found a raw rate of 5.110-3 Hz at 72∘ ZA. Efficient muon rejection cuts were developed [10] from comparing the measured muon event topology with MC simulated candidates. Only a fraction of 1.810-3 survived the cuts while the majority of s passed these cuts.
For the search of a possible excess of localized emission around SN 1006 we applied the False Source Method (FSM). A grid of 0.1∘ step size was defined in the FOV and at each knot we searched for a pointlike source. This method works also for slightly extended sources underestimating somewhat the flux. At each knot we applied the usual Distance cut and applied a 12.5∘ cut in the ALPHA distribution. The remaining sample is basically a coarse measurement of the hadron flux across the FOV (it should be noted that there is a twofold ambiguity because one is not able to distinguish the head/tail of the shower). Fig 1A shows the reconstructed hadronic background as well as a possible excess. Already at this step an excess around RA=15:04:10 and DEC =-41:40:00 is visible. In the next step we tried to subtract the background by extrapolating in each ALPHA distribution the background in the 0-12.5∘ ALPHA range. For this procedure we fitted a second degree polynomial (without the linear term) to the data between 20 and 80∘. Then we subtracted the extrapolated background into the low ALPHA regime from the actual data and determined the excess. The procedure has been extensively tested [9]. The excess map is shown in Fig 1B. A clear excess is found at the NE rim . Significance is in part influenced by the background statistics. We improved the background precision by averaging over a ring around the center of the FOV but leaving out a section, around the position under test , which might contain events [10]. This method increases the background statistics by a factor 3 and reflects the true behavior at the low ALPHA range. The lower panel in Fig 1 shows the ALPHA distribution of the excess bin together with the higher statistics background distribution in the ring. An excess of 103 17 over a background of 225 events has been determined using the recommended procedure [7]. The significance of the excess is 5.6 . The excess location is nearly coincident with the observation of the Cangaroo group. If we allow for an uncertainty 9 bins we obtain a reduced significance of 5.1. We verified the correct positioning of the telescope at large ZA by measuring the position of two bright stars in the FOV. The positions of Cen (mag=3.13) and Lup (mag=2.68) allowed us to determine the excess position with 0.1∘ precision. For a 5 excess it is not possible to determine a spectrum. From MC simulations including all above mentioned cuts we calculated a threshold of 18 TeV and the collection area assuming an unbroken powerlaw with spectral index of -2.3 [5]. Using the experimental data and the parameters from the simulation we calculated a preliminary integral flux of (18 TeV) = (2.5 0.5stat)10. The evaluation for other photon indices and of the systematic error (at least 35) is still ongoing.
4. Summary and Conclusions
From the analysis of the large zenith angle observation of SN 1006 we conclude: a) that we see evidence (5.1 ) for -emission at the NE rim of the shell coinciding within 0.1∘ with the Cangaroo observation at lower energies. b) The threshold of CT1 at 72∘ ZA is 18 TeV assuming an unbroken powerlaw with a spectral coefficient of -2.3 . c) A preliminary integral flux of (E18 TeV) = (2.5 0.5stat)10 has been determined. The systematic error is still under study but is at least 35. d) We observe no excess at the SW rim and determined an upper limit of 1.610 (C.L. 99.5) We conclude further that it is possible to carry out searches for sources at large ZA although limitations from the pixel size and the large threshold are obvious.
REFERENCES: 1. Long & al. 2003, ApJ 586 2. Ghavamian & al. 2002, ApJ 572 3. Koyama & al. 1995, Nature 378 4. Willingale & al 1996, MNRAS 278 5. Tanimori & al. 1998, ApJ 497L 6. Berezhko & al. 2002, A& A 395 7. Li & Ma 1983, ApJ 272 8. Kestel M. PhD th. 9. Kranich D. 2001, PhD th. 10. Vitale V. PhD th.,in prep.