Ahmedabad – 380 009, India
email: ashok@prl.ernet.in, orion@prl.ernet.in
The enigmatic outburst of V445 Puppis - a possible Helium nova?
Abstract
spectroscopic and photometric observations are reported for the enigmatic, nova-like, variable V445 Puppis which erupted at the end of 2000. The near-IR spectra are hydrogen-deficient and unusually rich in CI lines. The important CI lines are found to be positioned at 1.133, 1.166, 1.175, 1.189, 1.26 and 1.689 m. Model calculations for the CI lines are done to make the identification of the lines secure. Photometric data, taken on January 2.90 UT, 2001 shortly after the outburst, show the formation of an optically thin dust shell around V445 Puppis. The temperature and upper limit for the mass of the dust shell are estimated to be 1800K and ⊙ respectively . A subsequent episode of massive dust formation - indicated by the observed, deep visual dimming - is also seen in images of early November 2001. V445 Puppis has shown two unusual properties for a nova i) the hydrogen-deficiency and He/C enrichment of the object as seen from optical and IR data and ii) synchrotron radio emission which was detected nearly a year after it’s outburst by other workers. The strange nature of the object is discussed and it is shown that it is difficult to place it in the known categories of eruptive variables viz. novae (classical, recurrent or symbiotic); born-again AGB stars; the new class of eruptive variables like V838 Mon; and RCB/HdC stars. Tentative evidence for an accretion disk and binarity of the V445 Puppis system is presented. It is debated whether V445 Puppis is a rare Helium nova or an unique object.
Key Words.:
Stars: individual: V445 Puppis - Infrared: stars - Stars: novae - Techniques: spectroscopic1 Introduction
V445 Puppis - a nova like object - was first reported to be in outburst on
30 December 2000 by Kanatsu (Kato and Kanatsu 2000). The exact
time of the of the object’s eruption is not
certain - an aspect that is discussed in Sect. 3.1. Spectra in the
visible region, taken in the early stages after the detection, showed many
permitted lines of FeII, CaI, CaII, OI and NaI (Fujii 2001; Liller 2001a, b;
Shemmer et al. 2001; Wagner et al. 2001a, b). A striking feature of
the optical spectra was the absence of Hydrogen lines in the spectra. Near
IR spectra reported here also confirm the absence of Paschen and Brackett
Hydrogen lines in the bands. The deficiency of Hydrogen in V445 Puppis
shows that it is not an usual nova and shows the strangeness of the object.
This point is also made by Wagner et al. (2001a) who state that the
optical spectrum of
V445 Puppis is not typical of classical FeII type novae, recurrent novae or
symbiotic novae. Mid IR (3-14 m) spectroscopy by Lynch
et al. (2001) reveal only a smooth featureless continuum deviating
significantly from a black body distribution and which can be explained by
invoking the presence of dust. Another interesting development in
the evolution of
V445 Puppis was the detection at radio wavelengths almost a year after
the outburst (Rupen et al. 2001a). Radio emission has been seen in a few
novae (Seaquist 1989) but such emission has the characteristics
of thermal bremsstrahlung radiation emitted by ionized gas. In
V445 Puppis, non-thermal synchrotron radiation is seen which is rather
rare (another example of this being the old nova remnant GK Persei).
Thus V445 Puppis has all the hallmarks of being a very interesting object.
In this work, we mainly present spectroscopic results (and also some photometric data) from observations of V445 Puppis made at five, fairly evenly-spaced epochs. These should help in following the temporal evolution of V445 Puppis and understanding it’s puzzling nature. From our results it would appear that V445 Puppis is a fairly unique object and could be a Helium nova. A Helium nova is believed to occur due to a thermo-nuclear runaway on the surface of a degenerate white dwarf accreting Helium from it’s helium-rich companion (Kato et al. 1989). The nova ejecta, in such an outburst, is expected to be hydrogen-deficient as found in V445 Puppis.
2 Observations
Near-IR spectra at a resolution of 1000 were obtained at the
Mt. Abu 1.2m telescope using a Near Infrared Imager/Spectrometer
with a 256256 HgCdTe NICMOS3 array. We present here the spectroscopic
observations of five days viz. January 1.63 UT, January 20.81 UT,
February 1.73 UT, February 18.70 UT
and March 1.66 UT, 2001.
In each of the , and bands a set of at least two spectra were
taken. In each set the star was offset to two
different positions of the slit (slit width 2 arc sec. ). The
signal to noise ratio of the spectra, as determined using IRAF, is moderate
and ranges between 30 to 60 in the bands.
The exposure times for the spectra were typically between 60 to 120 seconds.
Spectral calibration was done using the OH sky lines
that register with the spectra. The comparison star HR 2988 was used for
ratioing the spectra in all cases. We believe the telluric
lines, present in the spectra, have been well removed in the process of
ratioing. This is because of i) the close proximity of
HR 2988 to V445 Puppis and ii) also the small time gap (typically 10-15
minutes)
between observing the spectra of V445 Puppis and HR 2988 in any of
the
bands. This ensures that
both the stars were at a similar airmass.
The ratioing process should therefore
remove the telluric lines reasonably
well.
Photometry in the bands was performed on January 2.90 UT and November 1.96 UT, 2001 using the NICMOS3 array, mentioned above, in the imaging mode. The sky was photometric on both days with a typical seeing of 1 arc second. Several frames in 4 dithered positions, offset from each other by 30 arcsec, were obtained in all the filters. The times for all the individual frames was 100 ms on 2 Jan. 01 and ranged between 30 to 60s on 1 Nov. 01. The total integration time in each of the dithered positions are as follows i) 400 ms in each of the bands for 2 Jan.01 and ii) 3 minutes in and 90s in on 1 Nov. 01. The sky frames were generated using these dithered frames. The mean air-mass at the time of observations for V445 Puppis was 1.79 on 2 Jan. 01 and 1.59 on 1 Nov. 01. The UKIRT standard star HD 77281 was used for photometric calibration on 2 Jan. 01 and observed soon after V838 Mon. As a crosscheck, HR 2956 ( = 6.50, spectral type B7V) was also observed. The adopted magnitudes for HR 2956 were taken from the 2MASS survey to be = 6.642, = 6.723 and = 6.686. For the 1 Nov 01 observations, FS 13 ( = 10.517, = 10.189 and = 10.137) was used as the standard star (Hunt et al. 1998). The atmospheric extinction corrections were done assuming average values of J = 0.15, H = 0.15 and K = 0.1 mag for the Mt. Abu Observatory site. The results from the photometry are presented later in Table 2. The near-IR photometric and spectroscopic data were all reduced using IRAF.
3 Results
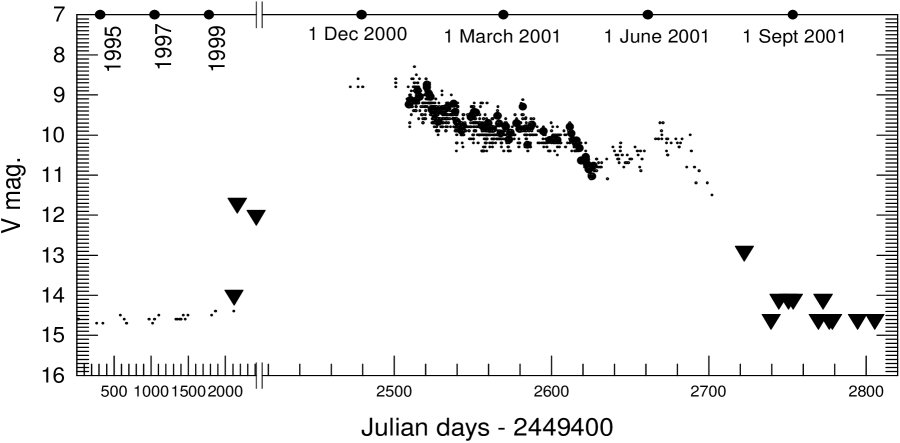
3.1 The Light Curve of V445 Puppis
The outburst date of V445 Puppis is uncertain but can be constrained from the VSNET reports. This part of the sky has been monitored by Takamizawa between March 1994 to December 1999 and he does not find any object brighter than 14 magnitude on his photographic plates (IAUC 7552). Subsequent photographic records from VSNET (http://www. kusastro.kyoto-u.ac.jp.vsnet) show that the object was fainter than 12th magnitude on 26 September 2000 and had brightened to 8.8 magnitude by 23 November 2000. Thus the outburst occured between 26 Sept. to 23 Nov. 2000. Lynch et al. (2001) have inadvertently concluded that the outburst occured between 3 to 31 December 2000. The progenitor of V445 Puppis has been identified by Platais et al. (2001) as a 13.6 magnitude star (identification number 22727221) in the U.S. Naval Observatory CCD Astrograph Catalog (UCAC1). In the the USNO A2.0 catalog, the corresponding identification number is 0600-06937901 with the blue and red magnitudes listed as 13.8 and 13.2 respectively. Fig. 1 shows the evolution of the light curve for V445 Puppis. While the decline of the light curve is similar to that of a slow nova, the outburst amplitude of approximately six magnitudes is small for a classical nova. Other differences between the object and classical novae are discussed in Sect. 4.
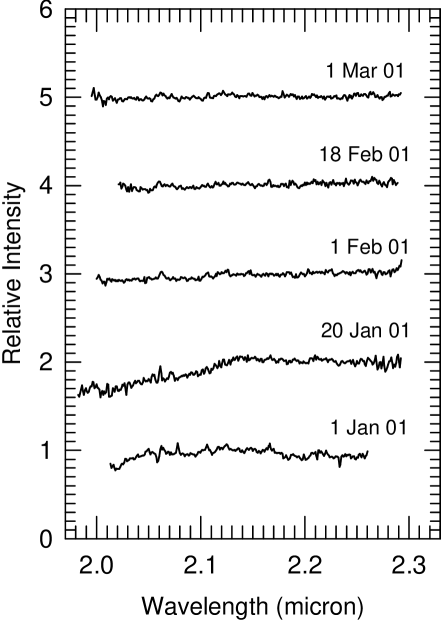
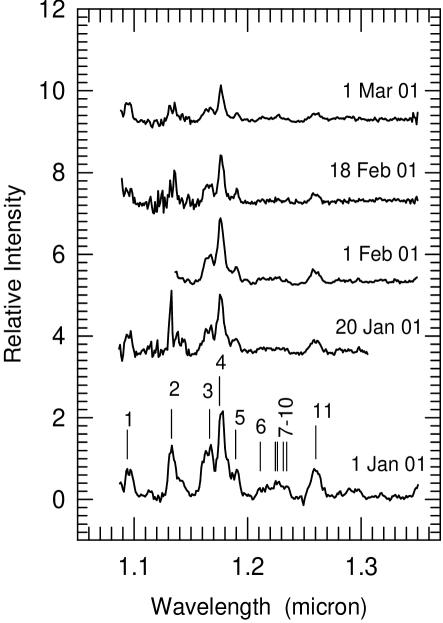
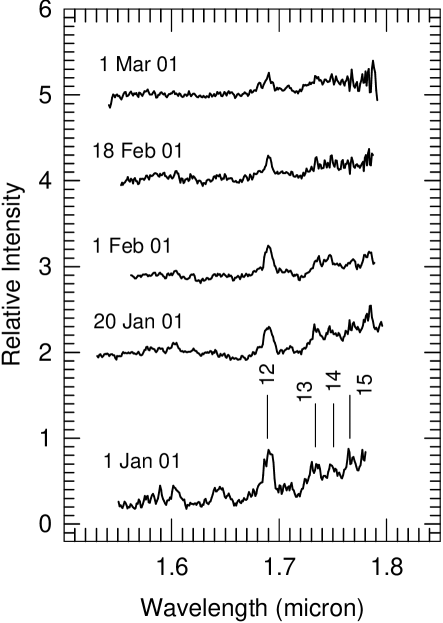
3.2 spectroscopy
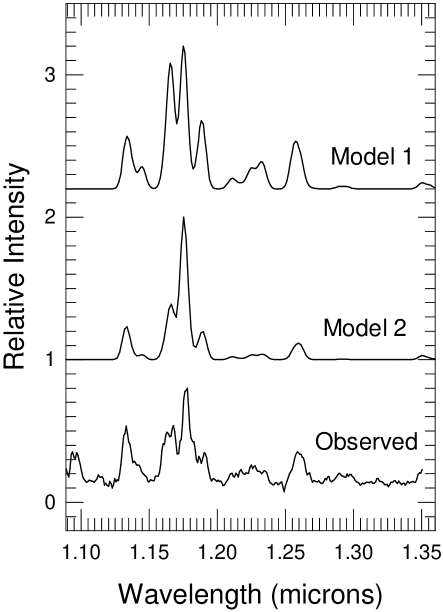
The main thrust of this work has been in the spectroscopy of V445 Puppis. The object was observed at regular intervals between 1 Jan. to 1 March 2001. The spectra are shown in Figs. 2, 3 and 4. Of these, the more interesting spectra are in the band where several emission lines can be seen. The emission lines that are seen in the and spectra are numbered in Figs. 2 and 3. Their identification and other relevant details, are listed in Table 1. Almost all the lines that are present appear to be due to neutral Carbon. The identification of the CI lines is done on two bases. First we have compared the strengths and positions of these lines with the laboratory IR spectra of CI as given by Johansson & Litzen (1965) and Johansson (1966) and a good match is found. Furthermore, we have computed a simple model spectrum that should arise from CI emission from the shell. For this spectrum, we have selected 170 of the strongest CI lines between 1.08 and 2.5 m with their transition probabilities, from the atomic line list compiled by Kurucz (http://kurucz.harvard.edu/linelists.html). The strength of any line is computed as follows. If the line originates in a downward transition from level 2 to 1 then, the luminosity of the line line is given by:
| (1) |
where 2 is the number density of CI atoms in the
excited state 2,
21 is the Einstein coefficient of spontaneous emission,
is the energy of the emitted photon and is the volume of the
emitting gas.
From Eq. (1), it is seen that, the strength of any line will essentially depend only on 21 and 2. If the populations of the upper level (2) for the different CI lines are temporarily assumed to be the same, then the line strength depends basically only on 21. Knowing the transition probabilities, we have computed the relative line strengths from Eq. (1). We assume that the shape of each line can be reasonably represented by a Gaussian whose FWHM has been chosen to be approximately 1500 km/s - representative of the observed linewidths in V445 Puppis. Co-addition of all the Gaussians - corresponding to all the lines- yields a model spectrum which is shown in Fig. 5 (labeled as model 1). The observed band spectrum of 1 Jan. 01, in which the emission lines are most prominent, is also shown in the same figure for comparison. A more accurate calculation has taken into account the population of the upper levels 2 in calculating the relative line strengths. Assuming the emitting gas to be in local thermal equilibrium, 2 will be given by a Boltzmann distribution viz.
| (2) |
where is the partition function, is the temperature of the gas,
02 is the energy difference between the ground state
and level 2, 2 is the statistical weight of the upper level
and is
the total number density of the Carbon atoms. The energy level values for the
different states (to compute 02) and 2 values have
been taken from Kurucz’s line list. The partition function values, for
different temperatures, have been taken from Allen (1976) and Aller (1963).
Nova shell ejecta have temperatures typically in the range 4000-5000K
(Williams 1994). However we find slightly higher temperatures reproduce the
observed spectra better.
In particular, the model spectrum computed for T = 8000K (labeled as model 2)
is
also shown in Fig. 5. Changes in the adopted temperature do change the
relative
strength
of the different lines,but marginally, and not in any
drastic fashion.
However, the primary purpose of the simulated spectra
of Fig. 5 is only to secure the identification of the CI
lines. Fig. 5 only shows graphically the expected positions of the CI lines and
gives a rough simulation of their expected strengths. As may be seen all the
strong CI lines are reproduced, and to a large extent, even the weaker lines.
Based on the results of Fig. 5, it would appear
reasonable to identify most of the observed lines in the band with CI.
The model spectra for and have also been computed but not shown here.
The model results for band show the strongest CI line to be at
1.69 m which matches what is observed at that wavelength. A few
other lines between 1.7 to 1.8 m are predicted as well ( weaker
than the
1.69 m line). Their positions have been marked in the band
spectra of Fig. 3 and these lines are also seen in our data. In the band
no line of any significant strength is predicted. This agrees with the rather
featureless band spectra that we observe (Fig. 4).
In Table 1, we have given the equivalent
widths for the emission features seen in the spectra
of 1 Jan. 01 where the lines are the
strongest. Since some of the features are blended, we have given
the combined equivalent width of the blend. In particular,
combined equivalent width’s have been given in Table 1 for
features 3 to 5 and 6 to 10 which are blended. The reality of the
features can be judged by comparing their equivalent widths with
those of modulations in the continuum due to noise. The
equivalent width values for
such modulations are in the range of 3 to 7 in the and
band spectra. In comparison, on 1 March 2001, when the lines
were the weakest, the equivalent widths for the features which are
clearly discernible viz. 1, 2 , 3-5, 6-10, 11 and 12 are
25, 39, 102, 27, 22 and 41 respectively. The noise in the
continuum has similar equivalent widths as before. In general, the
band features are a little noisy except for the 1.689 m
line.
While it appears that CI is the main contributor to the spectra, it is possible that there is some contribution from CII also. This is specially so because CII lines have been seen in the optical spectra as will be discussed shortly. We have determined some of the stronger CII lines ( based primarily on their transition probabilities) in the region from Kurucz’s line list. It will need a detailed model - beyond the scope of this work - to calculate the absolute strengths of these CII lines vis-a-vis the CI lines. But their expected wavelength positions should give some indication whether they are present in the spectra or not. The expected CII lines are found to lie at wavelengths of 1.093, 1.144, 1.158, 1.674, 1.700 and 2.222 m. There is a line at 1.09 m which is consistently seen in the observed spectra - this could be due to CII. Out of the other CII lines the 1.144, 1.158 and 1.700 m lines may be present in the observed spectra. The 1.144 and 1.158 m CII lines could be lying on the wings of the observed 1.133 and 1.165 m CI lines - giving them a slightly broader appearance. Similarly, the expected 1.700 m CII line may be blended with the 1.689 m CI line. Thus there is some evidence for the presence of CII in the spectra.
It must be mentioned that in an earlier IAU circular (Ashok & Banerjee 2001) we had attributed some of the CI lines reported here to CIII and CIV. This was because some CIII and CIV lines do occur at similar wavelengths as CI - for e.g. as seen in the spectra of Wolf-Rayet stars (Eenens et al. 1991 ). But some of these strong CIII and CIV lines are not seen here. Furthermore, since lines from low-ionization species have been definitely identified in the optical spectra of V445 Puppis, it is more consistent to attribute the observed emission lines to CI ( with some contribution from CII possibly), rather than high-ionization species like CIII or CIV.
It may be seen from the spectra that V445 Pup is
hydrogen-deficient. In the band there is no sign of the
Brackett gamma (Br) line at 2.1656 m.
Similarly other Brackett series lines (Brackett 10 to 19) which
are commonly seen in the band in the spectra of classical
novae are missing. Paschen beta (Pa) at 1.2818
m is also not present in the band spectrum. The
only possible indication for the presence of Hydrogen is the 1.09
m line which coincides with Paschen gamma
(Pa). However, Pa is expected to be weaker than
Pa which, in the present data, is completely absent.
Hence it is difficult to attribute this line to Hydrogen
Pa and it is more likely to be due to CII as
discussed earlier.
We do not find the signature of Helium lines in the spectra. However, the presence of He is more conclusively seen in the optical spectra wherein several HeI lines are prominently seen (Wagner et al. 2001c) while at the same time the hydrogen-deficiency is manifested by the weakness/absence of the Balmer Hydrogen lines. It is also important to note that many Carbon lines are also strongly seen in the optical spectra (Kamath & Anupama 2002; Wagner’s site at http://vela.as.arizona.edu/rmw /v445pup.html) at different epochs after the outburst. In fact in a sample spectrum by M. Fujii, Bisei Observatory, taken soon after the outburst, the strongest optical line that is seen is the CII 6582 line (http://www1.harenet.ne.jp/ aikow/0113pnp.gif). The Fujii spectrum also shows the presence of the HeI lines. Thus it would be fair to qualitatively say that the IR and optical evidence indicate that not only is V445 Puppis a hydrogen-deficient object but also that it is rich in Carbon and Helium.
| Line # | (m) | Species | Other | Eq. |
|---|---|---|---|---|
| (From Figs | Contri- | Width | ||
| 2 & 3) | butors | () | ||
| 1 | 1.0938 | CII | 34 | |
| 2 | 1.1330 | CI | CII | 110 |
| 3 | 1.1658, | CI | CII | 320 |
| 1.1669 | ” | |||
| 4 | 1.1748, | CI | ||
| 1.1753, | ” | |||
| 1.1755 | ” | |||
| 5 | 1.1895 | CI | ||
| 6 | 1.2112 | CI | 69 | |
| 7 | 1.2244, | CI | ||
| 1.2248 | ” | |||
| 8 | 1.2264 | CI | ||
| 9 | 1.2314 | CI | ||
| 10 | 1.2336, | CI | ||
| 1.2348 | ” | |||
| 11 | 1.2581, | CI | 65 | |
| 1.2601, | ” | |||
| 1.2614 | ” | |||
| 12 | 1.6890 | CI | CII | 53 |
| 13 | 1.7338 | CI | 15 | |
| 14 | 1.7505 | CI | 9 | |
| 15 | 1.7659 | u.i | 12 |
3.3 Distance and Reddening
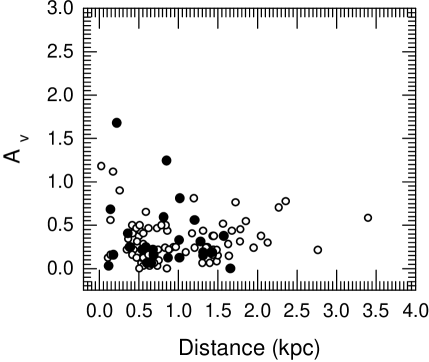
We briefly discuss the distance and reddening towards V445 Pup since these parameters enter the photometric calculations described in the coming subsection. The distance to V445 Pup is poorly known. The only estimate for the distance is by Wagner who give an upper limit of 3 kpc based on the strength of an interstellar absorption line at 5780 (http://vela.as.arizona.edu/rmw/v445pup.html). For such an adopted upper limit for , the extinction maps by Neckel et al. (1980) give a value of 0.25 in the direction of V445 Puppis. This value is derived by converting Neckel et al.’s (1980) values of using the relation V 3.1 (Koornneef 1983). As an additional confirmation for , we also used UBV photometric data for 110 stars by Wooden (1970) in an approximately 55 degree field around V445 Puppis. Since the spectral type is known, and hence the intrinsic 0 color, the excess color can be found from the observed color. v can hence be found. The distance can then be determined by the standard relation - = 5log - 5 + . The values for the intrinsic 0 colors and absolute magnitudes, for different spectral types, were taken from Lang (1991) and Allen (1976). We have plotted in Fig. 6 the versus distance relation based on the Wooden (1970) data. Since a 55 degree field is rather large and extinction can vary considerably along any line of sight in it, we have also shown in Fig. 6 the extinction for stars within a smaller, 1 degree field of V445 Puppis. Based on the results of Fig. 6 and also on the Neckel et al. (1980) data, we feel it reasonable to adopt a value of = 0.25 for V445 Puppis, unless the distance to it is much greater than 3 kpc. It may be noted, that the extinction in this direction is generally low.
3.4 Near Infrared photometry
The details and results of the photometry are given in Table 2. The magnitudes listed are the observed magnitudes. We have used Koornneef’s (1983) relations viz. V 3.1, J 0.265 V, H 0.155 V and K 0.090 V to correct for interstellar extinction. Absolute flux calibration was done by adopting zero magnitude fluxes from Koornneef (1983).
| Obs. date (UT) | |||
|---|---|---|---|
| 2.90 Jan 2001 | 6.35 0.06 | 5.20 0.03 | 4.41 0.12 |
| 1.96 Nov 2001 | 15.5 | 12.6 0.20 | - |
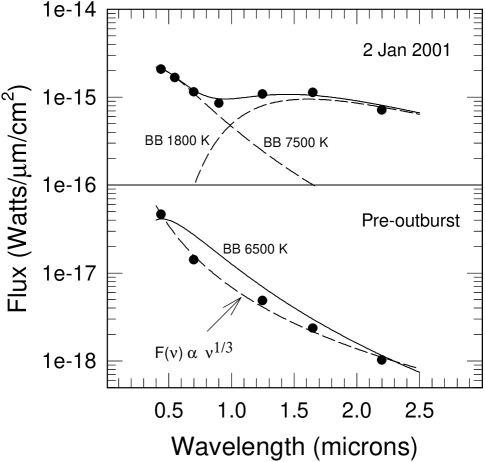
We have plotted the spectral energy distribution (SED) of V445 Puppis for
2 Jan. 01, after
correcting for = 0.25,
in the upper panel of Fig. 7. In this figure
the fluxes are from the
present work
whereas the UBVR values are taken from Gilmore (2001). It may be
noted that Gilmore’s (2001) observations are for Jan. 6.58 UT, 2001 and slightly
separated in
time from our 2 Jan. 01 observations. However, since both sets of
observations are almost quasi-simultaneous, no significant error is expected to
be introduced in the results of Fig. 7. This is especially so, since as seen
from the light curve of Fig. 1, V445 Puppis was not showing strong photometric
changes around this time.
The SED of 2 Jan. 01 could not be fit by a single
black body curve as it shows a significant IR excess. Accordingly it has been
fit
by a 7500K black body component ( corresponding to V455 Puppis proper) and a
cooler component of temperature 1800K. The cooler component arises from dust
that has formed around V445 Puppis. The presence of dust could give an
additional extinction apart from the interstellar extinction corresponding to
the adopted value of . In view of this we have calculated
various combinations of the SED that result for variations of from
0.25 to 0.5; the hot blackbody component from 6000 to 12000K
and the cool blackbody component (dust) from 1200 - 2200K. We find
that 0.25 still continues to give an optimal fit to
the data
indicating that there is no significant extinction from the dust.
We also find that almost equally good fits to the data
are found for a hot component temperature in the range
7500-8500K combined with dust temperature in the range 1750-1850K.
We believe a dust temperature of 1800K is fairly representative
of the observed data and
adopt this value for subsequent calculations for the mass of the
dust shell.
Lynch
et al. (2001) have also found evidence for the
presence of dust
from their 3-14 m band spectroscopy of 31 January 2001.
However they conclude that the dust, most likely, pre-existed before the
outburst rather
than created post-outburst. The premise for this inference is that
dust could not have formed so early after the outburst. But, as mentioned
earlier in section, Lynch et al. (2001) have placed the outburst date a month
later than what we believe to be correct. In classical novae, the time scale
for dust to form is typically 50 - 70 days after outburst (Gehrz 1988).
However there are cases like V838 Her
(Chandrasekhar et al. 1992 and references therein) when dust formed as
early as eight
days after outburst. In the case of V445 Puppis, we feel that sufficient time
after the outburst may have elapsed for dust to form and the dust that is
seen here has been created post-outburst. This view is bolstered by looking
at the pre-outburst SED of V445 Puppis shown in the lower panel of Fig. 7.
Here, the pre-outburst fluxes are given by the filled circles which are
derived from the & magnitudes ( from the USNO A2.0 database) and the
magnitudes from the 2MASS survey. As may be noted
there is no sign of a pronounced IR excess in the pre-outburst SED of
V445 Puppis. Discussion of the other plots in the lower panel of Fig. 7 is
deferred to Sect. 4.
The mass of the dust shell can be inferred from the infrared excess that is seen in the data of 2 Jan. 01. Following Woodward et al. (1993), the mass of the dust shell (in units of ⊙) is given by
| (3) |
In the above equation, is the black body temperature of the
dust in units of K, is the distance to the object in kpc and
is the flux, in Wcm-2, measured at the peak of the SED for the
dust. Eq. (3) assumes the dust is composed of Carbon particles of size
1m and having a density 2.25 gm/cm3.
The assumption that the dust is made of carbon particles may be quite
valid in the case of V445 Puppis because of the strong presence of Carbon
in the optical/IR spectra. Further, the mid - IR spectra of
Lynch et al. (2001) show a featureless continuum which is generally
attributable to dust in the form of carbon/graphite.
From the data for 2 Jan. 01 we get
for
= 1800K and Wcm-2. For a maximum
value of = 3 kpc, the upper limit of the mass of the dust shell is
found to be ⊙.
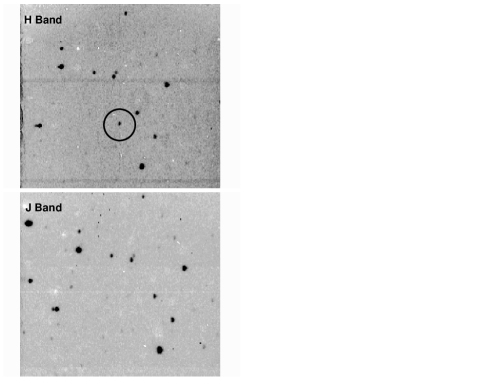
Regarding the photometric data for 1 Nov 01, an accurate estimate could not be made of the band magnitude because of inadequate S/N in the images. However the object is clearly seen in the band, and also in the band, whereas it is not visible in the band images. This can be seen from Fig. 8 showing the and band images (which have lost a little in reproduction). The position of V445 Pup is circled. Due to its absence in the band, only a lower limit could be put for the magnitude by comparing the faintest, detected star in our image with its corresponding 2MASS magnitude. The limiting magnitude of the band image of 1 Nov. 2001 is 15.5. Our images/magnitudes confirm that the object was shrouded in thick dust shell by then. A similar conclusion was drawn earlier by Henden et al. (2001) based on observations of September- October 01. Henden et al. (2001) find that the star is not detectable in the and bands down to limiting magnitudes of 20 and 19.5 respectively - in the band the reported magnitude is 9.15. The light curve of Fig. 1 also shows the steep decline in brightness, at around this time, indicating the onset of a heavy dust formation phase.
4 Discussion: The nature of V445 Puppis
The nature of V445 Puppis is rather enigmatic. Among eruptive variables that
show similar outbursts, one may first consider the novae. V445 Puppis
differs from a classical
novae in the amplitude of it’s outburst and also the deficiency of Hydrogen
in its
spectrum. The strong presence of a large number of Carbon lines in the IR
spectra is again unusual for a nova. Further, novae are known to evolve with
time towards higher
temperatures which characterize the nebular and coronal phases. Such
behavior is not seen here. It also does not appear to be a recurrent nova
because
no earlier outbursts have been recorded or reported for
V445 Puppis. In a
symbiotic nova, one expects to see
high-excitation emission lines in the spectrum during the decline
phase - a feature which
is absent here (Kenyon 1986). Also, the light curves of symbiotic novae
decline
much slower than what is observed in V445 Puppis. Most importantly,
hydrogen-deficiency is not expected in recurrent or symbiotic novae.
Another possibility is that V445 Puppis is a
born-again AGB star. The nuclei of intermediate mass stars, evolving from
the AGB stage into planetary nebulae can experience a final
Helium shell flash which lifts them into a high luminosity range again
(Iben et al. 1983). There
are only 3 known examples of born-again AGB’s
in the Galaxy viz. V605 Aql, FG Sge and
Sakurai’s object. However there are a few arguments against V445 Puppis
being a born-again AGB. First, no nebulosity (caused by gas ionized by
the hot nuclei) has been seen around the object as has been found in the
other known cases. We have checked one of the H surveys covering
this region (Schwartz 1990) but the object is not listed as showing
signs of emission. Again, born-again AGB’s - unlike
V445 Puppis- brighten very gradually to their peak brightness - a process
which can even take decades. For the actual timescales observed,
the reader may refer to Duerbeck et al. (2000) for Sakurai’s object,
Harrison (1996) for V605 Aql and Fig. 1 of Blocker & Schonberner (1997)
for FG Sge.
There is a class of eruptive variables whose spectrum after the outburst
evolves into that of a cool M-type giant or supergiant. This spectral
evolution
takes place rather rapidly - within a time of 1 to 2 months.
The first such object
in this class is a luminous, red variable star
(M31 RV) that erupted in M31 (Rich
et al. 1989; Mould et al. 1990). Subsequently the eruptive variable V4332 Sgr
(Martini et al. 1999) and most recently V838 Mon, (Banerjee & Ashok 2002a;
Munari et al. 2002) have been added to this
class. A consensus has not been reached on placing these objects in the same
category but what is certain is that after a nova-like outburst they quickly
evolve to a very cool M type (or even later type) absorption spectrum.
V838 Mon has, in fact, evolved at present to be similar to that of a
T type brown dwarf
( Banerjee & Ashok 2002b, Geballe et al. 2002). In the case of V445 Puppis,
there is VSNET photometric data in the bands for
more than 5 months after it’s outburst. We have checked these colors
and do not find an evolutionary trend towards M type
giant/supergiant stage. For e.g. on 2001, March 30.48 ( more than 4 months
after the outburst) the observed magnitudes are
= 10.66 and = 10.13. For an adopted value of E(B-V) = 0.25,
this results into an intrinsic (B-V) color of 0.29 which is very different
from 1.6 which is the expected value for a cool M giant/supergiant
star. Thus V445 Puppis
does not appear to show an evolutionary trend
similar to the V838 Mon class of objects.
V445 Puppis also does not appear to be an RCB or Hydrogen deficient Carbon
star (HdC) . RCB stars show episodic dimming due to ejection of dusty
carbon shells, subsequently followed by a rebrightening. But their spectra
are typically F type absorption spectra and
most of them are detected in IRAS and show an IR excess. V445 Puppis was
not detected previously by IRAS. Furthermore, no other outbursts
have been recorded for V445 Puppis. HdC stars share most of the
properties of RCB stars except that they do not show large
brightness
variations. Both groups of objects have absolute magnitudes
in the range -3 to -5 (Brunner et al. 1998). Unless the extinction
and distance
to V445 Puppis are grossly underestimated, 0 for
V445 Puppis. This is inferred from
- = 5log - 5 +
using adopted values of 1,
an upper limit for = 3 kpc and the pre-outburst magnitude value of
= 13.6. The object appears under luminous for an RCB star.
The possibility that V445 Puppis is not a single star - but part of a binary
system with an accretion disk - has some supporting evidence. First,
the SED of the star in the pre-outburst stage (Fig. 7, lower panel)
is difficult to fit
with a black body spectrum. We have tried several black body fits
at different temperatures to the observed SED. While fitting, the observed
SED has itself been modified by choosing different values in case the
adopted value of = 0.25 is grossly incorrect. However a good fit
is not
found and the closest fit to the data ( = 6500K, = 0.25)
is
not satisfactory as can be seen from Fig. 7 (lower panel). It is
possible that
the observed continuum distribution from V445 Puppis is dominated by radiation
from an accretion disk surrounding the object. In the case of a steady-state
accretion disk around a white-dwarf, the continuum
radiation from the disk can be described by an
relation
( Mayo et al. 1980 and other references therein).
A dependence
falls off less steeply than the
relation expected for a black body in the Rayleigh-Jeans regime. We find
that such an
accretion disk spectrum fits the data of Fig. 7 much better than a black body
fit.
The radio data from Rupen et al. (2001a, b and their website
http://www.aoc.nrao.edu/ mrupen/XRT/V445Pup ) also
suggest the possibility of an accretion process in a binary system.
They state that the
observed synchrotron emission probably originates
either
in accretion onto a compact companion or in an asymmetric, clumpy shock at
the boundary between ejecta from a fresh outburst in September 2001 and
previous ejecta (the fresh outburst would be obscured by the thick dust
shell which had formed around this time). But they argue that the rapid
evolution of both the radio emission and the radio absorption - significant
flaring is seen in the object - favors the presence of an accretion process.
However, it must be pointed out, there is a lacuna in comparing the
observed radio emission with radiation from an accretion disk with
a spectra as discussed above. The latter does not constitute a
non-thermal source like the observed radio emission. But the present
radio detection was made well after the outburst. It may just be possible
that the physical conditions/mechanisms of the accretion process are different
in the pre- and post-outburst stages leading to a qualitative difference in
the radiation emitted. We are unable to judge on this aspect. The primary
aim of the present work was to look for any evidence - albeit even
suggestive -
which would show whether V445 Puppis belongs to a binary system or not. Given
the strangeness of the object, this would help understand it’s nature. We feel
the recent radio data and the pre-outburst SED seem to indicate a
binary nature for V445 Puppis.
From the arguments given above, we find that it is difficult to place V445 Puppis into known categories of eruptive variables. Kato et al. (1989) and Iben & Tutukov (1994), among other workers, have investigated the case of Helium novae. Kato et al. (1989) consider the case of a degenerate white dwarf accreting Helium from its Helium rich companion. For appropriate mass accretion rates, an accretion-induced collapse of the white dwarf into a neutron star need not occur. Instead a thermo-nuclear reaction can occur on the surface of the white dwarf leading to a Helium nova outburst. The ejecta of such an outburst, in the Kato et al. (1989) model, should presumably be rich in Helium and Carbon and highly hydrogen-deficient. This is based on the assumed, pre-ignition, chemical composition of the envelope by mass viz = 0, = 0.97 and = 0.03. Further, Carbon in the ejecta is expected to be additionally enhanced because the thermonuclear outburst process itself converts Helium to Carbon. Such a scenario, or some close variant of it, may apply to V445 Puppis and explain the hydrogen-deficiency ( and He/C enrichment) of it optical and IR spectra. The tentative evidence for binarity and accretion disk in V445 Puppis is also in conformity with the requirements of a helium nova scenario. However, the predicted luminosity of the outburst in a Helium nova is ⊙ (Kato et al. 1989) and X-rays are also predicted in the post-outburst stage (Iben & Tutukov 1994). In the case of V445 Puppis, there are no reports on X-ray detection from the object, though it is uncertain whether any attempt has been made in this direction. Further the thick dust shell may attenuate any soft X-ray emission that takes place. The outburst luminosity, if approximated from the SED of 2 Jan. 01 (Fig. 7), is found to be closer to ⊙ i.e. slightly less than the theoretical estimate. In view of this, it may be slightly speculative to identify V445 Puppis as a Helium nova, but similarities exist. Given the interesting and rather unique properties of the object, it is hoped that this work will prompt a rigorous, theoretical study to explain the nature of V445 Puppis.
Acknowledgements.
The research work at Physical Research Laboratory is funded by the Department of Space, Government of India. We thank A.Tej for help in obtaining observations. We thank R.M. Wagner, the referee, for useful and constructive comments that have helped improve the paper. This work has made use of data available from 2MASS data center and also from data/information available at the following websites viz. http://kurucz.harvard.edu/linelists.html; http://vela.as.arizona.edu/rmw/v445pup.html; http://www.kusastro.kyoto-u.ac.jp.vsnet, http://www.aoc.nrao.edu/mrupen/XRT/V445Pup and http://www1.harenet.ne.jp/ aikow/0113pnp.gifReferences
- (1) Allen C.W. 1976, Astrophysical Quantities (Athlone Press, London and Dover)
- (2) Aller L.H. 1963, The Atmospheres of the Sun and Stars (Ronald Press, New York)
- (3) Ashok N.M., & Banerjee D.P.K. 2001, IAU Circ. 7559
- (4) Banerjee D.P.K., & Ashok N.M. 2002a, A&A 395, 161
- (5) Banerjee D.P.K., & Ashok N.M. 2002b, IAU Circ. 8036
- (6) Blocker T., & Schonberner D. 1997, A&A 324, 991
- (7) Brunner A.R., Clayton G.C. & Ayres T.R. 1998, PASP 110, 1412
- (8) Chandrasekhar T., Ashok N.M., & Ragland S. 1992, MNRAS 255, 412
- (9) Duerbeck H.W., Liller W., Sterken C. et al. 2000, AJ 119, 2360
- (10) Eenens P.R.J., Williams P.M., & Wade R. 1991, MNRAS 252, 300
- (11) Fujii M. 2001, IAU Circ. 7556
- (12) Geballe T.R., Smalley B., Evans A., & Rushton M.T. 2002, IAU Circ. 8016
- (13) Gehrz R.D. 1988, ARAA 26, 377
- (14) Gilmore A.C. 2001, IAU Circ. 7559
- (15) Harrison T.E. 1996, PASP 108, 1112
- (16) Henden A.A., Wagner R.M., & Starrfield S.G. 2001, IAU Circ. 7730
- (17) Hunt L.K., Manucci F., Testi L., et al. 1998, AJ 115, 2594
- (18) Iben I. Jr, Kaler J.B., Truran J.W. & Renzini A. 1983, ApJ 264, 605
- (19) Iben I. Jr, & Tutukov A.V. 1994, ApJ 431, 264
- (20) Johansson L. & Litzen U. 1965, Ark. for Fysik Band 29, 13, 165
- (21) Johansson L. 1966, Ark. for Fysik Band 31, 15, 201
- (22) Kamath U.S, & Anupama G.S. 1992, BASI 30, 679
- (23) Kenyon S.J. 1976, The Symbiotic Stars (Cambridge Univ. Press, Cambridge, U.K)
- (24) Koornneef, J. 1983, A&A 128, 84
- (25) Kato M., Saio H., & Hachisu I. 1989, ApJ 340, 509
- (26) Kato T., & Kanatsu K. 2002, IAU Circ. 7552
- (27) Lang K.R. 1991, Astrophysical data: Planets and Stars (Springer-Verlag, New York)
- (28) Liller W. 2001a, IAU Circ. 7556
- (29) Liller W. 2001b, IAU Circ. 7561
- (30) Lynch D.K., Russel R.W., & Sitko M.L. 2001, AJ 122, 3313
- (31) Martini P., Wagner R., Tomaney A. et al. 1999, AJ 118, 1034
- (32) Mayo S.K., Wickramasinghe D.T., & Whelan J.A.J 1980, MNRAS 193 793
- (33) Mould J., Cohen J., Graham J.R. et al. 1990, ApJ 353, L35
- (34) Munari U., Henden A., Kiyota S. et al. 2002a, A&A 389L, 51
- (35) Neckel Th., Klare G., & Sarcander M. 1980, A&AS 42, 251
- (36) Platais I., Kozhurina-Platais V., & Zacharias M.I. et al. 2002, IAU Circ. 7556
- (37) Rich R.M., Mould J., Picard A., Frogel J.A., & Davies R. 1989, ApJ 341, L51
- (38) Rupen M.P., Dhawan V., & Mioduszewski A. 2001a, IAU Circ. 7717
- (39) Rupen M.P., Dhawan V., & Mioduszewski A. 2001b, IAU Circ. 7728
- (40) Schwartz R.D., Persson S.E., & Hamann F.W. 1990, AJ 100, 793
- (41) Seaquist E.R. 1989, in Classical Novae, ed. M.F. Bode & A. Evans (John Wiley, Oxford)
- (42) Shemmer O., Leibowitz E., & Dan J. 2001, IAU Circ. 7556
- (43) Wagner R.M., Foltz C.B., & Starrfield S.G. 2001a, IAU Circ. 7556
- (44) Wagner R.M., Schwarz G., & Starrfield S.G. 2001b, IAU Circ. 7571
- (45) Wagner R.M., Schwarz G., & Starrfield S.G. 2001c, IAU Circ. 7717
- (46) Williams R.E. 1994, ApJ 426, 279
- (47) Wooden W.H.II 1970, AJ 75, 324
- (48) Woodward C.E, Lawrence G.F., Gehrz R.D et al. 1993, ApJ 408, L37