M31’s Undisturbed Thin Disk of Globular Clusters
Abstract
We show that there is a subsystem of the M31 globular clusters with thin disk kinematics. These clusters span the entire metallicity range of the M31 globular cluster system, in contrast to the (thick) disk globulars in the Milky Way which are predominantly metal-rich. Disk globular clusters are found across the entire disk of M31 and form 40% of the clusters projected on its disk. The existence of such a disk system suggests that there was a relatively large thin disk in place very early in M31’s history. Accurate measures of the ages of these clusters will constrain the epoch of disk formation in M31. There is currently no strong evidence for differences in age between Milky Way and M31 globulars. While age differences are subtle for old populations, it is unlikely that disk clusters with [Fe/H] around –2.0 were formed after significant star formation began in the galaxy, as the proto-cluster gas would be enriched by supernova ejecta. Thus it is likely that M31 had a rather large disk in place at early epochs.
The very existence of such a cold disk means that M31 has suffered no mergers with an object of 10% or more of the disk mass since the clusters were formed. This makes Brown et al (2003)’s suggestion that M31 could have suffered an equal-mass merger 6-8 Gyr ago less viable.
1 Introduction
When did present-day galaxy disks start to form? Despite much progress in the study of high-redshift galaxies, with almost 1000 galaxies now known with , (Shapley et al., 2003), our observational constraints on the formation of disk galaxies are much poorer. There are few confirmed disk galaxies with redshifts much greater than 1 (a lookback time of approximately 8 Gyr). The lack of known high-redshift disk galaxies is due to two reasons. First, the lower star formation rate typical of disks leads to a low surface brightness compared to starbursting galaxies such as the Lyman Break galaxies (Steidel et al., 1996; Adelberger et al., 2003). This, combined with the cosmological surface brightness dimming, makes them challenging observational targets. Second, we need resolved kinematics to confirm the rotational signature of a disk and linewidths to measure its luminosity via Tully-Fisher. Even studies with the Keck telescope have not succeeded in pushing much beyond z=1, although deep IR imaging and spectroscopy are now identifying a few more (van Dokkum & Stanford, 2001; Labbe et al., 2003; Erb et al., 2003). Although damped Ly-alpha absorbers in QSO spectra were originally thought to be young disk galaxies, evidence is now building that many of these gas-rich objects are in fact dwarfs (Rao et al., 2003). Measurements of the age of disk stars in the Milky Way (see below) show significant numbers with ages of 10 Gyr or more, suggesting that the epoch of disk formation has not yet been seen at high redshift.
Thus constraints on the epoch and process of disk formation from more local stellar populations are important. In the Milky Way, the most accurate measurement of ages comes from white dwarf cooling and isochrone fits to star clusters. While most estimates of the age of the local galactic disk from white dwarfs are close to 10 Gyr (Leggett, Ruiz, & Bergeron, 1998; Knox, Hawkins, & Hambly, 1999), uncertainties due to theoretical models may be as much as 3 Gyr (Prada Moroni & Straniero, 2002). The “gold standard” of age determinations is provided by star clusters. The oldest clusters in the Milky Way (and so the ones that are likely to give interesting constraints on its formation) are its globular clusters.
In the Milky Way, the dominant stellar populations are the disk, bulge/bar, and halo. The majority of globular clusters belong to the metal-poor, pressure-supported halo. There are no Milky Way globular clusters known to be associated with its thin disk: the only thin disk clusters are the open clusters, which are typically several orders of magnitude less luminous than the globular clusters and usually much younger (Friel, 1995).
Early work on the Milky Way globulars (Baade, 1958; Kinman, 1959) found that there was a strong correlation between kinematics and metallicity, with the more numerous metal-poor clusters associated with the halo. The population membership of the metal-rich clusters is much less clear. They have been associated variously with the bulge (Frenk & White, 1982; Minniti, 1995; Côté, 1999), the thick disk (Zinn, 1985; Armandroff, 1989) and the bar (Côté, 1999; Dinescu et al., 2003). Bar and thick disk clusters probably formed originally in a thin disk and were then heated into bar or thick disk via various dynamical processes (eg Quinn & Goodman, 1986; Jenkins & Binney, 1990). Bulge clusters were likely formed separately from the disk. The correct population for the old, metal-rich clusters remains contentious in many cases because their distance uncertainties propagate to large errors in kinematical parameters.
What can we learn about disk formation and evolution from the old stellar populations of the nearest large spiral, M31? Early spectroscopic studies of its globular clusters (Huchra, Brodie, & Kent, 1991) found that they had similar kinematic and chemical properties to the Milky Way system: the metal-richer clusters showing some degree of rotational support and metal-poor clusters showing little rotation and high velocity dispersion. However, as the quality and quantity of data available on M31 has increased, it has become increasingly clear that its old stellar populations are not simply “like the Milky Way’s, only more so” (Huchra, 1993). While the Milky Way’s halo dominates more than a few kpc from its disk, leading the practice of calling similar positions in M31 “halo” regions, M31’s bulge is much more luminous and extended than the Milky Way’s, with an profile which extends smoothly from 200 pc to 20 kpc on the minor axis (Pritchet & van den Bergh, 1994). Color-magnitude diagrams of fields tens of kpc from the major axis have found that stars have higher metallicities and a larger range in ages than seen in the Milky Way halo (Mould & Kristian, 1986; Durrell, Harris, & Pritchet, 1994; Rich et al., 1996; Durrell, Harris, & Pritchet, 2001; Brown et al., 2003). Mould & Kristian (1986) and Freeman (1990) suggested that the M31 bulge might be the dominant component even in regions far from the disk.
Kinematical measurements add important information about formation processes. Examples are the cold, rotationally supported disks which form by slow dissipative collapse, the moderately rotating bulges and thick disks whose formation processes combine some memory of rotation with some heating processes, and the non-rotating kinematics of the Milky Way’s halo which likely formed via accretion of very small satellites into the galaxy potential. Do the kinematics of old populations in M31 bear out the suggestion that its bulge dominates the non-disk regions even at distances of tens of kpc from its center? Absorption-line spectroscopy of the bright inner regions of M31’s bulge has shown that it has moderate rotational support (McElroy, 1983; Kormendy, 1988). Away from these bright regions, planetary nebulae (PNe) and globular clusters are the tracers of choice. Hurley-Keller et al. (2003), in their study of the kinematics of PNe out to distances of 20 kpc from M31’s center, found that almost all their PNe had significant rotational support, with only a few showing the pressure-supported kinematics typical of the halo. This adds more weight to the hypothesis that the bulge dominates far from the plane.
Globular clusters generally trace an older age range than PNe, which are produced by populations more than 1 Gyr old. Perrett et al. (2002) showed that the relatively small sample size and large velocity errors on the original velocities of M31 globulars obtained by Huchra, Brodie, & Kent (1991) led to the misconception that many M31 globulars belonged to a pressure-supported halo like the Milky Way’s. Perrett et al. (2002) used their higher-precision data (which had velocity measurement errors of only 12 km/s) to show that the rotational support of the whole system had been under-estimated. The entire M31 globular cluster system has , with only a slight correlation between kinematics and metallicity. These kinematics, with their moderate rotational support, are closer to the bulge than to a non-rotating halo. Thus, while M31 does possess some stars in a Milky-Way-like halo, this halo does not dominate the regions away from the disk. The moderately-rotating, bulge is the major kinematical component in both PNe (which represent stars with ages greater than 1 Gyr) and the globular clusters, which represent an even older population.
What of M31’s disk? Is it, too, fundamentally different from the Milky Way’s? We will show below that M31’s thin disk contains a system of (presumably ancient) globular clusters. An even more profound difference would be provided by the suggestion of Brown et al. (2003) that there was a merger between M31 and an equal-mass companion as recently as 6–8 Gyr ago, which is one of their suggestions to explain the young stars they detect far out on the minor axis in their very deep HST ACS images. A merger with such a massive companion would have destroyed M31’s existing disk (eg Barnes & Hernquist, 1992). The disk we see today would have formed after the merger. Since any globular clusters in a thin disk would be heated into a spheroid by an equal-mass merger, our result leads to further constraints on M31’s merger history.
In Section 2 we will describe our observational evidence for the system of thin disk clusters and the kinematic models we use to interpret their motions projected onto the line of sight. Section 3 discusses the properties of the thin disk cluster population and shows that they are found across the entire disk of M31 and their metallicity distribution is quite similar to the overall cluster distribution. Section 4 compares M31’s globular cluster system to the Milky Way’s and other disk galaxies, and concludes with a short discussion of the implications of our result for disk formation and evolution theories.
2 Observations
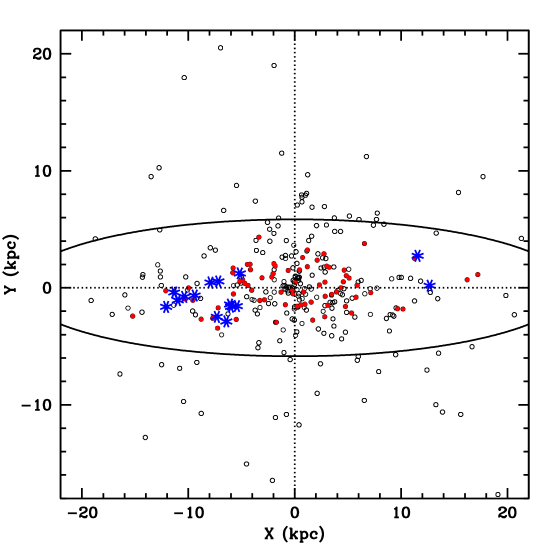
We use the “best current sample” of Perrett et al. (2002). This sample is a compilation of 321 velocities and 301 metallicities for M31 globular clusters. 225 (65%) of the velocities have errors less than or equal to 12 km/s, making this dataset particularly well-suited for kinematical investigations. Because Perrett et al. (2002) were prevented from observing fields far from the major axis by poor weather, the majority of the “best current sample” lies within a projected distance of 5 kpc of the major axis, as can be seen in Figure 1. Since the edge of M31’s disk projects to a minor axis distance of 5 kpc, this means that these clusters with high-quality velocities are in the best region to detect any disk globular cluster system.
Perrett et al. (2002) showed that the majority of the globular cluster sample had significant rotational support. Two of M31’s known stellar populations (disk and bulge) have significant rotation: we will first compare the kinematics of the globular clusters with these populations. We also explore the possibility that the M31 globular clusters have thick disk kinematics. The existence of a kinematic thick disk in M31 is currently unclear, largely due to the lack of suitable kinematic data at low surface-brightness levels. We consider models with thick disk kinematics for two reasons. First, van der Kruit & Searle (1981a, b) found, in their study of edge-on disk galaxies, that galaxies with large bulges had thick disks, so we might expect M31 to have a thick disk if this is a general trend. Also, some globular clusters in the Milky Way have thick disk kinematics, so it is worth checking whether the M31 clusters do so too.
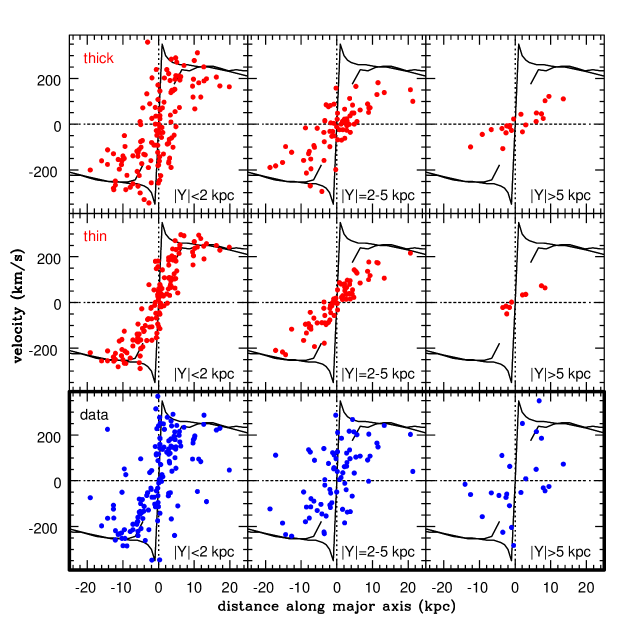
Plotting the velocity versus the distance along the major axis (X) for strips of different distance from the major axis (Y) provides a sensitive diagnostic of disk kinematics (Hurley-Keller et al., 2003). This is because, for a population dominated by rotation, we view objects near the major axis at the “tangent point” where their rotational velocity is projected directly onto the line of sight. The velocities of objects in strips offset in Y show a tilted line in the X vs. velocity diagram. This is due to the decreasing amount of rotational velocity which lies along the line of sight as we move closer to the minor axis. Once one reaches the inner, solid-body region of the rotation curve, this too produces a tilted line in the X vs. velocity diagram.
We show the kinematics of the M31 clusters in the lower panels of Figure 2 for different ranges of Y. The rotation curves of Kent (1989); Braun (1991) are also shown. It is clear that there is a difference in the kinematics of the clusters close to, and further away from, the major axis. A distinct line with little velocity dispersion can be seen in the velocity vs. X plot for kpc: the signature of a kinematically cold, rapidly rotating disk.
This is particularly noticeable in the lower left panel of Figure 2 in two regions: the concentration of clusters close to the circular velocity around X=–10 kpc, and the line stretching from X=–8 kpc, velocity = –225 km/s, to X=–4 kpc, velocity = –100 km/s. This turnover is not what we would expect if the disk rotation curve remains flat until R = 4 kpc or less, as Braun (1991) claims.
2.1 Kinematical Models of Disk and Bulge
We have made representative kinematical models for both thin and thick disks and M31’s bulge and projected them onto the line of sight. These models show how kinematics change as the population’s mean rotational velocity decreases and its velocity dispersion increases. We first discuss a model for a completely cold disk with no velocity dispersion, and then extend it to a more realistic model.
2.1.1 Cold disk model
Our cold disk model has zero thickness. In this case, the observed positions on the sky (X and Y) of the clusters uniquely determine their position in the disk. Because the cold disk has zero velocity dispersion, the rotation curve uniquely determines the expected velocity for that position. There is a surprisingly little agreement in the literature on the form of M31’s rotation curve, and we discuss the different estimates in Section 2.3.1 below, and use the kinematics of the disk globular clusters themselves to further constrain its properties. In our cold disk model we use a simple parameterization which is flat for kpc and then falls linearly to zero at X=0.
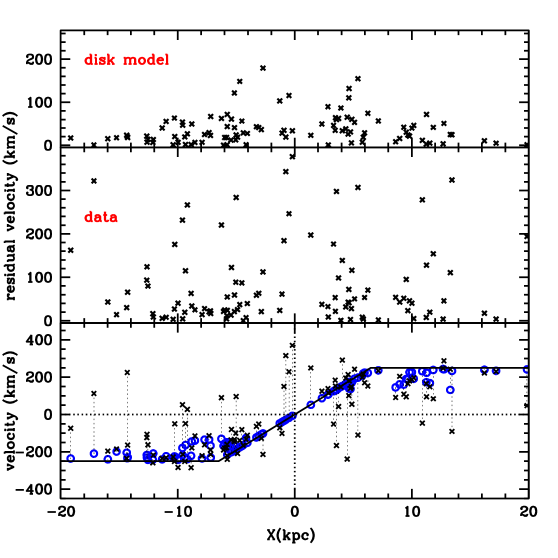
We show in Figure 3 the velocities for the cold disk for each cluster position in the sample, compared to the actual velocity of the cluster. Outside the solid-body region, at a given X value larger Y means that less of the circular velocity is projected on the line of sight, so the cold disk model velocity is smaller. It can be seen that some clusters have velocities very close to the values expected from a cold disk, while others are hundreds of km/s away. Clusters with velocity within 30 km/s of the expected cold disk velocity are shown with solid circles.

2.1.2 Realistic disk models
In fact, real disks have non-zero thickness and velocity dispersion. For each disk model we specify a spatial distribution, a mean rotational velocity and a velocity ellipsoid. Details are given in Table 1. The luminosity density of thin and thick disk models drops exponentially with (cylindrical) R and with height above the plane z. We have chosen the maximum radius of the thin disk using the surface photometry of Walterbos & Kennicutt (1988) and, somewhat arbitrarily, made the thick disk extend to larger radius.
| Model | (kpc) | (kpc) | (kpc) | (kpc) | (km/s) |
|---|---|---|---|---|---|
| Thin Disk | 5.3 | 0.3 | 26 | 250 | |
| Thick Disk | 5.3 | 1.0 | 40 | 210 | |
| Bulge | 2.4 | 110 |
We know the position on the plane of the sky (X,Y) of each cluster, but do not know its distance along the line of sight. We make a single realization of the model by drawing this line of sight distance at random from a probability distribution determined by the luminosity distribution of the component at this X,Y position. Thus for the thin disk model, most clusters will be assigned line of sight distances within a few hundred kpc of the disk plane, while the thick disk model will produce positions which cover a larger range of distances from the plane.
Once we have simulated a 3-dimensional position in M31 for the cluster, we assign it a velocity using the corresponding kinematical model for that population. Ideally, we would be guided by absorption-line studies of the stellar populations in M31 in making the best kinematical models. However, obtaining good absorption-line kinematics for stellar populations in M31 is difficult because the galaxy covers such a large region of the sky that good sky-subtraction is very hard. This is illustrated by the large variation of velocity values in different but symmetrical slit positions of McElroy (1983). So we use a combination of M31 data, kinematics from similar external galaxies and kinematics from the Milky Way. We do not intend these models to be definitive, but merely to illustrate the different kinematical signatures of each population.
The kinematics for the thin and thick disk models are based on the extensive study of the kinematics of disk galaxies of Bottema (1993) and the M31 disk rotation curve (Kent, 1989; Braun, 1991). The run of velocity dispersion with radius in the disk is given by
with
The exponential decrease of the velocity dispersion with is needed to give the constant disk scale height with radius that is observed in many disk galaxies (van der Kruit & Searle, 1981a; Morrison, Boroson, & Harding, 1994).
The disk circular velocity is fixed to 250 km/s (Kent, 1989; Braun, 1991) for kpc, falling linearly to 0 at the disk center. The disk velocity ellipsoid is given by the simple relation (the epicycle approximation, see Binney and Tremaine, 1987).
Less is known about the kinematics of thick disks because of their low surface brightness, so we use the solar neighborhood values of the Milky Way thick disk kinematics as a guide: a decrease of 40 km/s to the rotational velocity (Carney, Latham, & Laird, 1989) and a velocity dispersion a factor of 2 higher, with the same variation with cylindrical radius R as the thin disk.
Once we have simulated the kinematics of each cluster using these distributions, we project the velocity vector on the line of sight to produce one realization of what we would observe from an object belonging to each of the three populations at that X and Y.
2.1.3 Bulge model
The bulge luminosity distribution has an profile with major axis effective radius =2.4 kpc and b/a=0.55 (Walterbos & Kennicutt, 1988; Pritchet & van den Bergh, 1994). Note that Pritchet & van den Bergh (1994) show that M31’s minor axis luminosity profile follows this law for a remarkably large distance: from R=200 pc to 20 kpc. This suggests the possibility that M31’s bulge may dominate for tens of kpc away from the major axis (Mould & Kristian, 1986; Freeman, 1990), and so a significant number of globular clusters might be associated with the bulge.
We considered the observations of bulge kinematics of McElroy (1983); Kormendy (1988), and originally constructed a simple isotropic oblate rotator model with mean rotation =80 km/s, decreasing in concert with the rotation curve inside =6.5 kpc, and velocity dispersion falling linearly with radius from 150 km/s at the center to 100 km/s beyond a radius of 2 kpc. However, both the globular cluster kinematics far from the plane and the kinematics of planetary nebulae in M31 (Hurley-Keller et al., 2003) show more rotational support than this. Also, the kinematics of low-luminosity elliptical galaxies formed by unequal-mass mergers show an increase of rotational velocity with increasing radius (Cretton et al., 2001). Thus we have increased the mean rotational velocity to =110 km/s.
2.2 Cluster Kinematics
2.2.1 Clusters close to the major axis
Figure 2 compares the kinematics of the cluster sample to realizations of the thin (middle panel) and thick (upper panel) disk. It can be seen that the kinematics of many of the clusters with kpc more closely resemble the thin disk model, although there is also a contribution from a hotter population with less rotation. In particular, note the concentration of clusters in a tight line stretching from X=–10 kpc, velocity = –250 km/s, to kpc, velocity = 250 km/s. While the thick disk model does show some clumping of objects in the X vs. velocity diagram, it is not as organized as the actual cluster data. Also, there are significantly more objects in both forbidden quadrants for the thick disk model, because its larger velocity dispersion allows them to appear there.
In fact, the linear feature in the X–velocity diagram for the clusters with kpc looks cooler than our thin disk model, showing a tighter relation between X and velocity. We will return to this below in Section 2.3.2.
The model predictions for kpc show the characteristic gently sloping line in the X vs. velocity plot which is caused by the fact that objects close to the minor axis have most of their rotational velocity projected away from the line of sight. While there is some resemblance between the thick disk model and the globular clusters for intermediate values of (2 to 5 kpc), it is clear that the objects with kpc are not drawn from a disk population.
2.2.2 Clusters outside the disk
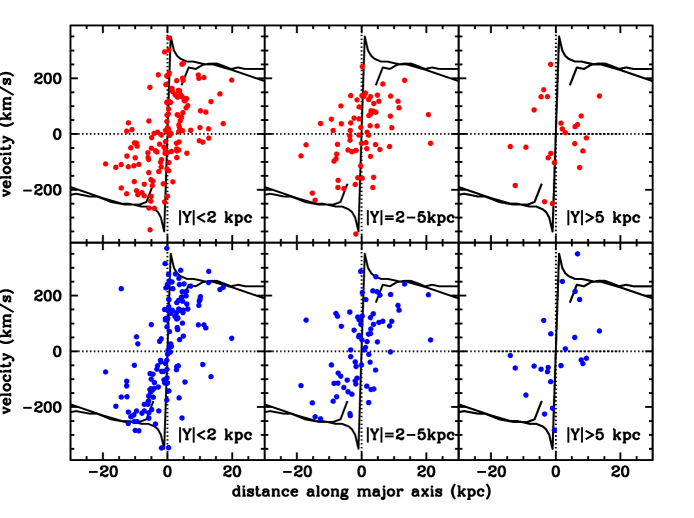
Almost all clusters with kpc are outside the region occupied by M31’s disk, so these clusters are similar to the “halo” clusters studied by previous workers. However, Hurley-Keller et al. (2003) have shown that the PNe in this region have moderate rotational support, which is more similar to the kinematics of M31’s bulge than to a non-rotating, pressure-supported halo. It is also clear that the cluster kinematics, even this far from the major axis, also show significant rotational support. Thus the bulge is the most likely population for them to belong to. Figure 4 compares the kinematics of the globular clusters with one realization of the bulge model described above. It is interesting to note that even a rotational velocity of 115 km/s does not lead to a large difference in the number of objects in the rotating and forbidden quadrants of the X-velocity plot: the large velocity dispersion of the bulge dominates its kinematics here. The intermediate-Y panels ( kpc) show as much resemblance to the thick disk model as to the bulge one; but it is clear that there is a reasonable match between the kinematics of the clusters and the bulge model.
For simplicity, we conclude that the kinematics of the M31 globulars can be explained using two kinematical components: a thin, rapidly rotating disk with a low velocity dispersion, and a higher velocity dispersion component whose properties resemble that of M31’s bulge. Within 2 kpc projected distance from the major axis, roughly half of the globular clusters belong to the thin disk component.
We note here the significant difference between the M31 and Milky Way globular cluster kinematics. The Milky Way clusters divide into a predominantly disk subsystem with kinematics and spatial distribution like a thick disk and a halo subsystem with high velocity dispersion and little or no mean rotation. By contrast, the M31 clusters divide into a group with thin disk kinematics and another with high velocity dispersion but significant rotational support, whose kinematics resemble M31’s large bulge. While there may be a few clusters which have kinematics typical of a non-rotating halo like the Milky Way’s, they do not dominate the sample. While this sample is restricted primarily to objects within 5 kpc of the major axis, we note that Hurley-Keller et al. (2003) also find significant rotational support in the kinematics of planetary nebulae up to 20 kpc from M31’s major axis.
Before we discuss the cluster kinematics further, we will investigate the appearance of asymmetry in Figure 2. The left hand side (negative X) shows a clearer rotation signature than the right hand side. In the Appendix, we use the HST data compiled by Barmby & Huchra (2001) to quantify the incompleteness of the M31 globular cluster samples. We find that the sample of clusters with good velocity and reddening measurements becomes incomplete just fainter than the peak of the luminosity function, and that it is more incomplete for positive than for negative X. The disk clusters are more likely to be found within M31’s dust lane, and so the positive X side will have a higher proportion of bulge clusters.
2.3 Kinematical Parameters for Thin Disk Subsystem
While we concentrate here on the kinematics of the thin disk system, we need to make sure that the bulge clusters found in the same region of the galaxy do not bias our answers. We do this by using the clusters whose projected velocities contain the largest fraction of , the velocity component which varies the most between the two systems. We have calculated the fraction of and which are projected onto the line of sight under the assumption that the cluster in question is located exactly in the plane of M31’s disk. This will be quite a good assumption for the thin disk clusters, and less so for the bulge ones. always projects 22% onto the line of sight, while the and components vary considerably depending on the X,Y positions of the cluster. If a cluster is close to the major axis and more than a few kpc from the center it has a large proportion of projected onto the line of sight.
While there is a difference in velocity dispersion between disk and bulge for both and , the component has the advantage of a difference in mean velocity as well (beyond 6.5 kpc, the thin disk has a mean velocity of 250 km/s while the bulge has a mean velocity of around 100 km/s (McElroy, 1983; Hurley-Keller et al., 2003). Thus we have chosen to use clusters which have 50% or more of their velocity projected into the line of sight when we derive kinematic parameters.
2.3.1 Disk rotation curve
Both the velocity dispersion and the deviation from the circular velocity give us information about the amount of heating that the clusters have experienced. In the extreme case of a thick disk, the heating is caused by an event such as a minor merger, but even an isolated but realistic disk will show an increase in velocity dispersion with time caused by gravitational interactions with giant molecular clouds and spiral arms (Spitzer & Schwarzschild, 1951, 1953; Jenkins & Binney, 1990). First we consider deviations from the circular velocity. Despite M31’s closeness to the Milky Way, its rotation curve is surprisingly poorly understood. The two published estimates of the rotation curve from HI data are
- •
- •
The two rotation curves are shown in Figure 2. There are surprising differences between the two curves, which are derived at least partially from the same data. This may be due to the particular problems of determining a rotation curve from a highly inclined, warped system like M31. In the case of HI data, the inner disk velocity field has HI components from the warped, flared outer disk superimposed. It is not always clear which components are located in the inner disk.
The two curves agree for values of R between 10 and 20 kpc. Braun’s curve shows a fall of 50 km/s beyond 20 kpc, while Kent’s remains flat. But it is the differences in the inner galaxy which are of particular interest here. Braun’s curve rises slowly from R = 10 to 3 kpc, and then shows a sharp peak with amplitude 375 km/s. Kent’s curve only extends to R4 kpc, but shows a gradual fall inward of 10 kpc. Kent notes that the HII region velocities of Deharveng & Pellet (1975a, b) show a similar drop to the HI data on the NE side, which adds credibility to his rotation curve there.
Recent CO observations of M31 help to resolve this discrepancy. Since molecular gas is generally more centrally concentrated than atomic gas, it is likely that a rotation curve constructed from CO data will be less prone to confusion from the warped outer disk. Loinard et al. (1999) (see also references therein) have made CO observations sensitive enough to detect the dim emission from the inner disk, and their data are summarized in Berman & Loinard (2002). Loinard, Allen, & Lequeux (1995) show the good overall agreement between the CO and the Brinks & Shane (1984) HI observations, and comment on the large velocity range seen in the inner few kpc. Berman & Loinard (2002) fit a triaxial bulge model, which successfully reproduces many features from the CO data. Their rotation curve has a peak in the central few kpc, but it is less pronounced than Braun’s. Also, between 3 and 10 kpc their rotation curve shows a gradual fall, not the monotonic rise of Braun’s. Because of the greater agreement between the rotation curves of Kent (1989) and both the HII region data of Deharveng & Pellet (1975a, b) and the CO data of Berman & Loinard (2002) we will use the Kent rotation curve as a guide in what follows.
We can also use the velocities of the disk clusters themselves to constrain the rotation curve. We find that their kinematics are best fit by a rotation curve with a slow turnover starting at R=6.5 kpc rather than one which stays flat or rising until 2 kpc and then peaks. The reason for this can be seen in Figures 2 and 3. If the rotation curve stayed flat or even rose inside 10 kpc, we would not see the almost linear feature in velocity for X between –4 and –6 kpc: we would instead expect to see the cluster velocities stay close to –250 km/s.
To put this argument on a more quantitative basis, we select clusters with 50% or more of their velocity projected into the line of sight, and with (to maximise the contribution from disk clusters). We then calculate the expected velocity from a cluster in a cold disk (velocity dispersion = 0) at that X and Y position, and calculate the difference between the cluster’s true velocity and this expected velocity. We consider disks with a range of rotation curves. Each rotation curve is flat with = 250 km/s until it reaches the turnover point Rturn, and then decreases linearly to zero for R=0. We considered values of Rturn between 3 and 10 kpc and calculated , the sum of square of the residuals, for each rotation curve, finding a distinct minimum for a turnover radius of Rturn=6.5 kpc. We have used this simple rotation curve for all the kinematic models in this paper.
2.3.2 Estimating disk kinematics
At this stage, the relatively small sample size makes it difficult to produce exact estimates of the kinematics of the disk subsystem. Until we obtain a larger and more complete sample of velocities of the disk clusters, we will estimate their kinematics by eye. This graphical method also allows the clusters which likely do not belong to the disk to be discounted.
Figure 5 plots the velocity residuals from a cold disk against X for all clusters with kpc which have 50% or more of their velocity projected into the line of sight. The lower panel shows real velocities (crosses) joined by a dotted line to the predicted velocity from a cold disk object at that X and Y (open circles). The length of the dotted line is the residual plotted in the upper two panels, for both real data (middle panel) and the thin disk model of Table 1 (top panel). It can be seen that the velocity residual panel for the real data is well explained by a combination of the disk model shown above and a population with higher velocity dispersion which we have identified with the bulge.
3 Properties of the Thin Disk Clusters
3.1 Deciding Disk Membership
When two populations have spatial and kinematic overlaps, as in this case, it is not possible to allocate a cluster with 100% accuracy to a certain population. The problem is accentuated here because there is some uncertainty in the kinematic parameters of both populations. We have chosen to measure the difference between the actual cluster velocity and the velocity of an object belonging to a totally cold disk at the same X and Y. This residual will be small for disk objects and larger, on average, for bulge objects.
Because the velocity dispersion of a real disk with constant scale height increases towards its center, we normalize this residual using a measure of velocity spread obtained from 100 realizations of our best fit disk model for each X and Y. The interquartile range of disk model velocities gives a non-parametric estimate of the expected spread of velocities from the model disk, and we divide by it to normalize the residual appropriately.
Thus for a given cluster, the residual is defined to be:
We use our simulations to describe the distribution of residuals from both a pure disk and a pure bulge population. In both cases we have taken a single realization of the kinematic models and calculated the residuals as described above. Figure 6 shows the behaviour of these residuals. It can be seen that the disk objects cluster around a residual of 0: all but a couple have residuals between –2 and 2; in fact 83% have residuals between –1 and 1 and 68% have residuals between -0.75 and 0.75. By contrast, 31% (28%) of the bulge model objects have residuals between –1 and 1 (–0.75 and 0.75). Thus, classifying objects with residual between –0.75 and 0.75 as disk members gives a 30% chance of mis-classification in both directions (calling a disk object a bulge member or calling a bulge object a disk member).

We have chosen to plot various quantities against this residual so that the effect of another choice of cut in the residual value defining disk membership (either more conservative or more permissive) can be readily seen.
Table 2 gives the value of this residual for all clusters projected on the disk with velocity errors less than 20 km/s. The letters preceding the identification number in the M31 globular cluster names refer to the catalogs listed in Table 3.
| ID | Residual | X (arcmin) | Y (arcmin) | velocity (km/s) | velocity error | [Fe/H] | [Fe/H] error |
|---|---|---|---|---|---|---|---|
| B1–S39 | 5.67 | –34.21 | 14.76 | –174 | 12 | –0.58 | 0.18 |
| B4–S50 | –2.27 | –11.72 | 25.70 | –373 | 12 | –1.26 | 0.59 |
| B5–S52 | 4.28 | –42.10 | 1.72 | –273 | 12 | –1.18 | 0.17 |
| B8–S60 | 0.70 | –15.46 | 19.88 | –319 | 12 | –0.41 | 0.38 |
| B10–S62 | 5.70 | –16.72 | 18.61 | –159 | 12 | –1.77 | 0.14 |
| B12–S64 | –0.98 | –10.79 | 22.98 | –358 | 12 | –1.65 | 0.19 |
| B13–S65 | –3.49 | –7.21 | 24.32 | –409 | 12 | –1.01 | 0.49 |
| B15 | –0.04 | –26.57 | 7.78 | –460 | 12 | –0.35 | 0.96 |
| B16–S66 | –2.60 | –8.99 | 21.35 | –406 | 12 | –0.78 | 0.19 |
| B17–S70 | –3.31 | –16.53 | 14.67 | –524 | 12 | –0.42 | 0.45 |
| B18–S71 | –1.23 | –40.63 | –4.15 | –585 | 12 | –1.63 | 0.77 |
| B19–S72 | 4.07 | –10.73 | 18.25 | –224 | 2 | –1.09 | 0.02 |
| B21–S75 | 0.16 | –20.45 | 9.18 | –403 | 12 | –0.90 | 0.06 |
| B23–S78 | –2.21 | –13.79 | 13.81 | –454 | 6 | –0.92 | 0.10 |
| B25–S84 | 3.16 | –22.98 | 3.99 | –204 | 12 | –1.46 | 0.13 |
| B26–S86 | 1.98 | –3.64 | 18.53 | –243 | 12 | 0.01 | 0.38 |
| B28–S88 | 0.72 | –23.64 | 2.54 | –434 | 12 | –1.87 | 0.29 |
| B29–S90 | –0.32 | –22.44 | 3.15 | –509 | 12 | –0.32 | 0.14 |
| B30–S91 | 1.62 | –24.80 | 1.10 | –380 | 12 | –0.39 | 0.36 |
| B31–S92 | 1.08 | –23.12 | 1.88 | –400 | 12 | –1.22 | 0.40 |
| B33–S95 | 0.41 | –21.57 | 1.78 | –439 | 12 | –1.33 | 0.24 |
| B34–S96 | –0.11 | –26.43 | –2.40 | –540 | 12 | –1.01 | 0.22 |
| B37 | 0.25 | –8.99 | 9.52 | –338 | 12 | –1.07 | 0.20 |
| B38–S98 | 2.25 | –5.45 | 12.03 | –177 | 12 | –1.66 | 0.44 |
| B39–S101 | 1.60 | –3.99 | 12.72 | –248 | 12 | –0.70 | 0.32 |
| B40–S102 | –0.40 | –35.38 | –11.94 | –463 | 12 | –0.98 | 0.48 |
| B41–S103 | –0.13 | –8.44 | 8.56 | –372 | 12 | –1.22 | 0.23 |
| B42–S104 | 0.67 | –14.11 | 3.93 | –352 | 12 | –0.78 | 0.31 |
| B43–S106 | 0.42 | –33.58 | –11.38 | –414 | 12 | –2.42 | 0.51 |
| B45–S108 | –5.24 | 7.28 | 20.24 | –425 | 0 | –1.05 | 0.25 |
| B47–S111 | –1.02 | 13.66 | 24.63 | –291 | 12 | –1.62 | 0.41 |
| B48–S110 | 1.27 | –8.88 | 7.09 | –255 | 12 | –0.40 | 0.37 |
| B49–S112 | –0.39 | –27.49 | –7.41 | –481 | 12 | –2.14 | 0.55 |
| B50–S113 | 6.32 | 6.04 | 18.52 | –114 | 12 | –1.42 | 0.37 |
| B51–S114 | 0.99 | 0.57 | 14.17 | –259 | 12 | –1.00 | 0.13 |
| B53 | 4.68 | –1.39 | 12.52 | –13 | 12 | –0.33 | 0.26 |
| B54–S115 | 0.47 | –18.56 | –0.96 | –412 | 12 | –0.45 | 0.17 |
| B55–S116 | 0.67 | –9.34 | 5.56 | –338 | 12 | –0.23 | 0.07 |
| B56–S117 | 1.16 | –20.72 | –3.48 | –382 | 12 | –0.06 | 0.10 |
| B57–S118 | 0.27 | –24.94 | –7.16 | –437 | 12 | –2.12 | 0.32 |
| B58–S119 | 4.25 | –28.78 | –10.21 | –210 | 16 | –1.45 | 0.24 |
| B59–S120 | 0.38 | –9.86 | 4.29 | –332 | 12 | –1.36 | 0.52 |
| B61–S122 | –0.23 | 5.49 | 14.82 | –286 | 12 | –0.73 | 0.28 |
| B65–S126 | 0.44 | –33.24 | –15.81 | –378 | 12 | –1.56 | 0.03 |
| B66–S128 | 0.70 | –29.50 | –13.18 | –389 | 12 | –2.10 | 0.35 |
| B69–S132 | –0.27 | 3.40 | 11.90 | –295 | 12 | –1.35 | 0.43 |
| B72 | 2.89 | 0.97 | 9.56 | –89 | 12 | –0.38 | 0.25 |
| B74–S135 | –5.61 | 17.26 | 22.11 | –435 | 12 | –1.88 | 0.06 |
| B75–S136 | 1.02 | –0.79 | 7.85 | –212 | 12 | –1.03 | 0.33 |
| B76–S138 | –1.13 | –12.44 | –1.58 | –514 | 12 | –0.72 | 0.06 |
| B81–S142 | –0.47 | –25.22 | –12.36 | –430 | 12 | –1.74 | 0.40 |
| B82–S144 | 0.66 | –15.04 | –4.95 | –364 | 6 | –0.80 | 0.18 |
| B83–S146 | –4.15 | 19.78 | 22.10 | –367 | 12 | –1.27 | 0.35 |
| B88–S150 | –5.36 | 9.99 | 13.35 | –484 | 12 | –1.81 | 0.06 |
| B90 | –0.43 | –13.07 | –4.68 | –428 | 12 | –1.39 | 0.80 |
| B91–S151 | –0.16 | 2.06 | 7.01 | –290 | 12 | –1.80 | 0.61 |
| B93–S155 | –2.09 | 1.94 | 6.57 | –442 | 12 | –1.03 | 0.12 |
| B94–S156 | –1.99 | –17.08 | –8.75 | –561 | 12 | –0.41 | 0.31 |
| B97–S159 | –0.11 | 5.44 | 8.29 | –282 | 12 | –1.21 | 0.13 |
| B102 | 0.17 | 12.63 | 13.34 | –236 | 12 | –1.57 | 0.10 |
| B104 | –0.76 | –0.66 | 2.91 | –395 | 10 | ||
| B105–S166 | 0.24 | 9.71 | 10.83 | –238 | 12 | –1.13 | 0.32 |
| B109–S170 | –0.37 | –5.88 | –1.70 | –372 | 12 | –0.13 | 0.41 |
| B110–S172 | 1.49 | –11.28 | –6.15 | –264 | 12 | –1.06 | 0.12 |
| B116–S178 | –1.67 | 12.03 | 11.75 | –339 | 12 | –0.88 | 0.12 |
| B117–S176 | –2.68 | –16.10 | –10.23 | –531 | 12 | –1.33 | 0.45 |
| B118 | 1.62 | –2.25 | 0.32 | –72 | 10 | ||
| B119 | 0.07 | 0.19 | 2.11 | –310 | 12 | –0.49 | 0.18 |
| B122–S181 | –3.30 | 13.40 | 11.50 | –437 | 12 | –1.69 | 0.34 |
| B124 | 2.64 | –0.93 | 0.04 | 70 | 13 | ||
| B125–S183 | –3.41 | –8.60 | –6.24 | –647 | 12 | –1.52 | 0.08 |
| B126–S184 | 1.13 | –2.76 | –2.04 | –182 | 14 | –1.20 | 0.47 |
| B127–S185 | –1.02 | –1.12 | –0.92 | –475 | 12 | –0.80 | 0.14 |
| B129 | 1.52 | 7.53 | 4.94 | –75 | 12 | –1.21 | 0.32 |
| B130–S188 | 1.97 | 11.34 | 7.80 | –22 | 12 | –1.28 | 0.19 |
| B134–S190 | –0.38 | –0.79 | –2.37 | –365 | 12 | –0.64 | 0.08 |
| B135–S192 | –2.14 | 12.68 | 8.12 | –366 | 12 | –1.62 | 0.04 |
| B137–S195 | 0.06 | 13.79 | 8.50 | –215 | 12 | –1.21 | 0.29 |
| B140 | –0.63 | –4.04 | –6.61 | –413 | 12 | –0.88 | 0.77 |
| B141–S197 | 0.37 | 14.83 | 8.06 | –180 | 12 | –1.59 | 0.21 |
| B144 | 0.94 | 1.76 | –2.33 | –140 | 12 | –0.64 | 0.21 |
| B147–S199 | 1.94 | 6.32 | 0.39 | –51 | 1 | –0.24 | 0.36 |
| B148–S200 | –0.44 | 3.78 | –1.69 | –303 | 12 | –1.15 | 0.34 |
| B149–S201 | 1.69 | 16.86 | 8.18 | –60 | 12 | –1.35 | 0.25 |
| B156–S211 | –1.27 | –8.27 | –13.51 | –417 | 12 | –1.51 | 0.38 |
| B158–S213 | 1.94 | –3.44 | –9.88 | –187 | 1 | –1.02 | 0.02 |
| B159 | 0.37 | 10.66 | 1.13 | –175 | 12 | –1.58 | 0.41 |
| B160–S214 | –0.46 | –7.89 | –13.51 | –354 | 12 | –1.17 | 1.25 |
| B161–S215 | –1.02 | –0.11 | –7.51 | –413 | 12 | –1.25 | 0.35 |
| B163–S217 | 0.56 | 13.01 | 2.23 | –161 | 3 | –0.36 | 0.27 |
| B164 | 0.07 | 1.05 | –7.26 | –294 | 12 | –0.09 | 0.40 |
| B166 | 2.88 | 1.37 | –7.56 | –23 | 12 | –1.33 | 0.37 |
| B167 | 0.44 | 2.69 | –6.68 | –229 | 12 | –0.42 | 0.23 |
| B170–S221 | 1.54 | –15.46 | –21.52 | –295 | 12 | –0.54 | 0.24 |
| B171–S222 | –0.04 | 4.37 | –6.42 | –273 | 2 | –0.41 | 0.04 |
| B176–S227 | –6.65 | –15.84 | –23.49 | –525 | 12 | –1.60 | 0.10 |
| B179–S230 | 0.72 | 7.08 | –5.62 | –153 | 12 | –1.10 | 0.02 |
| B180–S231 | 1.69 | –1.07 | –12.18 | –203 | 12 | –1.19 | 0.07 |
| B182–S233 | –1.30 | –0.17 | –12.64 | –349 | 4 | –1.24 | 0.12 |
| B184–S236 | –0.20 | 22.23 | 4.78 | –152 | 12 | –0.37 | 0.40 |
| B185–S235 | 1.40 | 5.02 | –8.71 | –163 | 12 | –0.76 | 0.08 |
| B188–S239 | 0.15 | 13.15 | –3.33 | –184 | 12 | –1.51 | 0.17 |
| B190–S241 | 0.49 | 20.95 | 2.38 | –86 | 12 | –1.03 | 0.09 |
| B193–S244 | 0.65 | 23.45 | 3.84 | –58 | 2 | –0.44 | 0.17 |
| B197–S247 | 1.30 | 18.61 | –0.98 | –9 | 12 | –0.43 | 0.36 |
| B198–S249 | 0.33 | 19.98 | 0.02 | –105 | 12 | –1.13 | 0.30 |
| B199–S248 | –2.45 | –6.45 | –20.76 | –396 | 12 | –1.59 | 0.11 |
| B200 | –0.21 | 18.07 | –1.57 | –153 | 12 | –0.91 | 0.61 |
| B203–S252 | –0.91 | 21.19 | –0.36 | –199 | 12 | –0.90 | 0.32 |
| B204–S254 | –1.61 | 13.00 | –7.00 | –355 | 12 | –0.80 | 0.17 |
| B205–S256 | –2.15 | 15.25 | –5.67 | –352 | 19 | –1.34 | 0.13 |
| B207–S258 | 3.52 | 0.90 | –17.27 | –173 | 12 | –0.81 | 0.59 |
| B208–S259 | –0.29 | 14.33 | –6.83 | –222 | 12 | –0.84 | 0.04 |
| B209–S261 | –2.99 | 16.39 | –5.81 | –467 | 12 | –1.37 | 0.13 |
| B210 | 0.11 | 7.74 | –12.67 | –265 | 12 | –1.90 | 0.32 |
| B213–S264 | –4.75 | 20.58 | –2.71 | –539 | 12 | –1.02 | 0.11 |
| B214–S265 | –1.26 | 17.22 | –5.47 | –258 | 12 | –1.00 | 0.61 |
| B216–S267 | –0.10 | 26.90 | 1.02 | –84 | 12 | –1.87 | 0.39 |
| B217–S269 | 2.30 | 16.07 | –7.97 | –38 | 12 | –0.93 | 0.14 |
| B218–S272 | 0.36 | 12.95 | –11.32 | –220 | 1 | –1.19 | 0.07 |
| B219–S271 | –8.64 | –4.65 | –25.40 | –504 | 12 | –0.73 | 0.53 |
| B220–S275 | –1.54 | 22.38 | –5.10 | –245 | 12 | –1.21 | 0.09 |
| B221–S276 | –3.46 | 24.78 | –4.06 | –410 | 12 | –1.29 | 0.04 |
| B222–S277 | –1.07 | 10.22 | –16.12 | –311 | 12 | –1.11 | 0.37 |
| B223–S278 | –0.01 | 26.45 | –3.68 | –101 | 12 | –1.13 | 0.51 |
| B224–S279 | –0.08 | 21.89 | –7.30 | –161 | 2 | –1.80 | 0.05 |
| B225–S280 | 1.43 | 16.50 | –12.16 | –165 | 0 | –0.67 | 0.12 |
| B231–S285 | –1.33 | 22.40 | –9.65 | –266 | 12 | –1.49 | 0.41 |
| B232–S286 | 2.52 | 12.58 | –17.82 | –179 | 12 | –1.83 | 0.14 |
| B234–S290 | –0.27 | 24.51 | –9.85 | –196 | 12 | –0.95 | 0.13 |
| B235–S297 | 1.47 | 25.93 | –11.48 | –98 | 12 | –0.72 | 0.26 |
| B237–S299 | 4.54 | 21.89 | –17.38 | –86 | 12 | –2.09 | 0.28 |
| B238–S301 | 5.80 | 20.22 | –20.02 | –32 | 12 | –0.57 | 0.66 |
| B272–V294 | 0.46 | 21.32 | 6.93 | –120 | 12 | –1.25 | 0.16 |
| B281–S288 | 0.76 | 16.91 | –15.01 | –203 | 12 | –0.87 | 0.52 |
| B283–S296 | 5.35 | 15.92 | –18.80 | –83 | 12 | –0.06 | 0.20 |
| B298–S21 | –4.22 | –58.24 | 22.73 | –542 | 12 | –2.07 | 0.11 |
| B301–S22 | 7.37 | –87.83 | –4.94 | –374 | 12 | –1.22 | 0.18 |
| B303–S26 | 1.84 | –65.50 | 5.19 | –464 | 12 | –2.09 | 0.41 |
| B305–DAO24 | 1.63 | –73.25 | –2.75 | –497 | 12 | –1.29 | 0.57 |
| B306–S29 | 2.46 | –57.98 | 6.59 | –424 | 12 | –0.64 | 0.40 |
| B307–S30 | 3.02 | –57.95 | 4.29 | –407 | 12 | –0.41 | 0.36 |
| B311–S33 | 2.15 | –57.55 | 0.94 | –463 | 12 | –1.96 | 0.07 |
| B312–S35 | 8.19 | –36.36 | 15.69 | –164 | 12 | –1.41 | 0.08 |
| B313–S36 | 0.93 | –39.11 | 12.51 | –415 | 12 | –1.09 | 0.10 |
| B314–S37 | 0.51 | –69.88 | –11.09 | –485 | 12 | –1.61 | 0.32 |
| B315–S38 | –0.18 | –55.62 | –1.13 | –559 | 12 | –1.88 | 0.52 |
| B316–S40 | 2.86 | –47.00 | 4.29 | –350 | 12 | –1.47 | 0.23 |
| B319–S44 | 0.21 | –51.99 | –1.81 | –535 | 12 | –2.27 | 0.47 |
| B321–S46 | –0.05 | –55.47 | –7.46 | –518 | 12 | –2.39 | 0.41 |
| B327–S53 | 0.25 | –47.65 | –3.51 | –528 | 12 | –2.33 | 0.49 |
| B335 | 0.19 | –43.95 | –4.87 | –514 | 12 | –1.05 | 0.26 |
| B338–S76 | 4.85 | –44.03 | –9.09 | –248 | 12 | –1.34 | 0.08 |
| B341–S81 | 2.79 | –42.79 | –10.58 | –349 | 12 | –1.17 | 0.05 |
| B342–S94 | –0.66 | –40.35 | –12.27 | –479 | 12 | –1.62 | 0.02 |
| B355–S193 | 5.25 | 33.93 | 24.56 | –114 | 12 | –1.62 | 0.43 |
| B356–S206 | 0.43 | 30.06 | 17.38 | –192 | 12 | –1.46 | 0.28 |
| B365–S284 | 4.77 | 61.01 | 21.44 | –58 | 12 | –1.35 | 0.14 |
| B366–S291 | –0.32 | 51.60 | 11.57 | –135 | 12 | –1.79 | 0.05 |
| B367–S292 | –0.58 | 52.98 | 12.55 | –152 | 12 | –2.32 | 0.53 |
| B370–S300 | –6.13 | 49.98 | 3.71 | –347 | 12 | –1.80 | 0.02 |
| B372–S304 | –3.22 | 54.31 | 2.64 | –216 | 12 | –1.42 | 0.17 |
| B373–S305 | –1.46 | 43.72 | –7.86 | –205 | 18 | –0.50 | 0.22 |
| B374–S306 | 0.88 | 41.14 | –10.50 | –96 | 12 | –1.90 | 0.67 |
| B375–S307 | –1.24 | 39.53 | –12.03 | –209 | 12 | –1.23 | 0.22 |
| B378–S311 | –3.29 | 51.68 | –5.12 | –205 | 12 | –1.64 | 0.26 |
| B380–S313 | 1.14 | 58.47 | –1.82 | –13 | 12 | –2.31 | 0.45 |
| B382–S317 | –3.18 | 40.83 | –16.92 | –302 | 12 | –1.52 | 0.27 |
| B386–S322 | –7.57 | 61.66 | –4.23 | –391 | 12 | –1.62 | 0.14 |
| B400–S343 | –8.47 | 91.06 | –3.00 | –253 | 12 | –2.01 | 0.21 |
| B443 | –0.08 | –50.41 | –4.85 | –532 | 12 | –2.37 | 0.46 |
| B448 | –0.16 | –43.13 | –3.01 | –552 | 12 | –2.16 | 0.19 |
| B451 | 0.20 | –32.95 | 2.50 | –514 | 12 | –2.13 | 0.43 |
| B453 | 0.47 | –23.69 | 5.64 | –446 | 12 | –2.09 | 0.53 |
| B458 | –0.83 | –26.44 | –6.37 | –521 | 12 | –1.18 | 0.67 |
| B467–S202 | –6.27 | 38.49 | 24.93 | –344 | 12 | –2.49 | 0.47 |
| B472 | 0.78 | 15.87 | –2.83 | –117 | 12 | –1.45 | 0.02 |
| B475 | –1.02 | 44.98 | 4.10 | –120 | 12 | –2.00 | 0.14 |
| B480 | –0.50 | 44.36 | –8.18 | –135 | 12 | –1.86 | 0.66 |
| B483 | –0.09 | 58.17 | 0.84 | –53 | 12 | –2.96 | 0.35 |
| B484–S310 | 0.06 | 46.69 | –8.31 | –104 | 12 | –1.95 | 0.59 |
| BA11 | –0.97 | 94.70 | –10.54 | –97 | 12 | –1.14 | 0.61 |
| BoD195 | –0.45 | –47.14 | –4.38 | –552 | 12 | –1.64 | 0.19 |
| BoD289 | –0.73 | 74.37 | 3.18 | –78 | 12 | –1.71 | 0.63 |
| BoD292 | –0.27 | 78.96 | 5.21 | –70 | 12 | –0.47 | 0.54 |
| DAO23 | 13.12 | –65.65 | 4.16 | –75 | 12 | –0.43 | 0.13 |
| DAO25 | 12.90 | –78.71 | –10.42 | –188 | 12 | –1.96 | 0.97 |
| DAO30 | –0.77 | –65.86 | –9.56 | –535 | 12 | –0.65 | 0.34 |
| DAO36 | 0.51 | –36.33 | 2.07 | –522 | 12 | –2.16 | 0.32 |
| DAO39 | –0.10 | –26.73 | 5.92 | –478 | 12 | –1.22 | 0.41 |
| DAO41 | –0.46 | –19.27 | 9.21 | –445 | 12 | –1.14 | 0.30 |
| DAO47 | –0.35 | –33.01 | –7.85 | –490 | 12 | –1.13 | 0.57 |
| DAO48 | –0.07 | –27.91 | –6.55 | –490 | 12 | –2.01 | 0.99 |
| DAO58 | 0.79 | 13.13 | 6.19 | –125 | 12 | –0.87 | 0.07 |
| DAO65 | –0.81 | 27.37 | 2.32 | –130 | 12 | –1.80 | 0.36 |
| DAO66 | –1.51 | 28.68 | 2.88 | –148 | 12 | –1.82 | 0.26 |
| DAO70 | –0.08 | 32.78 | –1.90 | –66 | 12 | 0.33 | 0.36 |
| DAO73 | –1.25 | 45.98 | 4.08 | –114 | 12 | –1.99 | 0.19 |
| DAO84 | –1.19 | 42.76 | –11.08 | –192 | 12 | –1.79 | 0.72 |
| NB16 | 1.35 | 1.97 | 4.19 | –115 | 15 | –1.36 | 0.12 |
| NB20 | –0.86 | –4.99 | 0.80 | –402 | 12 | –0.80 | 0.23 |
| NB33 | 0.94 | 0.21 | 4.52 | –183 | 12 | 0.04 | 0.38 |
| NB61 | –2.69 | 1.42 | 4.12 | –646 | 10 | ||
| NB67 | 1.66 | 1.70 | 3.74 | –113 | 17 | –1.43 | 0.13 |
| NB68 | 0.93 | 1.70 | 2.95 | –157 | 11 | –0.76 | 0.33 |
| NB74 | 1.48 | –0.18 | 1.24 | –60 | 12 | –0.02 | 0.43 |
| NB81 | 2.46 | –3.48 | 0.35 | 15 | 11 | –0.75 | 0.33 |
| NB83 | 1.30 | –4.23 | 0.84 | –150 | 14 | –1.26 | 0.16 |
| NB87 | 1.59 | 2.47 | 1.61 | –47 | 10 | 0.26 | 0.41 |
| NB89 | –0.18 | –1.09 | –0.95 | –332 | 6 | –0.53 | 0.57 |
| NB91 | 1.13 | –2.93 | –1.19 | –187 | 10 | –0.71 | 0.33 |
| S47 | –0.62 | –45.78 | –0.01 | –584 | 12 | –1.19 | 0.29 |
| S245 | 0.29 | 15.96 | –2.54 | –148 | 12 | –0.31 | 0.16 |
| V31 | 0.02 | –19.06 | 7.11 | –433 | 12 | –1.59 | 0.06 |
| V216 | 0.16 | –20.17 | 0.96 | –465 | 12 | –1.15 | 0.26 |
| V246 | –0.15 | –2.82 | 6.80 | –344 | 12 | –1.35 | 0.29 |
| Code | Reference |
|---|---|
| B | Battistini et al. (1980, 1987) |
| BA | Baade & Arp (1964) |
| BoD | Battistini et al. (1987, Table VI) |
| DAO | Crampton et al. (1985) |
| NB | Battistini et al. (1993) |
| S | Sargent et al. (1977) |
| V | Vetes̆nik (1962) |
3.2 Numbers and Spatial Distribution
First, we consider the distribution across M31’s disk of the clusters with disk kinematics. Figure 1 shows that the thin disk clusters are found across the entire disk of M31. We can quantify this more exactly by examining histograms of the distribution of deprojected cylindrical R for clusters projected on the disk, shown in Figure 7. We find that 40% of all clusters seen projected on the disk have disk kinematics.

We see from Figures 14 and 15 that there are significant numbers of known clusters (from the compilation of Barmby et al., 2000) with small R whose velocities have not yet been measured. Figure 14 (lower panel) also shows that the compilation of Barmby et al. (2000) is incomplete for small R. Clearly we will need to revisit this question when the sample of globular clusters with small R and velocity estimates has been better explored. At this stage we note that it is possible that the distribution of disk clusters is similar to the distribution of disk starlight, although they appear somewhat more concentrated. However, we can see that there was a large disk in place at the epoch when these globular clusters formed.
3.3 Metallicity
In the Milky Way, most globular clusters with disk kinematics are metal-rich, with [Fe/H]–0.8 (Zinn, 1985), although proper-motion measurements have shown that there are a few clusters with [Fe/H] with disk-like orbits (Cudworth & Hanson, 1993; Dinescu, Girard, & van Altena, 1999). We know that kinematics are not as well-correlated with abundance in M31 because Perrett et al. (2002) showed that M31’s metal-rich clusters have only slightly more rotational support than the metal-poor ones. In fact we find that the metallicity distribution of the clusters with disk kinematics and the rest are roughly similar: both groups contain both metal-rich and metal-poor clusters.
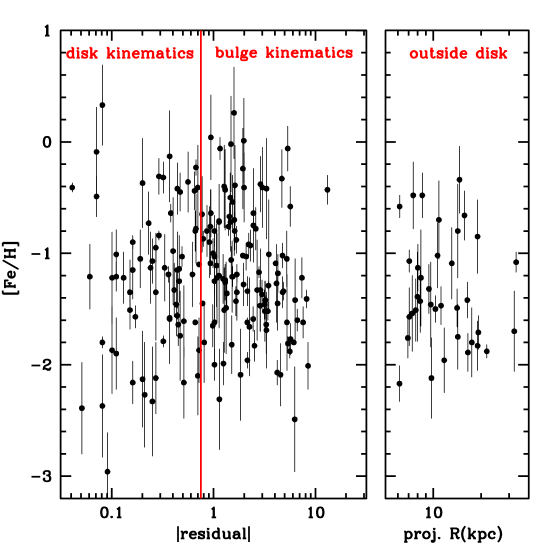
Figure 8 compares the metallicity distribution of clusters that are likely members of the thin disk subsystem with two other groups: clusters projected on the disk whose kinematics are significantly hotter, and those whose position is outside the disk altogether. The disk clusters (with residual have larger metallicity errors than the rest, probably because of their fainter V magnitudes (see Fig. 12). However, apart from the larger apparent spread in disk metallicities to both high and low values, likely to be an artefact of the larger measurement errors, the metallicity distributions of the two kinematical groups projected on the disk look remarkably similar.
In Figure 8 we see that there are more objects with bulge than with disk kinematics. Thus we need to consider the contamination from the more numerous bulge clusters in the objects with small values of the residual. Using the histograms of Figure 6 as a guide, we find that there are 28% of bulge objects with residual, but only 8% with residual. So, with 129 bulge and 88 disk clusters, we would expect 10 of the 38 clusters with residual to be interlopers from the bulge. We note that the clusters with residual still show the large range in [Fe/H] that we remarked on for the larger group of disk clusters.
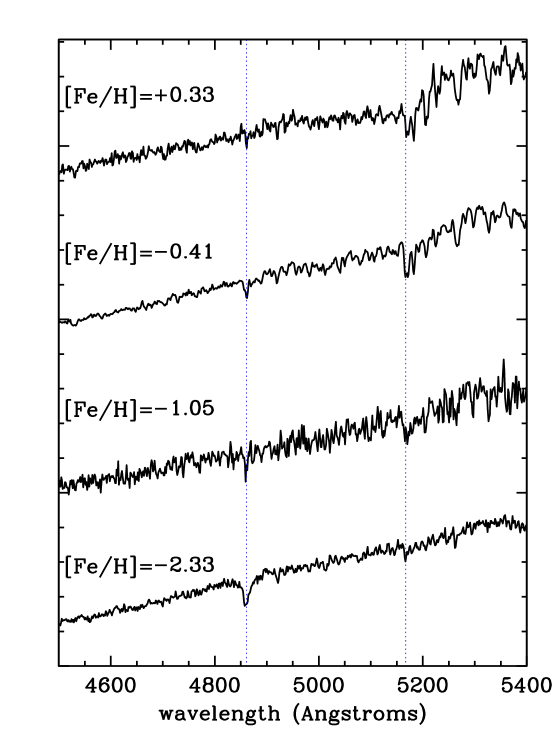
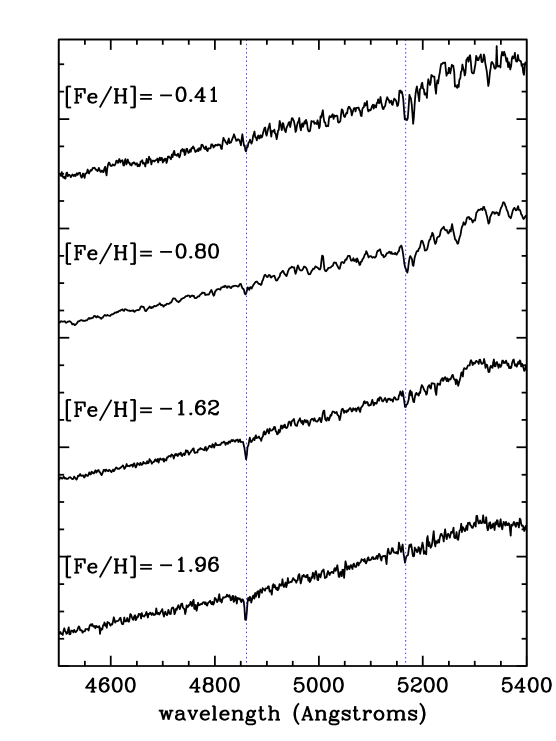
Figures 9 and 10 show the WYFFOS spectra (Perrett et al., 2002) of four clusters from each of the disk and bulge groups. These spectra confirm the results of Figure 8: both metal-rich and metal-poor clusters can be seen in both groups.
The metallicity distribution of the thin disk globular clusters in M31 is consistent with an initial disk forming from very low-metallicity gas and subsequent enriching up to solar abundance or even higher during the globular cluster formation era. The metallicity distribution of disk globulars in the Milky Way has led to suggestions that the proto-disk gas was pre-enriched by star formation in the spheroid (eg Larson, 1976), but this assumption is not necessary in the case of the M31 clusters.
While it is often risky to use metallicity as a rough measurement of age, as star formation can proceed at different rates in a galaxy, we can be fairly sure that the most metal-poor disk clusters with [Fe/H]–2.0 formed in the early stages of M31’s disk formation. This is because it would be very difficult for the gas that the disk globular clusters formed from to remain un-enriched by the ongoing star formation in M31’s disk: both mass loss from high-mass stars and supernova ejecta would mix into the existing disk gas, enriching it to higher metallicity. In Figure 1 we show the spatial distribution of both the disk globular clusters with [Fe/H] (red filled circles) and of the most metal-poor disk globular clusters with [Fe/H] (blue stars). The fact that the most metal-poor disk clusters are found across much of M31’s disk is another indication that M31 had a reasonably large disk at early epochs.
3.4 Cluster Reddening and Luminosity Function
In the past, measurements of the luminosity function (LF) of the M31 globular clusters have used only clusters outside the disk region of M31 so that reddening from the disk does not bias the result. However, the available data has increased significantly both in quantity and quality in the past few years. Barmby et al. (2000) compiled photometry of the M31 clusters in UBVRI and JHK, and used color-color relations from the low-reddening Milky Way globular clusters to estimate the reddening of over 300 M31 globulars. These cluster reddenings, kindly made available by Pauline Barmby, allow us to compare the reddening and absolute magnitude of the disk clusters to the rest.
We examine the reddening values for the clusters from the Perrett et al. (2002) sample with good velocities which also have reliable reddening measures from Barmby et al. (2000). E(B–V) values are shown in Figure 11. First, it is comforting to note that the clusters outside the disk region have values consistent with foreground reddening from the Milky Way only. Clusters projected on M31’s disk can be both in front and behind the disk reddening layer, so we would expect the clusters in this region which are in front of the M31 disk to have reddenings as low as the clusters outside the disk, as is seen. However, other clusters (both with and without disk kinematics) have much higher reddening values, suggesting that they are either in or behind the M31 dust layer.
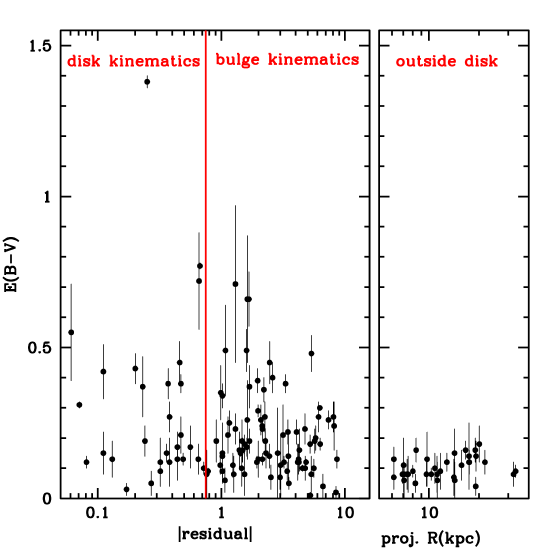
However, before we proceed further, it is necessary to calculate the number of interlopers from the bulge that are likely to be in the disk region of the Figure. There are 98 clusters with residual and 46 with residual in Figure 11. With almost twice as many bulge as disk clusters, the interloper problem becomes severe. For the bulge model of Table 1, we would expect about 27 bulge interlopers with residual and 8 with residual, compared with 46 and 16 clusters respectively observed. Thus approximately 50% of the objects with disk kinematics in Figure 11 are likely to be interlopers from the bulge. Worse, this number may vary significantly depending on the exact kinematics of the bulge clusters and on small number statistics. So, although we will proceed to calculate the luminosity function for the bulge and disk clusters, these results should be viewed as preliminary only. We need a larger sample of disk clusters with accurate values of E(B–V) before we can calculate the luminosity function of the disk clusters with any reliability.
Since discovery of disk clusters is likely to be more difficult against the bright and variable background of the disk, we need to see whether the samples have similar limiting magnitudes before we compare their luminosity functions. Figure 12 shows the distribution of V magnitude (uncorrected for reddening) for the cluster sample as a function of disk membership residual or projected distance from the center. We note first that the clusters with multicolor photometry available (needed to provide a reddening estimate, shown with solid circles in Figure 12) are less likely to belong to the disk. Clearly there is a need to obtain good photometry in a number of passbands for more of the clusters projected on its disk. Clusters outside the disk are not well represented in the velocity sample of Perrett et al. (2002) because they were not able to obtain spectra there due to poor weather. Thus we have simply used the clusters from the compilation of Barmby et al. (2000) to show the V magnitude measures of clusters outside the disk region.
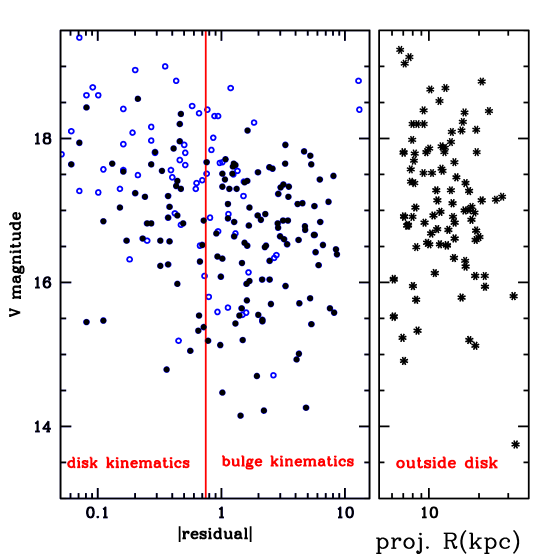
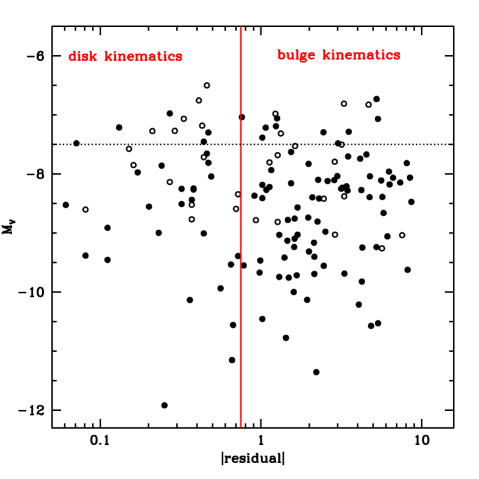
It can be seen in Figure 12 that the clusters outside the disk will have a luminosity function that extends fainter than the LF of the clusters inside the disk region for two reasons. We can safely assume that all the clusters outside the disk region have the same reddening (see Figure 11) and so can use the entire sample in the right panel of Figure 12 for constructing a LF. However, inside the disk region, we will only be able to use clusters with actual reddening estimates (shown with filled symbols) in making the LF for the disk region. These clusters have brighter V magnitudes than the clusters outside the disk, and because they have higher reddening on average they will have even brighter absolute magnitudes. However, we can compare the luminosity functions of clusters projected on the disk with disk and non-disk kinematics, because the limiting magnitudes of these two samples are similar.
Figure 13 shows that, with our current smallish sample of 20–40 disk clusters with E(B–V) estimates, there is no perceptible difference between the luminosity functions of clusters with and without disk kinematics. We are working to obtain E(B–V) estimates for a larger sample of clusters projected on the disk. At present we find that there is no strong evidence for a difference in luminosity function with kinematics.
If this result is borne out with a larger sample of disk clusters, thus avoiding much of the problems with bulge contamination in the disk area, we could conclude from the similarity of luminositity functions and metallicity distributions that there are unlikely to be large differences in mass or age between the two samples ….. unless the disk clusters are both less massive and younger and the two effects cancel. We will revisit this question in a future paper when we will use integrated colors and spectra to measure ages more accurately.
Even at this preliminary stage, however, it is clear that the luminosity function of the thin disk globulars in M31 is quite different from that of the thin disk old open clusters in the Milky Way. The open clusters with ages greater than 1 Gyr have a mean of –3.5 (Battinelli, Brandimarti, & Capuzzo-Dolcetta, 1994), in contrast to the Milky Way or M31 globular clusters whose mean is close to –7.5.
3.5 Disk heating mechanisms and how they affect globular clusters
Young disk stars in the Milky Way have a low velocity dispersion (of order 10 km/s). Their orbits acquire additional energy via encounters with inhomogeneities in the disk potential such as spiral arms and giant molecular clouds (Jenkins & Binney, 1990), and old disk stars are found to have velocity dispersions of order 30–40 km/s. The mass of an individual globular cluster is close to that of a molecular cloud but significantly smaller than a spiral arm. It is possible that the heating processes will be different in interactions between objects of similar mass.
It is thought that interactions between stars and spiral arms heat mostly the radial and azimuthal velocity components, while molecular clouds affect the vertical velocity (Jenkins & Binney, 1990). So we might expect the vertical velocity dispersion of the disk globular clusters to be lower than that of the disk stars if cluster-molecular cloud interactions are less effective, but the R and dispersions of clusters and stars to be similar. Because M31 is close to edge-on, the line of sight velocity is dominated by the R and components, so it is not surprising that the disk globular cluster velocity dispersion is close to that predicted by the Bottema relations for disk stars.
Several groups are currently studying the kinematics of PNe in M31 (eg Hurley-Keller et al., 2003; Halliday, Carter, & Jackson, 1999) and this will allow a direct comparison to be made between the velocities of old disk stars and of globular clusters in M31. If this result holds up, it will provide a confirmation of these theories of secular disk heating.
3.6 Mergers in M31
A more substantial form of disk heating (or destruction) occurs during a minor or major merger. When an object of order 10% of the mass of a disk galaxy is accreted, we term it a minor merger, while “major merger” refers to the situation when the two colliding galaxies are of roughly equal mass. A minor merger transfers some of the orbital energy of the satellite to the disk stars, and the disk becomes both thicker and dynamically hotter, but still remains intact (Quinn & Goodman, 1986; Walker, Mihos, & Hernquist, 1996). Such a merger was thought to have occurred in the Milky Way about 10 Gyr ago (Freeman, 1987; Edvardsson et al., 1993). A major merger will destroy an existing disk completely, with an elliptical galaxy being the most likely final outcome.
When thick disks were first discovered in external galaxies (van der Kruit & Searle, 1981a, b) it was noted that they were found only in galaxies with substantial bulges. The reason for this correlation is not clear, although it is possible that galaxies with substantial bulges experience more minor mergers than late-type systems (eg Silk & Wyse, 1993). Using this correlation, we would have expected to see a thick disk in M31. However, we have found no strong evidence of this either in PN kinematics (Hurley-Keller et al., 2003) or in globular cluster kinematics444The claim by Sarajedini & Van Duyne (2001) that M31 has a thick disk is based only on a color-magnitude diagram of a field several kpc from M31’s major axis. Given the existence of a warp in M31’s disk (Walterbos & Kennicutt, 1988) and the lack of kinematical evidence for a thick disk, we think that it is more likely that their relatively metal-rich component is related to the warped thin disk. In fact, we can make an even stronger statement: if M31 had experienced a merger, whether major or minor, since its disk globular clusters were formed, they too would have been heated by the merger and would have a significantly larger velocity dispersion than observed. It has been merger-free since their formation.
Brown et al. (2003) found, using very deep HST ACS photometry of a field 11 kpc out on the SW minor axis, that there is a population of younger stars in this field. Their initial estimate for the age of the younger group was 6–8 Gyr, but this may not be unique due to the complexities of fitting CMDs for mixtures of populations. They suggest several scenarios to explain the relatively high metallicity and large age range of stars in this field. One postulates an interaction between the M31 disk and a roughly equal-mass companion galaxy 6–8 Gyr ago, which either placed disk or satellite stars 11 kpc above the plane. As we have discussed, the coldness of the thin disk clusters rules out any such merger since the clusters were formed.
The M31 globular clusters do not in general have accurate age estimates: until the ACS observations of Brown et al. (2003), no cluster had a color-magnitude diagram which reached to the main sequence turnoff, and in fact the disk globular clusters as a class are even less well-studied, with no HST observations which reliably detect the horizontal branch. Thus we are forced to depend on integrated photometry or spectroscopy to derive age estimates.
Early work by Burstein et al. (1984), using the Lick spectroscopic indices, claimed that the M31 clusters were younger than the Milky Way ones because of their stronger H indices. However, later workers were in general unable to reproduce their results (Brodie & Huchra, 1990, 1991; Huchra, Brodie, & Kent, 1991), and most recent estimates, using high-quality optical or UV spectra, conclude that there is currently little evidence for a difference in mean ages between the two globular cluster populations (Bohlin et al., 1993; Peterson et al., 2003) 555There are preliminary indications that the metal-rich clusters are brighter on average than the metal-poor ones (Barmby, Huchra, & Brodie, 2001), and one possibility is that the metal-rich clusters are younger, but this needs to be confirmed with a larger and more complete sample.. The disk globular clusters pose the additional problem that a number of them are significantly reddened, so both E(B–V) and age will need to be derived reliably.
Thus, although it seems unlikely that all the M31 disk globular clusters are younger than 6–8 Gyr, we cannot rule it out at this time. Thus there are two possibilities:
-
(1)
All the disk globular clusters in M31 are younger than 6–8 Gyr. In this case there is no conflict between our results and the equal-mass merger scenario of Brown et al. (2003). However, it seems unlikely that it was possible to form clusters with metallicities as low as [Fe/H]= –2.0 in M31’s disk as recently as this, as any star formation in the galaxy would result in pre-enrichment of the gas from which the cluster formed. The survival of a significant mass of gas ( solar masses or more) at such low abundance in the disk for a significant time after star formation started seems very unlikely.
-
(2)
The disk globular clusters are of similar ages to the Milky Way globulars. In this case, their kinematics rule out the equal-mass merger suggested by Brown et al. (2003). Any satellite interactions responsible for placing younger stars 11 kpc from M31’s disk must have been with satellites of sufficiently low mass to leave the disk undisturbed. We know that a satellite of mass 10% of the disk mass will heat it significantly, so any interaction must have been with a satellite whose mass was a few percent or smaller, such as M32 whose current mass is 2% of M31’s disk mass.
Using the relation between metallicity and mass for Local Group galaxies (Mateo, 1998), we find that most of the dwarf galaxies in the Local Group have [Fe/H], excepting more massive satellites such as the LMC, which would significantly damage a galaxy disk when accreted. The mean metallicity of stars in the ACS field ([Fe/H]) is interestingly high in this context. If a smaller satellite with mass similar to M32 or NGC 205 were accreted, we would expect to see a combination of ages and metallicities not explored by Brown et al. (2003): an old population with metallicity extending across the entire range of the M31 globular clusters, plus a younger relatively metal-poor population accreted from the infall of a smaller satellite.
There have been interesting recent detections of stellar streams in the outer regions of M31 (Ibata et al., 2001; Ferguson et al., 2002). While these features are likely to be tidal in origin and produced by satellite accretion, we emphasise that any satellite progenitor is likely to be several orders of magnitude less massive than needed to substantially heat the M31 disk. For example, Ibata et al. (2001) quote an average surface brightness of = 30 mag/arcsec2 for the giant stream near the southeastern minor axis, and an absolute magnitude XS = –14. For comparison, the Fornax dwarf spheroidal galaxy has = –13.2 and a mass of order 107 solar masses (Mateo, 1998), more than two orders of magnitude too low in mass to damage a large disk such as M31’s, while M32 has an absolute magnitude of =–16.7 and a mass of approximately 2% of the M31 disk mass (Mateo, 1998), still too low in mass to do significant damage.
4 Discussion: Disk Formation and Evolution
4.1 Comparison with Other Galaxies: the Local Group
As discussed above, the only clusters in the Milky Way with thin disk kinematics are the open clusters, which are several orders of magnitude less luminous than the M31 globular clusters.
Is it possible that a population of thin disk globular clusters exists in the Milky Way but has remained undetected because of extinction by dust? The 2MASS survey has the capacity to detect Galactic objects which are highly reddened, although it is limited by confusion for objects close to the plane. It has only produced 2 candidate globular clusters, at (l,b) of (10,0) (Hurt et al., 2000). The SIRTF satellite, and in particular its planned survey of the galactic plane region, will be able to make a much more sensitive search for these objects. However, while it is possible that there still exists a population of thin disk globular clusters close to the galactic center, it is much less likely that such a population would remain undetected close to the Sun. We have already noted that the M31 disk globulars are found across its entire disk. It is thus unlikely that the Milky Way has a similar population.
However, all but a few of the Milky Way globular clusters are older than 10 Gyr, when we believe that the Milky Way suffered a minor merger which heated the stars then in its thin disk into a thick disk. Since any globular clusters in the then thin disk would have felt the same gravitational forces and would also have become part of the thick disk, we would not expect to find any globular clusters older than 10 Gyr in a thin disk configuration in the Milky Way.
It is interesting to compare the spatial distribution of the most metal-poor globular clusters in the Milky Way’s thick disk with that of the metal-poor globulars in M31’s thin disk, since presumably both systems started as a thin disk. There are four Milky Way globulars with thick-disk orbits: NGC 6121, NGC 6254, NGC 6626 and NGC 6752 (Cudworth & Hanson, 1993; Dinescu, Girard, & van Altena, 1999). They have galactocentric radii of 5.9, 4.6, 2.7 and 5.2 kpc respectively (Harris, 1996), which at first sight looks significantly smaller than the mean radii of the disk globular clusters in M31 (8–10 kpc). However, when we recall that the Milky Way disk is not only less luminous but also smaller than M31’s, with a scale length of 2–3 kpc (Kent, Dame, & Fazio, 1991; Drimmel & Spergel, 2001), compared to 5.3 kpc for M31 (Walterbos & Kennicutt, 1988), then we find that the early disk in both galaxies was probably of a similar size compared to their final scale lengths.
There are two other disk galaxies in the Local Group: the LMC and M33. Both are significantly less massive than the Milky Way and M31. While there are a small number of true globular clusters in the LMC (Olszewski, Suntzeff, & Mateo, 1996) which all have disk kinematics, it is not clear at this stage that there are any similarly old clusters with disk kinematics in M33. Schommer et al. (1991); Chandar et al. (2002) show that M33 clusters with ages greater than 1 Gyr have halo kinematics. It is possible that a study of the oldest M33 clusters with similarly high velocity accuracy to the Perrett et al. (2002) study would show more kinematic substructure in this population.
4.2 Galaxies Outside the Local Group
If a population of globular clusters with disk kinematics has existed in the nearest large spiral and remained undetected until now, it is quite possible that there are similar populations in other nearby spirals.
It is interesting to note in this context the WFPC2 survey for globular clusters in the disk regions of two nearby edge-on spirals by Kissler-Patig et al. (1999). The two spirals, NGC 4565 and NGC 5907, have similar disk luminosities and rotation curve amplitudes, but quite dissimilar bulge-to-disk ratios and stellar populations. NGC 4565 is often used as an edge-on analog of the Milky Way, and has a large bulge (which has been found to be a strong bar viewed close to end-on, Kuijken et al, in preparation) and a bright thick disk with scale height 2 kpc (Morrison, 1999). NGC 5907, by contrast, has a small, almost unresolved bulge, no bright thick disk such as that seen in the Milky Way or NGC 4565, and a faint flattened halo (Morrison, Boroson, & Harding, 1994; Sackett et al., 1994).
Basing our expectations on the Milky Way, with globular clusters associated with the thick disk (or perhaps the bulge) and the halo, we would expect a survey for globular clusters in the disk regions of NGC 4565 and 5907 to produce very different numbers of clusters, because of the much stronger thick disk in NGC 4565. Surprisingly, this is not the case. Kissler-Patig et al. (1999) find that, within the errors, NGC 5907 and NGC 4565 have the same number of globular clusters in the disk-dominated regions they studied. This suggests that there may be a population of globulars associated with the thin disk in these galaxies, as it is the only stellar population with similar properties in this pair. Velocity measurements for these globular clusters will be an useful check of this suggestion.
4.3 The Epoch of Disk Formation
We have shown that M31 has a significant population of globular clusters associated with its thin disk. It is clear that these are at least moderately old (of order 10 Gyr). In addition, the very cold kinematics, which would have been destroyed by even a minor merger, show that the disk has been in place in M31, undisturbed, since the clusters were formed.
This observation provides an interesting complement to the detection of rotating systems at redshifts larger than 1 (eg van Dokkum & Stanford, 2001; Erb et al., 2003). Their spatially resolved disk kinematics for high-redshift galaxies show that there were some reasonably large disks in place at that time, and the detection of large disk-like galaxies with symmetrical, exponential surface brighness distributions in the rest-frame optical at z 2 by Labbe et al. (2003) also hint at an early epoch of disk formation. But we do not know what the ultimate fate of these disks will be. In fact, Labbe et al. (2003) note that their disk-like galaxies are strongly clustered (no similar galaxies are found in the HDF-N) and suggest that they may be the progenitors of cluster S0 galaxies. It is possible that disk formation is a common process, but that many of the disks that form early do not survive.
The areas probed by the very deep surveys needed to identify disks at high redshift are still small, although this is a very active area where several groups are making progress. A combination of low-redshift kinematical studies of nearby disk globular cluster systems such as this paper, and a more complete census of disk galaxies at higher redshift, will allow us to understand the era when the thin disks that we observe today began to form.
5 Summary
We have discovered a new population of globular clusters in M31, with thin disk kinematics. These clusters are spread over much of M31’s disk and have a metallicity distribution similar to the entire M31 globular cluster population, ranging from [Fe/H] below –2.0 to above solar. While we do not have accurate measures of the age of M31 globular clusters yet, there is little indication at this point that they are significantly younger than the Milky Way globulars. More accurate age measures will constrain the formation epoch of the M31 disk, and several groups are working actively in this area (Peterson et al., 2003, Beasley, Brodie, Forbes, Huchra & Barmby, in preparation; Puzia, Perrett, & Bridges, in preparation). M31 is likely to have had a large disk in place at early times.
The existence of such a dynamically cold system of presumably very old objects places interesting limits on the accretion of satellite galaxies since the clusters were formed: no minor merger with a satellite of mass more than 10% of M31’s disk can have occured since that time, because it would have heated the clusters into a dynamically hotter system. This makes the suggestion of Brown et al. (2003) that M31 underwent an equal-mass merger 6–8 Gyr ago less likely, and points to the urgent need for better age estimates for the disk globular clusters. Accretions such as the one which formed the giant tidal stream discovered by Ibata et al. (2001) would have involved a much lower mass satellite which would leave the M31 thin disk unscathed.
Although the Milky Way is unlikely to have a similar population of thin disk globulars, there are intriguing suggestions that there may be similar groups of clusters in some nearby galaxies such as NGC 5907 and NGC 4565, which need to be followed up with velocity data. Velocity studies of some face-on disk galaxies would also be interesting, as we would expect the vertical velocity dispersion of a population of thin disk globulars to be very small because of less efficient secular heating by giant molecular clouds.
A search for such populations in nearby galaxies, and better data on the ages of the M31 globular clusters, will provide an important counterpoint to observations of large disk galaxies at redshifts of order 2: while we are beginning to detect the signatures of such disks at high redshift, we are not able at this point to determine whether they would be disrupted as the galaxies evolve.
Appendix A Asymmetry in kinematics: reddening and completeness of cluster sample
The cold kinematics of the disk globular clusters suggest that their scale height is small. If so, we might expect a number of these clusters to be within the dust layer of M31’s disk. If these clusters are detected at all, they will have larger reddening values than clusters in front of the disk. However, another possibility is that in regions where the disk reddening is particularly high, clusters in and behind the dust layer may not have been detected at all. If this is the case, the kinematical signature of the disk will be less clear in these regions because significant numbers of disk clusters will be obscured.
The recent study of M31 cluster detection and completeness of Barmby & Huchra (2001) using the HST archive gives us the ability to test this hypothesis. Barmby and Huchra searched the HST archive for WFPC2 images of M31, finding a total of 157 fields, many of which are in disk regions. As well as recovering 82 known globular clusters, they found 32 new globular cluster candidates, and used the location of the newly discovered clusters to quantify the incompleteness of the sample. Perhaps surprisingly given M31’s closeness, Barmby & Huchra (2001) show that their sample begins to show incompleteness at V=17, which corresponds roughly to the peak of the GCLF at the distance of M31 (Harris, 1996). Thus a reddening of a few tenths of a dex could well lead to a significant change in the numbers of clusters known in that region.
In the top panel of Figure 14 we show histograms of the Y distribution of (a) the clusters in Barmby et al. (2000) and (b) the subset of these clusters with velocity errors less than 20 km/s from Perrett et al. (2002), which are the clusters our kinematical analysis is based on. It can be seen that there are fewer clusters known with positive than with negative Y in both the Barmby et al. (2000) and the Perrett et al. (2002) samples. Figure 15 shows the X distribution of clusters for values of 2 kpc (where we see the disk signature most clearly) – it can be seen that there are also fewer clusters known with positive than negative X.
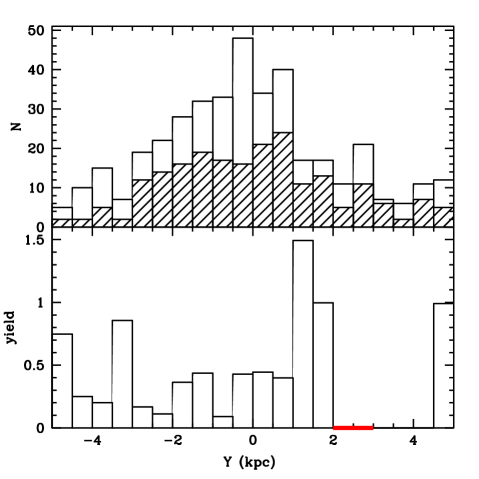
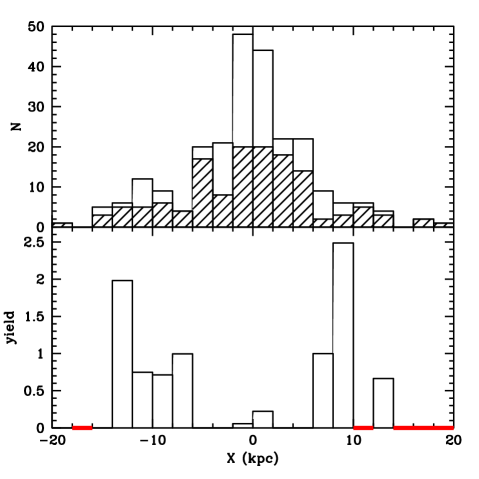
We note at this point that the quadrant with the fewest clusters (X and Y both positive) is also the one with the lowest Galactic latitude. This suggests that foreground extinction from the Milky Way may be contributing to the incompleteness of the M31 cluster sample. However, the small spatial range over which we see pronounced asymmetries in the Y distribution corresponds to less than a degree of galactic latitude. M31 is located at Galactic latitude b=–21.6. 2 kpc at the distance of M31 corresponds to an increase of only 0.1 degrees in b on the minor axis. Because of this it is unlikely that foreground reddening is the major cause of this effect.
Using the new HST cluster candidates, we have quantified the completeness of the cluster sample as follows. We first count the number of WFPC2 fields in a given range of X or Y (counting fractional fields in the few cases where 2 or more WFPC2 fields overlap). We then count the number of new clusters detected in the same range of X or Y (including candidate classes A, B and C from Barmby & Huchra (2001)) and divide the number of new clusters by the number of WFPC2 fields to give the yield of new clusters per WFPC2 field. The bottom panels of Figures 14 and 15 show this yield for the X and Y distribution of clusters. It can be seen that the regions where clusters appear missing in the top panel are the same regions where the incompleteness of the sample is greatest.
A particularly striking result is found for the side of the galaxy with the fewest known clusters – the X distribution for positive Y only. This is shown in Figure 16. For positive X, in all regions where WFPC2 data were available, the sample is incomplete, with yields of up to 3 new clusters per WFPC2 field.
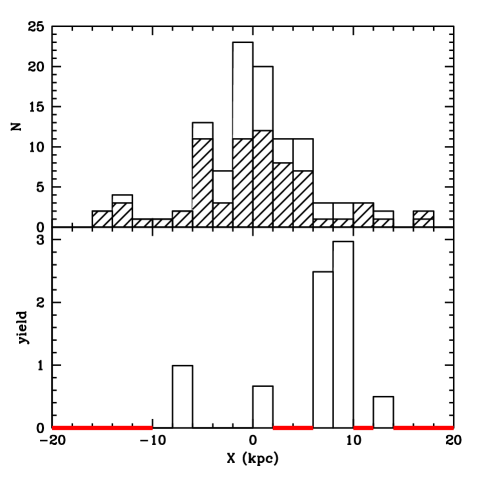
We conclude that the region with positive X and Y has a less complete cluster sample than the other quadrants of the galaxy. We now examine the cluster kinematics for kpc, split into regions of positive and negative Y. If the cluster incompleteness found above has led to fewer disk objects being found in this region because they are hidden within the disk reddening layer, this should be reflected in the kinematics.
Figure 17 shows these kinematics. In order to make the expected disk signature easier to understand, we have also plotted, for each point, the line-of-sight projected value of the disk circular velocity if the cluster were located at the disk midplane. For a thin disk object, this will be close to the mean of the velocity distribution at this point, because the small disk scale height means that no disk clusters are likely to be found very far from the midplane. It can be seen that there are fewer globulars with disk kinematics in the quadrant with both X and Y positive, as expected. This is likely to be due to the lack of disk clusters there in our current sample, as well as the possibility that the higher reddening has made it easier to identify foreground bulge clusters against the bright background of the bulge and disk.
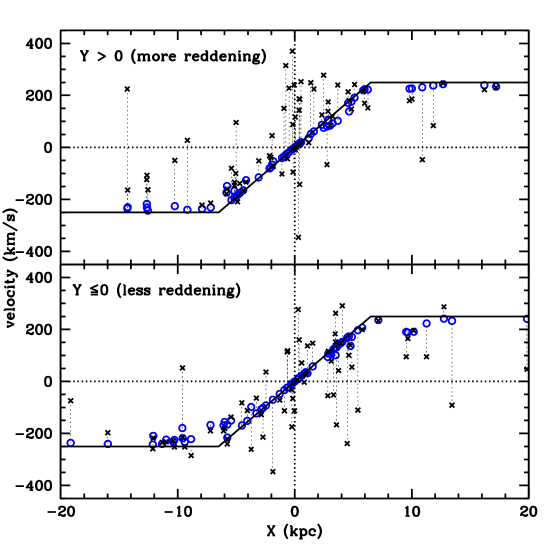
References
- Adelberger et al. (2003) Adelberger, K. L., Steidel, C. C., Shapley, A. E., & Pettini, M. 2003, ApJ, 584, 45
- Armandroff (1989) Armandroff, T. E. 1989, AJ, 97, 375
- Baade (1958) Baade, W. 1958, in Stellar Populations, ed. D.K.J. O’Connell (Amsterdam, North Holland), p303
- Baade & Arp (1964) Baade, W., & Arp, H. 1964, ApJ, 139, 1027
- Barmby et al. (2000) Barmby, P., Huchra, J. P., Brodie, J. P., Forbes, D. A., Schroder, L. L., & Grillmair, C. J. 2000, AJ, 119, 727
- Barmby, Huchra, & Brodie (2001) Barmby, P., Huchra, J. P., & Brodie, J. P. 2001, AJ, 121, 1482
- Barmby & Huchra (2001) Barmby, P. & Huchra, J. P. 2001, AJ, 122, 2458
- Barnes & Hernquist (1992) Barnes, J. E. & Hernquist, L. 1992, ARA&A, 30, 705
- Battinelli, Brandimarti, & Capuzzo-Dolcetta (1994) Battinelli, P., Brandimarti, A., & Capuzzo-Dolcetta, R. 1994, A&AS, 104, 379
- Battistini et al. (1980) Battistini, P., Bònoli, F.,Braccesi, A., Fusi Pecci, F., & Malagnini, M. L. 1980, A&AS, 42, 357
- Battistini et al. (1987) Battistini, P., Bònoli,F., Braccesi, A., Federici, L., Fusi Pecci, F., Marano, B., & Börngen, F. 1987, A&AS, 67, 447
- Battistini et al. (1993) Battistini, P. L., Bònoli,F., Casavecchia, M., Ciotti, L., Federici, L., & Fusi Pecci, F. 1993, A&A, 272, 77
- Berman & Loinard (2002) Berman, S. & Loinard, L. 2002, MNRAS, 336, 477
- Binney and Tremaine (1987) Galactic Dynamics, by Binney, J. and Tremaine, S., p 120, Princeton University Press, Princeton, New Jersey
- Bohlin et al. (1993) Bohlin, R. C. et al. 1993, ApJ, 417, 127
- Bottema (1993) Bottema, R. 1993, A&A, 275, 16
- Braun (1991) Braun, R. 1991, ApJ, 372, 54.
- Brinks & Shane (1984) Brinks, E. & Shane, W. W. 1984, A&AS, 55, 179
- Brodie & Huchra (1991) Brodie, J. P. & Huchra, J. P. 1991, ApJ, 379, 157
- Brodie & Huchra (1990) Brodie, J. P. & Huchra, J. P. 1990, ApJ, 362, 503
- Brown et al. (2003) Brown, T. M., Ferguson, H. C., Smith, E., Kimble, R. A., Sweigart, A. V., Renzini, A., Rich, R. M., & VandenBerg, D. A. 2003, astro-ph/0305318
- Burstein et al. (1984) Burstein, D., Faber, S. M., Gaskell, C. M., & Krumm, N. 1984, ApJ, 287, 586
- Carney, Latham, & Laird (1989) Carney, B. W., Latham, D. W., & Laird, J. B. 1989, AJ, 97, 423
- Chandar et al. (2002) Chandar, R., Bianchi, L., Ford, H. C., & Sarajedini, A. 2002, ApJ, 564, 712
- Côté (1999) Côté, P. 1999, AJ, 118, 406
- Crampton et al. (1985) Crampton, D., Cowley, A. P., Schade, D., Chayer, P. 1985, ApJ, 288, 494
- Cretton et al. (2001) Cretton, N., Naab, T., Rix, H., & Burkert, A. 2001, ApJ, 554, 291
- Cudworth & Hanson (1993) Cudworth, K. M. & Hanson, R. B. 1993, AJ, 105, 168
- Deharveng & Pellet (1975a) Deharveng, J. M. & Pellet, A. 1975, A&AS, 19, 351
- Deharveng & Pellet (1975b) Deharveng, J. M. & Pellet, A. 1975, A&A, 38, 15
- Dinescu et al. (2003) Dinescu, D. I., Girard, T. M., van Altena, W. F., & López, C. E. 2003, AJ, 125, 1373
- Dinescu, Girard, & van Altena (1999) Dinescu, D. I., Girard, T. M., & van Altena, W. F. 1999, AJ, 117, 1792
- Drimmel & Spergel (2001) Drimmel, R. & Spergel, D. N. 2001, ApJ, 556, 181
- Durrell, Harris, & Pritchet (1994) Durrell, P. R., Harris, W. E., & Pritchet, C. J. 1994, AJ, 108, 2114.
- Durrell, Harris, & Pritchet (2001) Durrell, P. R., Harris, W. E., & Pritchet, C. J. 2001, AJ, 121, 2557.
- Edvardsson et al. (1993) Edvardsson, B., Andersen, J ., Gustafsson, B., Lambert, D. L., Nissen, P. E., & Tomkin, J. 1993, A&A, 275, 101.
- Erb et al. (2003) Erb, D. K., Shapley, A. E., Steidel, C. C., Pettini, M., Adelberger, K. L., Hunt, M. P., Moorwood, A. F. M., & Cuby, J. 2003, astro-ph/0303392
- Ferguson et al. (2002) Ferguson, A. M. N., Irwin, M. J., Ibata, R. A., Lewis, G. F., & Tanvir, N. R. 2002, AJ, 124, 1452
- Freeman (1987) Freeman, K. C. 1987, ARA&A, 25, 603
- Freeman (1990) Freeman, K.C. 1990, in “Formation of the Galactic Halo …. Inside and Out” ASP conf proc 92, Eds H. Morrison and A. Sarajedini
- Frenk & White (1982) Frenk, C. S. & White, S. D. M. 1982, MNRAS, 198, 173
- Friel (1995) Friel, E.D. 1995, ARA&A, 33, 381
- Halliday, Carter, & Jackson (1999) Halliday, C., Carter, D., & Jackson, Z. C. 1999, Bulletin of the American Astronomical Society, 31, 1549
- Harris (1996) Harris, W. E. 1996, AJ, 112, 1487
- Huchra (1993) Huchra, J. 1993, in “The Globular Cluster-Galaxy Connection”, ASP conf series 48, eds G. Smith and J. Brodie
- Huchra, Brodie, & Kent (1991) Huchra, J. P., Brodie, J. P., & Kent, S. M. 1991, ApJ, 370, 495
- Hurley-Keller et al. (2003) Hurley-Keller, D., Morrison, H.L., Harding, P. and Jacoby, G. 2003, in preparation.
- Hurt et al. (2000) Hurt, R. L., Jarrett, T. H., Kirkpatrick, J. D., Cutri, R. M., Schneider, S. E., Skrutskie, M., & van Driel, W. 2000, AJ, 120, 1876
- Ibata et al. (2001) Ibata, R., Irwin, M., Lewis, G., Ferguson, A. M. N., & Tanvir, N. 2001, Nature, 412, 49
- Jenkins & Binney (1990) Jenkins, A. & Binney, J. 1990, MNRAS, 245, 305
- Kent (1989) Kent, S. M. 1989, AJ, 97, 1614.
- Kent, Dame, & Fazio (1991) Kent, S. M., Dame, T. M., & Fazio, G. 1991, ApJ, 378, 131
- Kinman (1959) Kinman, T. D. 1959, MNRAS, 119, 559
- Kissler-Patig et al. (1999) Kissler-Patig, M., Ashman, K. M., Zepf, S. E., & Freeman, K. C. 1999, AJ, 118, 197
- Knox, Hawkins, & Hambly (1999) Knox, R. A., Hawkins, M. R. S., & Hambly, N. C. 1999, MNRAS, 306, 736
- Kormendy (1988) Kormendy, J. 1988, ApJ, 325, 128
- Labbe et al. (2003) Labbe, I. et al. 2003, astro-ph/0306062
- Larson (1976) Larson, R. B. 1976, MNRAS, 176, 31
- Leggett, Ruiz, & Bergeron (1998) Leggett, S. K., Ruiz, M. T., & Bergeron, P. 1998, ApJ, 497, 294
- Loinard, Allen, & Lequeux (1995) Loinard, L., Allen, R. J., & Lequeux, J. 1995, A&A, 301, 68
- Loinard et al. (1999) Loinard, L., Dame, T. M., Heyer, M. H., Lequeux, J., & Thaddeus, P. 1999, A&A, 351, 1087
- Mateo (1998) Mateo, M. L. 1998, ARA&A, 36, 435
- Magrini et al. (2003) L. Magrini, L.,Corradi, R.L.M.,Greimel, R., Leisy, P., Lennon, D.J., Mampaso, A., Perinotto, M, Pollacco, D., Walsh, J., Walton, N. and Zijlstra, A. 2003, A&A, in press, astro-ph/0305105
- Morrison (1999) Morrison, H. L. 1999, ASP Conf. Ser. 165: The Third Stromlo Symposium: The Galactic Halo, 174
- Morrison, Boroson, & Harding (1994) Morrison, H. L., Boroson, T. A., & Harding, P. 1994, AJ, 108, 1191
- Mould & Kristian (1986) Mould, J. & Kristian, J. 1986, ApJ, 305, 591
- McElroy (1983) McElroy, D. B. 1983, ApJ, 270, 485
- Minniti (1995) Minniti, D. 1995, AJ, 109, 1663
- Perrett et al. (2002) Perrett, K. M., Bridges, T. J., Hanes, D. A., Irwin, M. J., Brodie, J. P., Carter, D., Huchra, J. P., & Watson, F. G. 2002, AJ, 123, 2490
- Peterson et al. (2003) Peterson, R. C., Carney, B. W., Dorman, B., Green, E. M., Landsman, W., Liebert, J., O’Connell, R. W., & Rood, R. T. 2003, ApJ, 588, 299
- Prada Moroni & Straniero (2002) Prada Moroni, P. G. & Straniero, O. 2002, ApJ, 581, 585
- Pritchet & van den Bergh (1994) Pritchet, C. J. & van den Bergh, S. 1994, AJ, 107, 1730.
- Quinn & Goodman (1986) Quinn, P. J. & Goodman, J. 1986, ApJ, 309, 472
- Rao et al. (2003) Rao, S., Nestor, D., Turnshek, D., Lane W., Monier, E. and Bergeron, J. 2003, preprint, astro-ph/0211297
- Rich et al. (1996) Rich, R. M. Mighell, K. J., Freedman, W. L., & Neill, J. D. 1996, AJ, 111, 768.
- Sackett et al. (1994) Sackett, P. D., Morrison, H. L., Harding, P., & Boroson, T. A. 1994, Nature, 370, 441
- Sarajedini & Van Duyne (2001) Sarajedini, A. & Van Duyne, J. 2001, AJ, 122, 2444
- Sargent et al. (1977) Sargent, W. L. W., Kowal, C. T., Hartwick, F. D. A., & van den Bergh, S. 1977, AJ, 82, 947
- Schommer et al. (1991) Schommer, R. A., Christian, C. A., Caldwell, N., Bothun, G. D., & Huchra, J. 1991, AJ, 101, 873
- Silk & Wyse (1993) Silk, J. & Wyse, R. F. G. 1993, Phys. Rep., 231, 295
- Spitzer & Schwarzschild (1951) Spitzer, L. J. & Schwarzschild, M. 1951, ApJ, 114, 385
- Spitzer & Schwarzschild (1953) Spitzer, L. J. & Schwarzschild, M. 1953, ApJ, 118, 106
- Shapley et al. (2003) Shapley, A. E., Steidel, C. C., Pettini, M., & Adelberger, K. L. 2003, ApJ, 588, 65
- Steidel et al. (1996) Steidel, C. C., Giavalisco, M., Pettini, M., Dickinson, M., & Adelberger, K. L. 1996, ApJ, 462, L17
- Olszewski, Suntzeff, & Mateo (1996) Olszewski, E. W., Suntzeff, N. B., & Mateo, M. 1996, ARA&A, 34, 511
- van Dokkum & Stanford (2001) van Dokkum, P. G. & Stanford, S. A. 2001, ApJ, 562, L35
- van der Kruit & Searle (1981a) van der Kruit, P. C. & Searle, L. 1981, A&A, 95, 105.
- van der Kruit & Searle (1981b) van der Kruit, P. C. & Searle, L. 1981, A&A, 95, 116
- Vetes̆nik (1962) Vetes̆nik, M. 1962, BAC, 13, 180
- Vogt et al. (1996) Vogt, N. P., Forbes, D. A., Phillips, A. C., Gronwall, C., Faber, S. M., Illingworth, G. D., & Koo, D. C. 1996, ApJ, 465, L15
- Walker, Mihos, & Hernquist (1996) Walker, I. R., Mihos, J. C., & Hernquist, L. 1996, ApJ, 460, 121
- Walterbos & Kennicutt (1988) Walterbos, R. A. M. & Kennicutt, R. C. 1988, A&A, 198, 61
- Zinn (1985) Zinn, R. 1985, ApJ, 293, 424