A Wide Field Hubble Space Telescope Study of the Cluster Cl0024+1654 at II: The Cluster Mass Distribution
Abstract
We present a comprehensive lensing analysis of the rich cluster Cl0024+1654 (z=0.395) based on panoramic sparse-sampled imaging conducted with the WFPC2 and STIS cameras on board the Hubble Space Telescope. By comparing higher fidelity signals in the limited STIS data with the wider field data available from WFPC2, we demonstrate an ability to detect reliably weak lensing signals to a cluster radius of 5 Mpc where the mean shear is around 1%. This enables us to study the distribution of dark matter with respect to the cluster light over an unprecedented range of cluster radius and environments. The projected mass distribution reveals a secondary concentration representing 30% of the overall cluster mass, which is also visible in the distribution of cluster member galaxies. We develop a method to derive the projected mass profile of the main cluster taking into account the influence of the secondary clump. We normalize the mass profile determined from the shear by assuming that background galaxies selected with 2326 have a redshift distribution statistically similar to that inferred photometrically in the Hubble Deep Fields (HDFs). The total mass within the central region of the cluster is independently determined from strong lensing constraints according to a detailed model which utilizes the multiply-imaged arc at . Combining strong and weak constraints, we are able to probe the mass profile of the cluster on scales of 0.1 to 5 Mpc thus providing a valuable test of the universal form proposed by Navarro, Frenk & White (1997) on large scales. A generalized power law fit indicates an asymptotic 3-D density distribution of with 2.4. An isothermal mass profile is therefore strongly rejected, whereas a NFW profile with M200= 6.1 10 M☉ provides a good fit to the lensing data. We isolate cluster members according to their optical-near infrared colors; the red cluster light closely traces the dark matter with a mean mass-to-light ratio of M/LK= 40 M☉/L☉. Similar profiles for mass and light on 1-5 Mpc scales are expected if cluster assembly is largely governed by infalling groups.
1 Introduction
Clusters of galaxies are the largest dynamically bound systems in the Universe and act as effective laboratories for studying the relationship between the distributions of dark and baryonic matter. In currently popular cold dark matter models, numerical simulations predict a universal dark matter profile (Navarro, Frenk, & White 1997, hereafter NFW), which falls off as at large radius with a central cusp whose limiting slope (on scales of 10-100 kpc111We assume 65 km/s/Mpc, , throughout. At the redshift of the cluster corresponds to 5.74 kpc (and to 0.344 Mpc). ) is thought to lie between (NFW) and (Moore et al. 1998, Ghigna et al. 2000).
To date, observational attempts to verify this universal profile in clusters of galaxies have largely been confined to studies on small scales. Evidence for a core might support the idea that the dark matter is warm or self-interacting (Spergel & Steinhardt 2000). Unfortunately, tests of the NFW profile on 10-100 kpc scales are complicated by the fact that baryons are dominant in this regime (Smith et al. 2001). Not only must the baryonic component be removed meticulously via dynamical and photometric data (e.g. Sand et al. 2002), but baryonic collapse during cluster formation presumably also steepens the inner dark matter profile beyond that predicted in dark matter only numerical simulations. The interpretation of the inner mass profile is also likely be confused by projection effects and line-of-sight cluster mergers (Czoske et al. 2002).
On scales from 100 kpc up to a few Mpc, e.g. in massive clusters of galaxies, numerical predictions of the dark matter profile should largely be unaffected by the effects of baryonic collapse. Moreover, the total mass profile on such scales will largely be represented by that of the dark component. Thus baryonic contamination should not be a major issue. The difficulty in observationally verifying the form of the NFW profile on large scales lies in securing robust measurements of the radial profile over a sufficiently wide range in radius. Substructures may also confuse the derived profiles.
Weak gravitational lensing is the most reliable tool for quantifying the total mass distribution over a wide range of cosmic scales (Mellier 1999 and references therein). Studies undertaken with the Wide Field Planetary Camera 2 (WFPC2) on Hubble Space Telescope (HST) have determined cluster mass distributions both in the central parts (Seitz et al. 1996) and on larger scales (1.5 Mpc, Hoekstra et al. 1998, 2002). Accordingly, the prospect of measuring the cluster mass distribution to very large scales via this technique is promising if the various systematic effects can be understood and properly evaluated.
Comparing the relative distribution of the baryonic and dark matter components over a wide range of scales is also of considerable astrophysical interest. In popular dark matter models, the stellar component is expected to be biased with respect to the dark matter depending on its color. Whereas suitably defined cluster core radii as determined from baryonic tracers and lensing studies are now thought to be in general agreement (Allen et al. 2001), less is known about the respective distributions on larger scales (Wilson et al. 2001, Gray et al. 2001, Clowe & Schneider 2001, 2002).
This paper is concerned with a comprehensive attempt to detect weak gravitational lensing signals from the core of a rich cluster out to 5 Mpc (which is roughly three times the virial radius). As the lensing shear at this radius is expected to be very small (1%), such a study is possible only by using the high resolution imaging capabilities of HST. A major goal is to combine the dark matter profile derived from weak lensing on large scales with that inferred from strong lensing constraints in the cluster core in order to test the universal NFW profile over three orders of magnitude in physical scale. The resulting dark matter profile can also be compared with that determined from the cluster galaxies in order to determine whether baryons are biased tracers and to determine the overall mass/light ratio on large scales.
The cluster Cl0024+1654 (=0.395) was selected as the target for this purpose. The core had already been imaged with HST (Smail et al 1996, 1997a) and the redshift of a multiply-imaged arc (=1.675, Broadhurst et al. 2000) tightly constrains the mass within 200 kpc. Comprehensive spectroscopic samples are available to large radii from the studies of Czoske et al. (2001) and Treu et al (2003, Paper I). Furthermore, deep multi-band optical and near-infrared photometry has been made available to aid in tracing the cluster light.
A plan of the paper follows. In 2 we review the HST observations and the associated ground-based observations pertinent to this comparative study of the distribution of cluster mass and light. In 3 we discuss the criteria adopted for selecting the background galaxies whose image shapes, corrected for instrumental distortion, form the basis of the weak lensing analysis. We test the uncertainties in our measured shear by comparing shapes derived from our WFPC2 images with a more limited dataset available from parallel STIS images. We then discuss various means for locating photometrically the cluster galaxies and using their distribution to determine the stellar mass. The lensing analysis conducted on the data is presented in 4. First we examine the 2-D distribution of mass and then discuss the subsequent azimuthally-averaged 1-D radial profiles. We develop a technique for extracting the best fit radial mass distribution of the dominant cluster component, normalized with strong lensing constraints in the cluster core. In 5, we compare the mass and light distribution over 0.1-5 Mpc scales, and our principal conclusions are summarized in 6.
2 Observations
2.1 Hubble Space Telescope Data
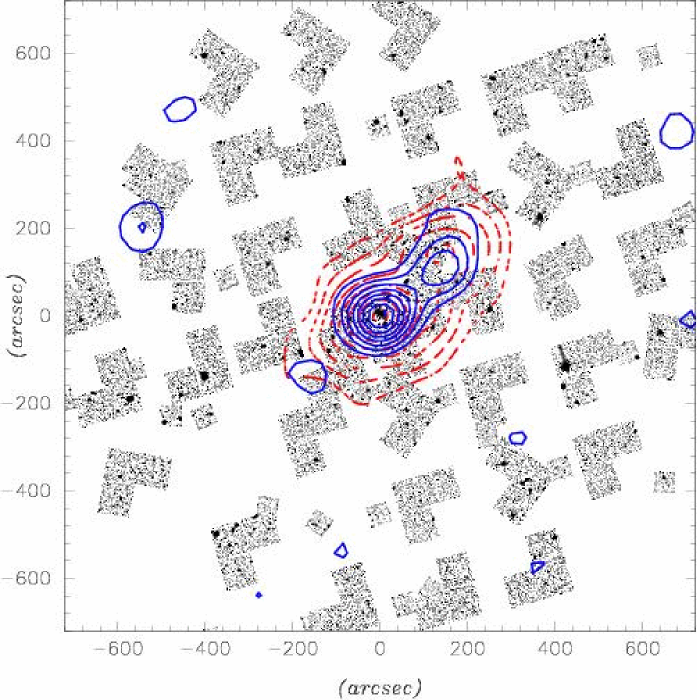
In order to measure reliably the weak lensing signal over the required range in cluster radius, a large mosaic of 38 independent WFPC2/F814W and associated STIS/CCD50CLR images was obtained through a substantial HST GO campaign (PI: R. Ellis, ID # 8559). A fully-sampled mosaic of WFPC2 images across a 10 10 Mpc field would have been prohibitively expensive in HST time. Accordingly, as the principal goal is to measure the radial shear profile to 5 Mpc, a dilute pattern of pointings was considered adequate. As discussed in Treu et al. (2003, Paper I), the original WFPC2 field centers and orientations were carefully selected, both to avoid bright stars and to maximize the utility of the independent parallel STIS images whose overlap with WFPC2 would assist with calibration of the shear signal. Unfortunately, due to scheduling constraints the field orientations were later left unconstrained in order to ensure rapid execution of the program. The final mosaic is depicted in Figure 1. The reduction of the WFPC2 imaging data and generation of an astrometric solution and photometric catalog are discussed in considerable detail by Treu et al. (2003, Paper I) to which the interested reader is referred. The 38 parallel STIS images, each covering 5151 arcsec, were reduced within iraf using techniques similar to those employed for WFPC2, with the exception that sub-pixel sampling was not implemented. A photometric catalog was generated using the SExtractor package (Bertin & Arnouts 1996) and, to match the STIS characteristics, a detection threshold of 10 contiguous pixels above the 1.5–/pixel isophote was used. The principle utility of the STIS data lies in verifying, with somewhat higher fidelity, the weak shear at various points across the cluster. Although the total area sampled by STIS is only arcmin2 (respectively 171 arcmin2 for WFPC2), the surface density of background sources is somewhat higher 94 arcmin-2 (respectively 83 for WFPC2) and the improved image sampling leads to more reliable ellipticities within our adopted magnitude limit (see §3.1). The filling factor resulting from our sparse sampled strategy is 100% in the inner 50 arcsec, falling to an average of 45% in the 100-400 arcsec annulus and to 35% in the 400-700 arcsec annulus.
2.2 Ground-Based Data
Ground-based data is used in this study to both locate cluster members via their broad-band colors and to determine the associated stellar mass using near-infrared luminosities. Optical data of Cl00241654 was taken with the 3.6m Canada France Hawaii telescope (CFHT, see Paper I) using CFHT 12K camera (Cuillandre et al. 2000) in and (Czoske et al. 2001, 2002, 2003). The data reduction is described in Czoske et al. (2003).
A series of wide-field near-infrared images of Cl 00241654 were taken on October 29–30 2002 using the newly-commissioned WIRC-2K 20482048 HgCdTe infrared camera (Eikenberry et al. 2002) at the prime focus of the Hale 5.1m. These data map a area around the cluster center. The mosaic comprises nine pointings arranged in a grid, each encompassing a field. The total integration time per grid position was 1.1–ksec. These data were reduced using standard iraf tasks to dark subtract, linearize, flat field using a local sky median, integer pixel align and co-add the individual frames to remove defects and cosmic ray events. The median seeing on the final reduced frames is FWHM where the uncertainty represents the rms variation between fields.
Science observations were interspersed with observations of standards from the UKIRT list (Hawarden et al. 2001). Zero-points derived from these data do not vary with airmass and time of observation by more than mags. We also exploited the small overlaps between adjacent fields in our mosaic to compare independent photometry of objects in the overlap regions. This exercise confirms that the relative calibration of the 9 WIRC fields is accurate to mags.
We analyzed our near-infrared mosaic with the SExtractor package (Bertin & Arnouts 1996). All objects with isophotal areas in excess of 5 pixels (0.3 arcsec2) at the isophote ( pixel-1) were selected. Sources lying close to the diffraction spikes of bright stars and within of the edge of the field of view were removed. Monte Carlo simulations determined the completeness limits of these catalogs. Scaled artificial point source that match the seeing were inserted at random positions in the –band mosaic and examined using the same SExtractor configuration. The 80% point source completeness limit (roughly equivalent to a 5– detection limit) was determined to be .
All images (HST and ground based) were registered to the astrometry of Czoske et al. (2001) and Treu et al. (2003) which is based on the USNO-A2.0 catalog. In this way the entire photometric (and spectroscopic) dataset is on a unique and well-defined world coordinate system.
3 Selection of Galaxy Catalogs
We now use the data discussed in 2 to construct a robust sample of background galaxies whose shapes will permit the weak lensing analysis, and a list of cluster members defined from the ground-based photometry, from which the stellar mass and cluster light distribution can be determined.
3.1 Background Sample and PSF Correction
A master catalog was compiled from the photometric catalog presented by Treu et al. (2003, Paper I) limited at =26, and the STIS catalogue described in 2.1. To facilitate comparisons between the STIS and WFPC2 data, we arbitrarily aligned the photometric zero points of the STIS data (taken with no filter) so that objects both seen in WFPC2 and STIS have, on average, similar observed magnitudes.
To construct the background sample catalogue, we first considered all galaxies with . The =23 limit corresponds to +3.7m, more than a magnitude fainter than the point at which cluster contamination becomes significant. We then removed: (i) all objects closer than 10 pixels from the WFPC2/STIS detector borders, (ii) all objects where the adjacent sky background is 0.5 magnitude brighter than the mode on that WFPC2/STIS chip, and (iii) spurious detection near saturated stars. This removed most spurious detections as well as those contaminated by a bright object or border effects. Within the adopted magnitude range the total surface densities for the WFPC2 and STIS photometric catalogs were 48.5 arcmin-2 and 58.2 arcmin-2 respectively.

To determine the instrumental PSF distortion and circularization for the WFPC2 and STIS images, we located and fitted all (non saturated) stellar images using a 2-D Gaussian with the im2shape software developed by Bridle et al. (2002, 2003). Unlike other direct methods such as that implemented in imcat (Kaiser 2000), im2shape is a Bayesian method in which the galaxy and PSF stars are modeled as a sum of 2 elliptical Gaussians, and the predicted image pixel intensities are directly compared to those observed as proposed by Kuijken (1998). im2shape pays particular attention to the computation of uncertainties on the measured ellipticities, which can then be taken into account while investigating the mass distribution. In order to evaluate the model parameter uncertainties im2shape uses the Markov-Chain Monte Carlo (MCMC) sampling method (e.g. MacKay 2001). im2shape has been extensively checked with simulation and it appears to be very robust (Bridle et al. 2003). In practice, the first step is to determine the shape of the PSF stars, which then will be used to determine the shape of the faint galaxies to be used to measure the shear distortion of the cluster. As there are on average 3.3 stars per WFPC2 chip and 1.2 per STIS chip, stellar images were stacked according to their relative position on each chip in order to derive the mean distortion map across the detectors shown in Figure 2. This WFPC2 distortion map agrees well with that produced independently by Rhodes et al. (2000), see also Hoekstra et al. (1998).
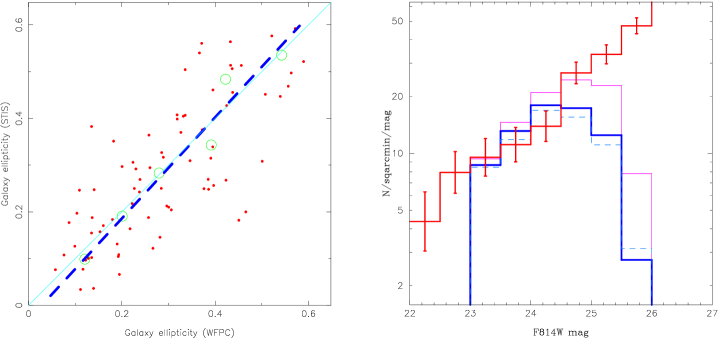
The PSF anisotropies derived from stars for both WFPC2 and STIS data are then used in Bridle et al’s im2shape package to correct background galaxies for distortion and circularization. This correction is applied by fitting each image with a simulated elliptical galaxy model, of shape , convolved with the observed PSF at that point. The ellipticity distribution, , required to fit the observed shapes in this manner has a dispersion 0.25. An important verification of the analysis is a satisfactory comparison of the corrected ellipticities for those faint 2326 galaxies sampled by both STIS and WFPC2 (Figure 3) and a similar intrinsic distribution for the background galaxies regardless of the imaging camera used.
An advantageous feature of the im2shape software is that it gives a direct error estimate of each measured ellipticity . This is useful in determining which galaxies are used in the shear measurements. The ellipticity error correlates more strongly with size and ellipticity than magnitude. The error distribution is slightly better, as expected, for the STIS data. Applying a limiting error criterion of 0.2, we recover 33.2 galaxies arcmin-2 on the WFPC2 data and 45.5 arcmin-2 on the STIS data.
By selecting galaxies according to the precision of their measured shape, the background galaxy catalog departs from a strictly magnitude limited form and this departure is important in determining the likely redshift distribution . The extent to which our selection criteria are equivalent to a pure magnitude limited can be gauged by comparing the counts in the final catalog with those derived on blank fields. Noting earlier discussions of a similar nature in Paper I, for this purpose we chose counts in the HDF South (Casertano et al. 2000, Figure 3). Our shape-restricted 2326 sample is broadly equivalent, in effective surface density, to a 25.2 sample. In practice, of course, there will be departures between for our sample and that for a strict 25.2 sample. The extent of the departure from a magnitude limited sample was discussed in the context of photometric redshifts by Hoekstra et al. (2000) who deduced only a 6% lowering in the derived mean e.g. that appropriate for a strict magnitude limited sample, a factor determined by weighting the individual photometric redshifts according to the associated shape error. Given there will be uncertainties in the photometric redshifts which cannot be reliably estimated, we deduce that, at our effective magnitude limit of 25.2, the mean redshift is (based on photometric redshift determination of the HDFs) where this uncertainty includes the effects discussed by Hoekstra et al. (2000).
3.2 Cluster Light
The principal utility of the optical and near-infrared photometry discussed in 2.2 is to identify galaxies whose optical-near infrared colors indicate they are cluster members. Once identified, the infrared luminosities of these galaxies can be used to trace the established stellar mass (Brinchmann & Ellis 2000).
Using the astrometric optical and near infrared catalog, , , and colors were determined for all sources using a –diameter aperture on seeing matched frames. A color-magnitude diagram for various optical/near-infrared color combinations was inspected and the red cluster sequence was recognizable in each case. At , the redshift of Cl 00241654, the 4000–Å break of the evolved cluster galaxy population lies just red-ward of the observed –band. We thus expect the color to be more sensitive than other optical/near-infrared colors available to us when selecting likely members (Figure 4).

To select likely members, we first performed a bi-weight fit to the versus color magnitude relation for all galaxies within a radius of of the cluster center down to , a region where field contamination is small. We then used the resulting fit to adopt the selection criterion: , where is the observed color of a galaxy and is the color of the red cluster sequence at the –band magnitude of each galaxy obtained from the fit above. We also applied a cut in –band magnitude of . Galaxies redder than this selection are likely at higher redshifts and bluer objects will be foreground galaxies or star-forming cluster members.
The limits mag and mag were chosen after reference to the extensive spectroscopic catalog (Paper I). In selecting these limits we considered the “completeness”, which we defined as the fraction of spectroscopically-confirmed cluster members that are photometrically selected by a given set of color-selection criteria, and the “purity”, defined as the fraction of photometrically-selected galaxies that have been spectroscopically identified and lie within of the nominal cluster redshift. These quantities are plotted as a function of the location of the red and blue cuts in Figure 5 where the greater sensitivity of the blue cut is evident. Our final color cuts are consistent with an completeness limit and a purity level of approximately . We also tested our adoption of as the optimum color for this purpose by repeating these experiments using the , and data. The results are very similar in all four colors. However at a fixed completeness of , as expected, the –based catalog suffers less contamination (i.e. higher purity) than the other colors by –15%.
Field contamination in both the -limited sample, and the red sequence sample additionally constrained by color, can be determined from the source density in independent offset fields available to us (K.Bundy priv. commun.). However, this leads to an over-correction for the periphery because, as discussed in Paper I, Cl0024+1654 is surrounded by a region of density slightly lower than average. To avoid a negative density, we therefore applied an in situ background correction using the source density measured in the 45 Mpc annulus around Cl0024. The statistical uncertainty associated with this correction, and the bias associated with members lying within this outer annulus, is included in the subsequent analysis.

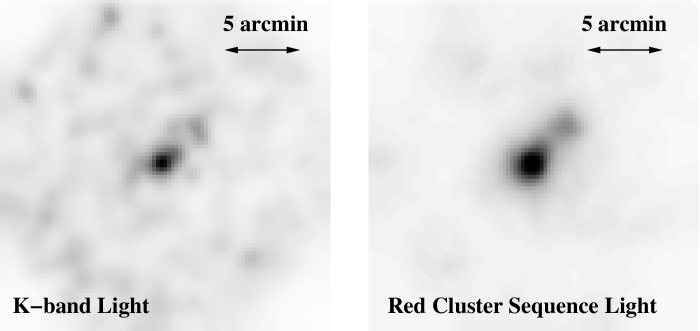
From the -limited and red sequence galaxy catalogs, we computed projected luminosity maps for both the raw -band light, limited to 2400 galaxies brighter than 19, and for 500 red sequence objects selected by the procedure discussed above (Figure 6). Both maps are adaptively smoothed by selecting areas containing 15 suitable galaxies and dividing their integrated light by the corresponding area. Although the mean smoothing radius in the peripheral regions is 200 arcsec (1.15 Mpc at =0.4), in the core where the density is higher, the smoothing scale approaches 30 arcsec (170 kpc).
This comparison should give a good indication of the effects of projection and how to distinguish these from genuine substructure in the cluster. The raw image should be sensitive to structures projected over all redshift whereas the latter should preferentially locate stellar mass broadly within the redshift range 0.3-0.5. The most conspicuous feature in both of these distributions (other than the cluster core) is a secondary concentration of light 3 arcmin to the NW of center, coincident with the secondary concentration of spectroscopically confirmed cluster members shown in Paper I. The band luminosity ratio of the two clumps, measured within a 0.5 Mpc diameter circular aperture is 3.6:1. We will continue the discussion of this secondary clump in 5, in the context of our mass model. The periphery of the cluster does reveal minor fluctuations in the image but as color selection satisfactory removes these, it would seem the bulk of the stellar mass in Cl0024+1654 is reasonably smooth and well-behaved.
4 Lensing Analyses
4.1 Two-Dimensional Mass Distribution
Our goal is to characterize the radial dependence of total mass for Cl0024+1654 in the context of popular theoretical realizations and to compare the mass profile with that determined for the stellar light. Figure 6 suggests that cluster substructure may complicate our analysis. Accordingly we proceed as follows. We first apply a non-parametric method to derive a projected 2-D mass map from our weak shear data. Although our WFPC2 sampling strategy was designed to yield a 1-D mass profile in the cluster periphery, to an intermediate radius, the signal/noise is adequate for a 2D mass reconstruction. We then explore a multi-component weak lensing analysis where we then incorporate strong lensing constraints derived from multiple images in the cluster core.
Since the gravitational shear is not a local measure of the projected mass density, deriving a mass distribution requires an inversion process (Mellier 1999). From the distortion-corrected samples discussed in we computed the associated projected mass map using the maximum entropy LensEnt method discussed in Bridle et al. (1999, see also Marshall et al. 2002). In order to maintain more than 20 galaxies in each (non-empty) cell, we defined a reconstruction grid of 6464 cells, each 30 arcsec on a side. With this parameterisation, we infer from the data an intrinsic correlation function width, which reflects the size of the smallest detectable feature on the mass map, is 100 arcsec (570 kpc).
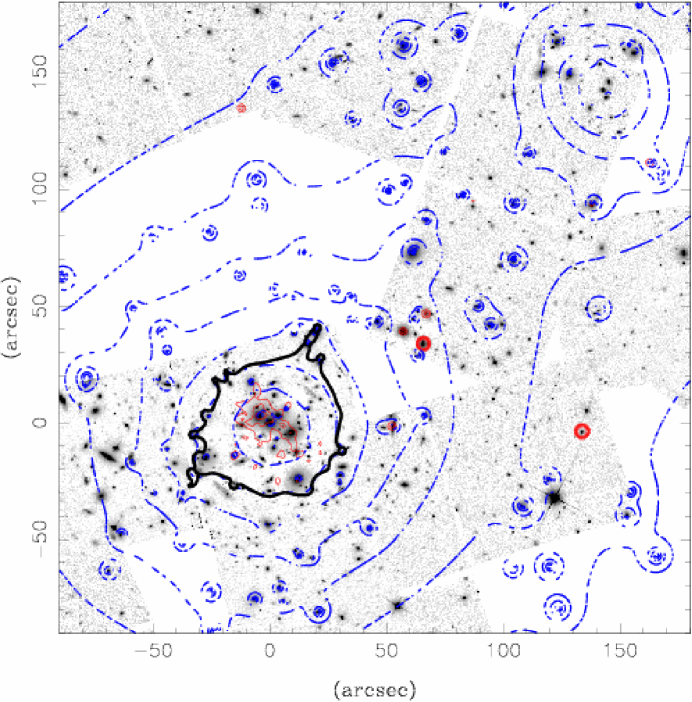
The resulting 2-D mass distribution is overplotted as a contour map on Figure 1. It bears a striking resemblance to that already derived for the infrared and red sequence light (Figure 6). In addition to resolving the main cluster core which is roughly centered on the peak of X-ray emission determined from the recent Chandra image (Tozzi et al., in preparation), a weaker second mass peak is detected with 10 significance 1 Mpc NW of the cluster center (this substructure has already been identified in the work of Czoske et al. 2002). The location of this peak closely matches that seen in Figure 6. Moreover its relative prominence to the main clump is similar to that deduced from the -band light; indeed within a 0.5 Mpc diameter, it corresponds to 25-30% of the mass of the main clump in the same aperture. Thus the two mass clumps have similar M/L ratio. Other features in Figure 1 have a significance of less than 3.
4.2 Weak Shear Profile
The 2-D mass distribution becomes very noisy beyond a radius of 400 arcsec (2.3 Mpc) and to make further progress it is necessary to azimuthally average the shear and consider only the 1-D profile. In order to derive a radial profile, it is first necessary to pinpoint precisely the cluster center. From the 2D weak lensing mass map and the strong lensing model of the multiple image system in this cluster (4.4) we determine the center of mass to be at: 00h26m35.53s, 17d09m38.0s. The brightest cluster galaxy lies only 5 arcsec N of this location. Our adopted center is also within 5 arcsec SW of the peak of Chandra emission (superimposed on a luminous cluster galaxy).
Galaxy shapes were azimuthally-averaged within circular bins within fixed radial intervals. Figure 7 shows the resulting radial shear profile as measured from the STIS+WFPC2 mean tangential ellipticity . A smooth trend is seen in both the overall trend and the dispersion, suggesting that the secondary substructure identified in Figures 1 and 6 has only a minor effect on the overall profile.
Cluster shear has not hitherto been detected to radii where the
shear is 1%, so it is important to demonstrate the
reliability of our detections. Figure 7 compares the outermost
signals in the two final radial bins from 400800 arcsec as
measured independently using WFPC2 and STIS data alone which are seen to
agree. In combination the shear within these two bins is
significant at the 4 level.
Figure 7 also includes the absolute value of the radial shear
(equivalent to the standard 45 degree test).
In the case of ideal data with one single mass component,
the reduced radial shear profile should average to zero, with statistical
errors inversely proportional to the square root of the number galaxies
used to compute the shear.
The absolute value of the reduced radial shear thus provides an
upper limit to the systematic error on the reduced tangential shear and the
contribution from additional mass clumps. Figure 7 summarizes the results:
1) except for the last bin of the WFPC2 data,
the tangential shear is well above the radial shear,
demonstrating minimal interference from systematic errors.
2) the STIS data have a lower systematic error compared to the WFPC2
data, as expected.

These measurements can be compared to previous weak lensing analysis of this cluster. In a truly pioneering paper, Bonnet et al. (1994) reported on the detection of shear to a radius 2.3 Mpc from the center of Cl0024+1654 using panoramic imaging taken with the Canada France Hawaii Telescope. The shear observed by HST at 2 Mpc (350 arcsec) is 2% which is half the value quoted in Bonnet et al. (1994). The discrepancy most likely lies in over-correction of the ground-based PSF circularization applied by Bonnet et al. (1994) which was done at a time where PSF corrections were just being experimented.
4.3 Deriving Mass Profiles: Weak Shear
We face two complications in deriving a self-consistent radial mass profile. First, within a certain cluster radius, contamination of the background sample selected with 2326 by cluster galaxies will increasingly dilute the shear signal. This can be seen via the flattened slope of the shear profile at radii 100 arcsec (575 kpc) in Figure 7. Secondly, cluster substructures will deflect the radial profile from that appropriate to fitting a single component. Fortunately, both effects are straightforward to account for.
In the case of shear dilution from cluster members, the radial surface density of background galaxies gives a good measure of the likely contamination as a true background population should show no strong radial variation. Assuming that the contaminating population has random orientation and an ellipticity distribution similar to that of the genuine background population, we can easily correct the measured shear via:
| (1) |
where is the mean number density of galaxies in our background galaxy catalogue and represents its variation as a function of cluster radius.
Concerning the effect of a major substructure, such as the secondary mass concentration 3 arcmin NW of the center detected in Figures 1 and 6, we choose to permit new components in addition to the main cluster mass distribution in our 2-D model fitting, assuming (for convenience) all share similar mass profiles whose universal form we consider to be the wanted unknown. We then compute analytically the reduced shear field arising from a linear combination (by mass) of such clumps.
Assuming a Gaussian intrinsic ellipticity distribution and Gaussian image shape measurement errors the log-likelihood becomes:
| (2) |
where is the number of clump fitted, and and are the sets of parameters for the profile of each clump.
We now turn to determine the most likely mass profile based on the weak shear data. Our analysis is based on two physically-motivated profiles which we fit to the Cl0024+1654 data. First, we consider the universal profile predicted by hierarchical clustering models (NFW). The dark matter density is described by:
| (3) |
where is a scale radius, is a characteristic (dimensionless) density, and is the critical density for closure. Those parameters can be expressed in terms of M200 and (NFW). The former is defined as the mass enclosed within (the radius of the sphere enclosing an average density ) and gives a characteristic cluster scale mass which is popular with numerical simulations. The latter is the concentration parameter defined as .
Second, we consider a Singular Isothermal Sphere (SIS):
| (4) |
The SIS is not only a good approximation of the total mass density profile of spiral (van Albada & Sancisi 1986) and early-type galaxies (Treu & Koopmans 2002) but has also been justified as physically meaningful for the outcome of the gravitational collapse of a system under certain conditions (Fillmore & Goldreich 1984).
In addition to these 2 physically motivated models, we also consider the more general question of the form of the mass distribution of large scales by considering a ‘cored power law’ (CPL) fit with projected mass distribution:
| (5) |
where is the slope of the density mass profile at large radius, and with the core radius. The mass profile of a cored isothermal sphere (CIS) corresponds to .
Our rationale is to determine, for an adopted mass profile, the likelihood of substructure as revealed by the weak lensing data. To explore the effect of mass concentrations, other than the main cluster, we permitted the centroids to vary with uniform prior probability across the full angular range of our data. A Markov-Chain Monte-Carlo algorithm (e.g. Gilks, Richardson & Spiegelhalter 1996) was used to draw samples from the resultant posterior density . This technique allows efficient characterization of this distribution, lending itself to straightforward marginalization permitting realistic and accurate estimation of parameter uncertainties.
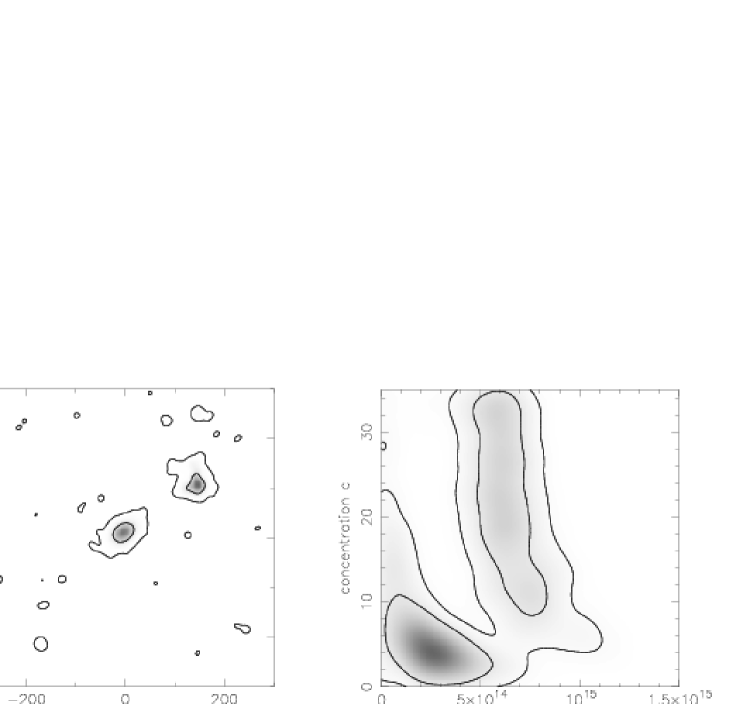
Figure 8 shows the result of this multi-component shear fitting technique in the context of an assumed NFW profile. As expected from Figure 1, only two significant components are necessary to match the data and the second clump contains about 30% of the total mass, as measured via (Figure 8). The Bayesian evidence applied with a uniform prior on in the range 0:2 gives the ratio
| (6) |
which acts as a measure of the significance of substructure (i.e. a two-clump model is a 25 times more likely representation of the data than a single component). The evidence for a three clump model is no greater within the numerical precision.
The above analysis therefore permits us to accommodate, in a fairly rigorous way, substructure in Cl0024+1654 within the context of a universal density profile. We now turn our attention to the key question of determining the most accurate form for this universal profile, fixing the number of components in the lens model to . The probabilities for the different models (CPL, SIS, CIS) relative to the NFW model are summarized in Table 2. Both the SIS and CIS model were found to be less likely given our weak lensing data than the CPL and NFW models.
To underline the importance of the radial extent of the data, we repeated the above analysis using only galaxies within 420 arcsec from the cluster centre. We find the ratio to be 2.5 (as opposed to 15 for the full dataset; Table 2). The respective model parameter inferences are unaffected, and their derived uncertainties only marginally larger. We thus conclude that the full dynamical range is needed to distinguish between an NFW and an SIS mass density profile.
Due to sparse sampling, at radii larger than 200 arcsec it would be easy to miss a small mass concentration lying in the area not covered by the HST data. We investigate a three clump model, where the 2 first clump priors are set to the posteriors of the 2 clump model. The position of the third clump was allowed to be anywhere within 600 arcsec from the center. We found that to retain the goodness of fit, the third clump would have to have smaller than M⊙ at 90% confidence (this mass correspond to half the mass of the second clump). Furthermore, adding a third clump with such a low mass was found not to affect significantly the best fitting parameters of the 2 main clumps. Beyond 600 arcsec, the coverage is too sparse to be able to put meaningful constraints on any putative mass clumps– any such objects would indeed remain either undetected or confused with noise. We conclude that apart the 2 main clumps, there is no other significant massive clump that can be detected by the data. Would such clump exists, its low mass would not change our conclusions.
4.4 Deriving Mass Profiles: Incorporating Strong Lensing
We now combine constraints on the outer (100 arcsec - 575kpc) mass profile from weak lensing signals with those available from strong lensing constraints (Smail et al. 1996) based on modeling the location of the multiply-imaged arc whose spectroscopic redshift is known (=1.675, Broadhurst et al. 2000).
The multiply-imaged arcs are on average 27 arcsec (155 kpc) from the cluster center and enables us to place a tight prior on the Einstein radius of the central clump. A second clump of the same circularly-symmetric NFW profile is added, and the posterior probability distribution of the parameters investigated. We constrained the location of the central clump (1 arcsec) and permitted the second clump to lie anywhere within a radius of 5 arcmin from the cluster center.
The evidence can be used as a powerful tool to probe the consistency of the results arising from the weak and strong lensing datasets by comparing that determined here with that inferred for the same model parameters from the weak lensing data alone. The tight strong lensing prior reduces the volume of the parameter space in the region of high likelihood, making the weak lensing data more probable, indicating very good consistency between the two datasets.
Figure 9 shows the two-dimensional probability distributions of the concentration and for the NFW model. Note that including the strong lensing information improves both the mass and concentration precision for both clumps (by comparison of Figure 8 and 9). The NFW concentration parameter of the main clump is of particular interest. Numerically-simulated clusters typically have concentrations of around 5, somewhat smaller than that inferred for the main clump of Cl0024+1654 (Table 1).
The probabilities for the different models (CPL, SIS, CIS) relative to the NFW model are summarized in Table 2. Both the SIS and CIS model appear to be less probable given the data by a factor of some tens of thousands. Compared with the NFW profile, the CPL has a slightly greater likelihood, but this advantage is partially a result of the added flexibility arising from the extra parameter. Indeed, the evidence values computed for each model are identical within the uncertainties; we consider there to be no reason to reject the NFW fit. However, the CPL provides an estimate of the slope at large radii: we calculate a 95% bound of (for the main clump) which translates to an asymptotic logarithmic slopes of the 3-D density distribution of where as .
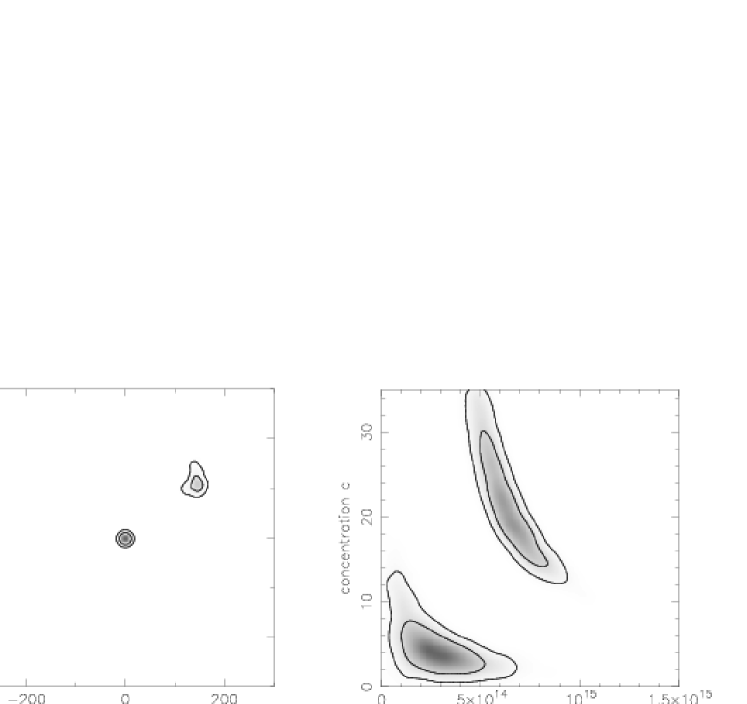
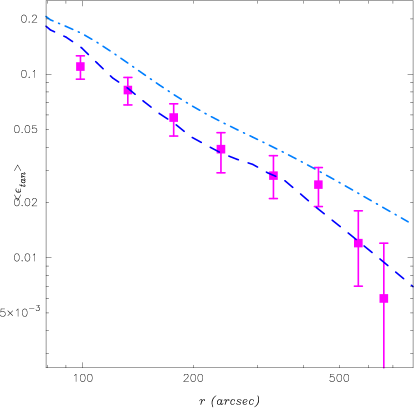
Figure 10 summarizes the above analysis in the context of the observed reduced tangential shear profile, reproduced using the combined WFPC2+STIS data from Figure 7. The NFW fit for the two components in Table 1 accurately represent the data whereas the isothermal model is clearly discrepant and can not account for the low shear value at large radius as well as fitting the strong lensing constraints.
The only way to fit both the strong lensing and weak shear constraints with a SIS model would be to significantly modify the redshift distribution of the background galaxies. Specifically, in order to satisfy both set of constraints with an SIS, we need to increase the critical density by 40%. This corresponds to shifting the source plane to a mean redshift of 0.72 inconsistent with our knowledge of the redshift distribution of faint galaxies.
Finally, following the techniques demonstrated in Kneib et al. (1996), we investigated the detailed mass distribution of the inner cluster including the contribution from galaxy halos (Figure 11). The mass distribution arising from galaxy halos were determined using scaling relations discussed in Natarajan et al. (1998) based on the -selected sample discussed in 3.2. Within these assumptions both the NFW and CPL 2-clump mass models were investigated. In both cases the exact position and shape of the 5-image multiple can be reproduced, with a slight preference for the CPL model. The contribution by mass from galaxy halos is similar to that found in previous cluster analyses (Natarajan et al. 1998, 2002). The results and the variation of this galaxy halo components with radius will be discussed in a further paper in the series (Natarajan et al. 2003).
5 Comparing Mass and Light
Given the similarity of the substructure revealed in Cl0024+1654 from the distribution of infrared light (Figure 6) and that inferred by weak lensing (Figures 1 and 11), we now compare the overall radial profiles of mass and light. This is important to understand the degree to which cluster masses might be under/over-estimated, for example if the DM profile was assumed to follow an SIS model. Our unique data gives the first indications, based on lensing, of the extent to which mass and light trace each other on scales above 1 Mpc.
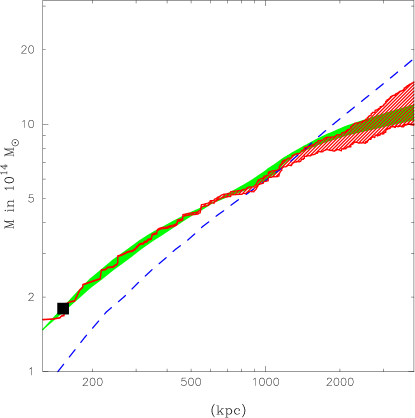
The integrated mass profile derived from the NFW components listed in Table 1 can be compared with that of stellar light from the -limited and red-sequence maps presented in Figure 6. The enclosed total mass from the lensing analysis and the stellar mass determined from the field-corrected -limited catalog (3.2) track each other very closely (Figure 12).
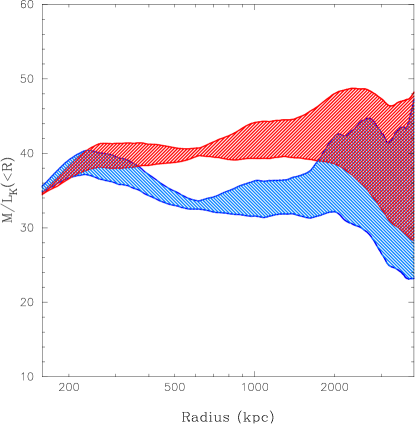
The extent to which the mass/light ratio of the enclosed population might vary with radius is examined for both the -limited and red sequence populations in Figure 13. Here, the uncertainties represent those associated with both background subtraction and sampling statistics. Given the uncertainties, there is little convincing evidence for any segregation of mass and light. The mean (restframe corrected) for the red sequence galaxies is 40 and that for the overall cluster galaxies (at the radius).
Assuming that the total luminosity of the cluster evolves according to passive evolution of an old stellar population222Computed using a 8 and 12 Gyrs single stellar population synthetic spectrum from Bruzual & Charlot 1993, GISSEL96 version, with Salpeter IMF., this corresponds to ( for the red galaxies) at 0. For comparison, at large radii in the Coma cluster is found to be from dynamical analysis (Geller, Diaferio & Kurtz 1999; Rines et al. 2001). Thus passive evolution of an old stellar populations appears to be consistent with the evolution of the cluster light as a whole (e.g. Hoekstra et al. 2002). A similar conclusion follows from the mass to light ratio derived in the observed band (=165 ) which compares favorably with previous weak lensing studies of the central regions (1 Mpc) of clusters at intermediate redshift (e.g. Lombardi et al. 2000; Hoekstra et al. 2002).
A constant mass-to-light ratio out to large radii was determined by Carlberg, Yee & Ellingson (1997) using dynamical analysis of an ensemble cluster from the CNOC dataset (see also van der Marel et al. 2000). Our result extends and reinforces this result given that our lensing analyses are independent of the dynamical state of the cluster, do not involve assumptions on the orbital properties of members nor on the dynamical equilibrium of infalling galaxies (e.g. discussion in Biviano & Girardi 2003). Furthermore, obtaining this result for a single cluster (as opposed to an ensemble cluster) ensures that the constancy of is not an artifact of the scaling laws adopted in constructing the ensemble.
From ground based data using the WFI 2.2m telescope, Clowe & Schneider (2001, 2002) studied the mass profile of three massive clusters out to . Based on a weak lensing analysis only, they found that they cannot clearly distinguish between NFW and isothermal; however, in the case of Abell 1689, they did not reach any good agreement between the strong and weak lensing constraints. In a recent paper, Gavazzi et al. (2003) investigate the mass distribution around the cluster MS2137-03 (see also Sand et al. 2002). They combine strong and weak lensing measurements up to 900 kpc. Although their methodology is similar to ours, their data do not discriminate between the isothermal and NFW slopes at large radii.
An extension of such weak lensing analysis to the field was conducted using ground-based data by Wilson et al. (2001). They correlated the 2-D distribution of selected red galaxies with shear-based mass reconstructions for 6 blank fields. Their azimuthally-averaged luminosity auto-correlation and mass/luminosity cross-correlations lead them to infer similar profiles for mass and light on scales 0.3-1 Mpc.
6 Discussion
In this paper we have used the exquisite image quality of HST to derive the first radial profile of total mass in a cluster to a projected radius of 5 Mpc combining strong and weak lensing constraints. Our two main results are that (i) the large scale distribution of total mass in Cl0024+1654 over 0.15 Mpc is reasonably well fit by NFW-like profile (as opposed to the shallower isothermal form) and (ii) the mean mass/light ratio of the cluster is constant over the same large dynamic range.
As far as the first result is concerned, the steep decline of the mass density profile at large radii is an important constraint on theories of cluster formation. Whereas at small radii the presence of baryons and limited resolution of numerical simulations (Smith et al. 2001, Sand et al. 2002, Power et al. 2003) complicate comparisons between data and models, these difficulties are negligible at large radii. Our measured mass density profile declines as with , clearly rejecting models that predict near-isothermal slopes (see e.g. Ryden 1988). On large scales, our results are in good agreement with the value obtained by NFW.
Using a strategy very similar to that adopted here utilizing a strong lensing constraint based on the multiply-imaged arc, Bonnet et al. (1994) however inferred a projected mass density for a cored power law fit corresponding to 1.7-2.2. We argue that the difference in the results comes from the discrepant value in the shear estimate computed by Bonnet et al. (1994), possibly resulting from over-correction of the ground-based circularization of the faint galaxies, as discussed in section § 4.
In considering how to make further progress in this area with future cluster studies with HST, two issues are particularly relevant. Firstly, our detection of substructure at radii Mpc was limited in this study by the sparse-sampling strategy adopted with WFPC2. While efficient in tracing the cluster profile to very large radius, it would be prudent in future studies to undertake full sampling. Secondly, there is an evident need to extend such studies to further examples. Cl0024+1654 was found via optical searches which rely on maximizing the contrast of galaxies against the background. As often is the case, the most detailed analyses reveal more complex structures than those foreseen in the earlier data. For many years the high velocity dispersion was thought to be inconsistent with the cluster’s lensing power and the X-ray luminosity. Czoske et al. (2001) resolved this discrepancy by discovering a secondary peak (referred to as component B) in the velocity distribution at as opposed to of the main peak (A). The galaxies in component B are not spatially concentrated but rather spread across the cluster field. This led Czoske et al. (2002) to interpret the velocity distribution as the result of a head-on collision between a moderate group and the cluster proper.
Our lensing analysis likewise reveals an additional and significantly massive secondary substructure Mpc NW of the cluster center, spatially coincident with the secondary clump of members of peak A in our spectroscopic catalog (Czoske et al. 2002, Treu et al. 2003). Such substructure is likely to correlate with the high fraction of blue galaxies in a cluster and consequently, as an optically-selected system, Cl0024+1654 may not be completely representative of massive “relaxed” systems at this redshift, in particular, unlike other relaxed clusters such as MS2137-23 (Sand et al. 2002, Gavazzi et al. 2003) there is no central cD in Cl0024+1654, but three giant elliptical galaxies. Hence, Cl0024+1654 might not be the best cluster to measure the shape of a Universal mass profile, as suggested by fit of “merging-free” clusters in numerical simulations. Thus, understanding the mass profile in other more relaxed clusters would test whether our results can be generalized.
As far as the second result is concerned, the constant mass-to-light ratio at large radii is remarkable both in terms of galaxy population and in terms of relative spatial distributions of luminous and dark matter. In terms of galaxy population, this result adds support to the picture of very gentle changes in the morphological mix and star formation histories over the 0.1-5 Mpc range (Paper I). In terms of relative spatial distribution of luminous and dark matter, their remarkable similarity and the implied constant ratio with radius, implies that dark matter and baryons are very tightly coupled over a remarkable range of environmental densities. Although at first surprising in term of simplistic pictures of “biased” galaxy formation, the conclusion strengthens one deduced completely independently in Paper I (Treu et al. 2003). Clusters are primarily growing via the accretion of groups, not individual galaxies. Accordingly, the peripheral mass/light ratio represents not that of an individual galaxy entering the cluster as an isolated “test particle” but rather as part of a bound system whose overall mass/light ratio is fairly high (30-40). The eradication of these smaller substructures, which most likely occurs at and within the virial radius (Paper I) should thus largely preserve the relative distributions of mass and light on the scales which we can probe via weak lensing.
References
- (1) Allen, S.W. et al. 2001, MNRAS, 328, 327.
- (2) Bertin, E. & Arnouts, S. 1996, Astron. Astrophys., 117, 393.
- (3) Biviano, A. & Girardi, M. 2003, Astrophys. J., 585, 205.
- (4) Bonnet, H. et al. 1994, Astrophys. J. Lett., 427, L83.
- (5) Bridle, S. et al. 1998, MNRAS, 299, 895.
- (6) Bridle, S., Kneib, J.-P., Bardeau, S., Gull, S.F., 2002, in ’The shapes of Galaxies and their Dark Halos’ Yale Cosmology workshop, 28-30 May 2001, World Scientific.
- (7) Bridle, S. et al. 2003, in preparation.
- (8) Brinchmann, J. & Ellis, R.S. 2000, Astrophys. J. Lett., 536, L77.
- (9) Broadhurst, T.J. et al. 2000, Astrophys. J., 534, L15.
- (10) Bruzual, G. & Charlot, S. 1993, Astrophys. J. 405, 538.
- (11) Carlberg, R. et al. 1999, Astrophys. J., 516, 552.
- (12) Casertano, S. et al. 2000, Astron. J. 120, 2747.
- Clowe & Schneider (2002) Clowe, D. & Schneider, P. 2002, A&A, 395, 385
- Clowe & Schneider (2001) Clowe, D. & Schneider, P. 2001, A&A, 379, 384
- (15) Cuillandre, J-C. et al. 2000, in Optical and IR Telescope Instrumentation and Detectors, eds. Iye, M. & Moorwood, A., S.P.I.E., 4008, 1010.
- (16) Czoske, O. et al. 2001, Astron. & Astrophys, 372, 391.
- (17) Czoske, O. et al. 2002, Astron. & Astrophys., 386, 31.
- (18) Dubinsky, J. & Carlberg, R. 1991, Astrophys. J., 378, 496.
- (19) Eikenberry, S. et al. 2002, S.P.I.E. in press.
- (20) Fillmore, & Goldreich, P. 1984, Astrophys. J., 281, 1.
- (21) Gavazzi, R., Fort, B., Mellier, Y., Pelló, R., & Dantel-Fort, M. 2003, A&A, 403, 11
- (22) Ghigna, S. et al. 2000, Astrophys. J. 544, 616.
- (23) Geller, M., Diafero, A. & Kurtz, M. 1999, Astrophys. J. 517, 23.
- (24) Gilks, W.R., Richardson, S., Spiegelhalter, D.J., 1996, ”Markov-Chain Monte-Carlo In Practice”, Cambridge: Chapman and Hall
- (25) Gray, M. et al. 2001, MNRAS, 325, 101
- (26) Hawarden, T. et al. 2001, MNRAS, 325, 563.
- (27) Hoekstra, H. et al. 1998, Astrophys. J., 532, 88.
- (28) Hoekstra, H., Franx, M., Kuijken, K., & van Dokkum, P. G. 2002, MNRAS, 333, 911
- (29) Kaiser, N., 2000, ApJ, 537, 555
- (30) Kuijken, K., 1999, Astron. & Astrophys., 352, 355
- (31) Kneib J.-P. et al. 1996, Astrophys. J. 471, 643.
- (32) Lombardi, et al. 2000, Astron. Astrophys., 363, 401.
- (33) MacKay, D.J.C, 2001, Information Theory, Inference, and Learning Algorithms, Cambridge University press. http://wol.ra.phy.cam.ac.uk/mackay/
- (34) Marshall, P. et al. 2002, MNRAS 335, 1037.
- (35) Mellier, Y. 1999, Ann. Rev. Astron. Astrophys., 37, 127.
- (36) Moore, B. et al. 1998, Astrophys. J. 499, L5.
- (37) Natarajan, P., Kneib, J., & Smail, I. 2002, ApJ, 580, L11
- (38) Natarajan, P., Kneib, J., Smail, I., & Ellis, R. S. 1998, ApJ, 499, 600
- (39) Navarro, J., Frenk, C.S. & White, S.D.M. 1997, Astrophys. J. 490, 493 (NFW).
- (40) Rhodes, J. et al. 2000, Astrophys. J., 536, 79.
- (41) Rines, K. et al. 2001, Astrophys. J., 561, 41.
- (42) Ryden, B. 1998, in Galaxy Dynamics, eds. Merritt, D. et al. ASP Conference Series 182.
- (43) Sand, D., Treu, T. & Ellis, R.S. 2002, Astrophys. J. Lett., 574, L129.
- (44) Seitz, C. et al. 1996, Astron. Astrophys., 314, 707.
- (45) Smail, I. et al. 1996, Astrophys. J., 469, 508.
- (46) Smail, I. et al. 1997, Astrophys. J., 479, 70.
- Smith et al. (2001) Smith, G. P., Kneib, J., Ebeling, H., Czoske, O., & Smail, I. 2001, ApJ, 552, 493
- (48) Spergel, D. & Steinhardt, P. 2000, Phys. Rev. Lett. 84, 3760.
- (49) Treu, T. & Koopmans, L. 2002, Astrophys. J., 575, 87.
- (50) Treu, T. et al. 2003, in press (Paper I, astro-ph/0303267).
- (51) van Albada, T.S. & Sancisi, R. 1986, Phil. Trans. Roy. Soc. (A), 320, 447.
- (52) van der Marel, R. et al. 2000, Astron. J., 119, 2038.
- (53) White, S.D.M. et al. 1993, Nature, 366, 429.
- (54) Wilson, G. et al. 2001, Astrophys. J., 556, 601.
| Clump | ||||||
|---|---|---|---|---|---|---|
| (arcsec) | (arcsec) | () | (Mpc) | (kpc) | ||
| 1 | ||||||
| 2 |
Note. — Parameters for the two component NFW lens model described in the text, where we have applied priors to the central clump to represent the strong lensing Einstein radius constraint; the median sample values is used as a best estimate. Uncertainties are 68% probability symmetric intervals.
| Type of Constraints | |||
|---|---|---|---|
| Weak Lensing Only | 2.5 | 1/15 | 1/400 |
| Strong+Weak Lensing | 2.5 | 1/9 000 | 1/1 800 000 |
Note. — Posterior probability of 2-component lens models relative to the NFW model. Given the weak lensing data alone (first line), CPL and NFW are almost equally probable while the SIS and CIS models are much less probable. The second line corresponds to the situation where strong lensing constraints are included as well. Now SIS and CIS models are disfavored to a far greater degree. Note that in both cases CPL is formally more probable than NFW, although not at a significant level, given the additional free parameter.