THE AGE OF THE OLDEST STARS IN THE LOCAL GALACTIC DISK FROM HIPPARCOS PARALLAXES OF G AND K SUBGIANTS111Part review of the history of the discovery of subgiants and part new results from Hipparcos.
Abstract
We review the history of the discovery of field subgiant stars, the role that they played in the development of the early understanding of stellar evolution, and their importance in the age dating of the Galactic disk. We use the cataloged data from the Hipparcos satellite in this latter capacity.
Based on Hipparcos parallaxes with relative accuracies of , the absolute magnitude of the lower envelope of the nearly horizontal subgiant sequence for field stars in the H-R diagram for colors between 0.85 and 1.05 is measured to be . New stellar evolutionary tracks calculated for metal abundances in the range [Fe/H] are fitted to the main-sequence, subgiant, and giant-star distributions in the Hipparcos H-R diagram. Isochrones for [Fe/H] provide the best fit to the reddest giants between , as well as to the envelope of the reddest main-sequence stars at . The red edge of the densest part of the distribution of field giants is, however, most readily matched by isochrones having [Fe/H] . Such high metal abundances are evidently confirmed by the spectroscopically observed high metallicity (between [Fe/H] and ) of the old thick disk Galactic cluster, NGC 6791, whose color-magnitude diagram can be made to fit either of these red boundaries by adopting suitable values for the reddening and distance modulus (from within the observed ranges of uncertainties of these quantities).
The age of the field stars in the solar neighborhood is found to be Gyr (or Gyr if the stellar models allow for the effects of diffusive processes) by fitting the theoretical isochrones for [Fe/H] to the lower envelope of the Hipparcos subgiants. However, this age is a function of metallicity. The models show a dependence of at for metallicities between 0.00 and . The same grid of isochrones yields ages, in turn, of Gyr, Gyr, and 7.5 to 10 Gyr (depending on the assumed reddening) for the old Galactic clusters M 67, NGC 188, and NGC 6791 using metal abundances, distance moduli, and reddenings adopted in the text. Although the distance (and hence age) of NGC 6791 is somewhat uncertain, the ages of both the Galactic disk in the solar neighborhood and of NGC 6791 are, nevertheless, likely between 3 and 5 Gyr younger than the oldest halo globular clusters, which have ages of Gyr. The conclusion is the same as that reached earlier by Liu & Chaboyer (2000, ApJ, 544, 818), who used Hipparcos parallax stars that were mainly near the main-sequence turn-off rather than at the lower bound of the subgiant luminosity that we determine here. The most significant results are (1) the supermetallicity of the oldest local disk stars, and (2) the large age difference between the most metal-poor component of the halo and the thick and thin disk in the solar neighborhood, confirming Liu & Chaboyer. These facts are undoubtedly related and pose again the problem of the proper scenario for the timing of events in the formation of the halo and the Galactic disk in the solar neighborhood.
1 Introduction
1.1 The Discovery of Subgiants (1922-1935)
The class of stars of intermediate luminosity between the main sequence and the giants in the H-R diagram with absolute magnitudes between and and spectral types from G0 to K3 were first called “subgiants” by Stromberg (1930). The existence of such stars had been hinted at, but not emphasized nor commented upon, in the first papers on Mount Wilson spectroscopic parallaxes by Adams & Joy (1917, 1920) shortly after the discovery by Adams & Kohschutter (1914) of the spectroscopic method to determine absolute magnitudes. Adams (1916) had continued to develop the method after Kohlschutter had departed Pasadena in 1914 to return to Germany at the start of the first World War. (He was captured at Gibralter by the British and retained until the end of that war).
Adams & Joy (1917) published a major catalog of Mount Wilson spectroscopic parallaxes of 500 stars as the first of many papers on results from the method. Later, they (Adams & Joy 1920) could summarize the distribution of spectroscopic luminosities of 1646 stars in a matrix table of numbers of stars as a function of absolute magnitude from to and spectral types from A to M. The continuum (without any break) of the luminosity distribution between the main sequence and the giants is well seen in their matrix table for stars between spectral types G0 and K3, although the number of such “subgiants” was very small. Furthermore, there were no subgiants later than K3, where the main-sequence and giant branches are totally separated.
Luyten (1922) had also found the same continuum between the giants and dwarfs for types between F3 and K3 in a similar matrix table that he had constructed from his independent method of “reduced proper motion absolute magnitudes” using 4446 stars with known proper motions. The dwarf and giant sequences were again separated for types later than K3. However, an apparently detached sequence of subgiants was shown in the final H-R diagram made from 4179 Mount Wilson spectroscopic parallaxes by Adams et al. (1935). They called explicit attention to this separated sequence, attributing its discovery to Stromberg (1932), in writing
The existence of a group of stars of types G and K somewhat fainter than normal giants has been indicated by the statistical studies of Stromberg (1932). Although these stars may not be entirely separated from the giants in absolute magnitude, there is some spectroscopic evidence to support the suggestion.
The result from the totality of this early work between 1917 and 1935 is that there are no stars later than K3 that have intermediate absolute magnitudes between the dwarf and giant sequences. Such subgiants do exist for spectral types between G0 and K3. Their intermediate luminosities eventually turned out to be a crucial clue for an understanding of “observational stellar evolution”, but no notion of the value of the clue was evident until the color-magnitude diagrams (CMDs) of old star clusters were obtained in the early-to-mid 1950s.
1.2 The Enigma of the Subgiants in Russell’s 1914-1930 Picture of Stellar Evolution
A detached subgiant sequence did not fit the simple picture of stellar evolution that Russell (1914) had proposed in 1914, had modified, and had elaborated in many places throughout the 1920s (cf. Russell 1925a, Russell 1925b; Russell, Dugan, & Stewart 1927). In Russell’s picture, stars are born as giants at absolute magnitude near , whereupon they contract, staying at about the same absolute luminosity as they become hotter until they reach the main sequence. At that point, contraction was said to stop.222They were assumed to become “rigid” because, it was said, the perfect gas law would no longer hold and further contraction would be prevented. However, Eddington (1924, 1926) disproved the rigidity hypothesis by showing that the perfect gas law was valid everywhere in the star because the high temperatures caused near complete ionization even in the deep interior. But before Eddington’s disproof of “rigidity”, Russell averred that the stars upon reaching the main sequence by contraction would then evolve down the main sequence, becoming cooler as they progressed through the dwarf spectral types from A to M. The scheme was not contradicted by the data in the H-R diagram as long as there were only two sequences as an “inverted 7” of giants and dwarfs. However, a separate subgiant group could not be fit into this scheme. Hence, when they were discovered in the 1920s, the subgiants became a major problem to Russell’s evolutionary proposals.
The identification of the subgiants in the early H-R diagrams of Adams & Joy depended almost entirely on the reliability of the spectroscopic parallaxes. (Luyten’s development using proper motions, did not, of course, depend on spectroscopy). In attempts to save the Russell evolution model, doubts were sometimes expressed whether “subgiants” actually exist, either “detached” from both the main and giant sequences, or as a continuum between spectral types G0 and K3. Could the spectroscopic absolute magnitude method fail for the subgiants?
However, by 1936, all doubts had been removed when reliable trigonometric parallaxes of members of the group became available. Of particular importance were the five stars with the largest direct parallaxes; namely, Her (trigonometric parallax of , type G5), Eri (, type K0), Aql (, type G8), Cep (, type K1), and Cep (, type K0). The trigonometric parallaxes were precise enough to prove beyond a doubt the intermediate luminosities of these stars in the H-R diagram.
Morgan (1937) at Yerkes had also begun to see the same spectral differences between subgiants and the normal giants and dwarfs that had been discovered at Mount Wilson for Aql, Cep, and Cep. By the time of the publication of the Yerkes MKK atlas (Morgan, Keenan, & Kellman 1943), these three stars, plus Eri and Her, became the prototypes of the subgiants in the Yerkes spectral classification work. Such stars were then renamed as class IV stars in the Yerkes system. Although there was now no question of the reality of their intermediate luminosities, the question remained even into the 1950s as to what was the evolutionary significance of the subgiants.
1.3 The Importance of the Open Cluster M 67
The solution came when CMDs of star clusters reached the main sequences, first in the globular clusters M 92 and M 3 (Arp, Baum, & Sandage 1952, 1953; Sandage 1953), and then for the old open clusters M 67 in 1955 and NGC 188 in 1962. Beginning in 1950, one of Walter Baade’s mantras to his two graduate students (Halton Arp and one of the present writers) was “if you want to understand stellar evolution, you must understand the color-magnitude diagram of M 67.” He had agonized over the contradictory aspects of the CMD for that cluster which Shapley (1916) had derived in the third paper of his 1915–1918 cluster series.
Shapley’s M 67 color-magnitude diagram contained a combination of sequences seen separately in globular clusters and in open clusters but never, heretofore, seen together. There was (is) a red-giant branch that is steeper than that of the giants as they were originally defined by Russell and Hertzsprung (now known as “clump” giants, not the “first ascent” giant sequence as that sequence is now defined),333“Giants” in the terminology from the 1910s in Hertzsprung and Russell’s original diagrams, and continuing into the 1960s, were the stars in the H-R diagrams (such as that of Adams et al. 1935) near with spectral types from G0 to early M; they defined a giant sequence. The four Hyades giants were the local prototypes. However, when the CMD from the Hipparcos parallaxes became available (Perryman et al. 1995, their Figure 6), it became immediately obvious that the Hertzsprung and Russell giants are post (i.e., after the first ascent) giant-sequence stars, now called “clump” stars. (The suggestion that the Hertzsprung/Russell giants, especially the four in the Hyades central cluster, are clump stars rather than first-rise giants was made previously on the basis of spectroscopic isotope ratios coupled with theories of nucleosynthesis. However, the Hipparcos CMD provided the definitive proof because the entire clump sequence is directly revealed.) In the post-1960 literature, the “giant branch” is defined as the locus of stars on the “first ascent”, seen best in the evolving sequences of old star clusters. These are the post-main-sequence stars in the hydrogen shell burning phase, before the helium flash at the top of the “first ascent giant branch” and the subsequent descent onto the helium burning “clump” phase. This change in the nomenclature of what were called giants by Hertzsprung, Russell, Adams et al., among others, to what are now named clump stars, is pervasive, separating the terminology before and after 1960. but less steep than that in globular clusters. There also is a bright blue sequence of B and A stars as in the main sequences of the open clusters such as the Pleiades and the Hyades. Because of the simultaneous presence of these two sequences, confusion was general on whether M 67 was a loose globular cluster or an unusual Galactic cluster of Trumpler’s class 2f (Trumpler 1925). [The CMD of M 67 by Becker & Stock (1953) only confused the issue; they misidentified the real main sequence as a continuation of the giant branch with no indication of an identification of subgiants. They called M 67 a loose globular cluster.]
The solution came when the M 67 CMD could be measured to apparent magnitudes as faint as , (Johnson & Sandage 1955). Three magnitudes of the main sequence had been found, showing that it begins only at an absolute magnitude of . Brighter than this, it peals off, connecting with the giant branch through a sequence of stars that are the subgiants. The M 67 subgiant sequence also ties onto the rising brighter giant branch that resembles (although less steep) the giant sequence of the globular clusters that had already been discovered by Shapley (1915) in his second cluster paper. In addition, and nevertheless, the stars in M 67 were later found to have a “normal” solar metallicity (Eggen & Sandage 1964), similar to the five subgiants with large trigonometric parallaxes that define the Yerkes luminosity class IV stars.
Hence, by 1955, the stellar evolution explanation of the M 67 CMD could be given — that stars move off the main sequence as they age. The Schönberg & Chandrasekhar (1942) main-sequence limit had been overcome by a new physical process, invented by M. Schwarzschild (Sandage & Schwarzschild 1952), of hydrogen shell burning after core hydrogen exhaustion. Clearly the cluster M 67 was old, and the luminosity of its nearly level subgiant branch could be used as an age determinant. Any field subgiants whose luminosity could be proved to be fainter than the M 67 sequence would clearly be older than M 67. Hence, when NGC 188 was shown to have an even fainter subgiant branch than M 67 (Sandage 1962b), it was clear that it must be older than M 67, and again, unexpectedly at the time, it also was shown to have a metal abundance close to solar, whatever that was to mean concerning the timing of events in the formation of the thick and thin Galactic disks.
1.4 The 1957 Vatican Conference : Age Dating the Disk
At the time of the Vatican Conference on Stellar Populations (O’Connell 1958), the faintest main-sequence turn-off point for any Population I cluster was that for M 67 at . In addition, the main-sequence turn-offs for the two globular clusters known at that time (M 3 and M 92) were put (incorrectly) at the same luminosity level. The true faintness of their main sequences at a given color, which was the result of their low metallicities, was not yet known or understood (Eggen & Sandage 1959, Sandage & Eggen 1959). Hence, at the Vatican conference, it was widely believed that M 67 and the globular clusters were the same age and that their age closely defined the age of the Galaxy.
It became a major problem at the Conference to confront the luminosities of the three well determined field subgiants Eri (), Her (), and 31 Aql (), all fainter than the M 67, M 3, and M 92 subgiants near . It is still of interest to recall that Schwarzschild (1958) at the conference, despairing over the faintness of these three field subgiants, and further concerned with the fact that these very old field stars have a solar metallicity, stated in a discussion of the color-magnitude diagram of trigonometric stars compared with the M 67 diagram:
It appears that Eri and possibly Her are not abnormal in composition or velocity. If they are older than anything else in the Galaxy, the simple relations [between age, velocity dispersion, and chemical composition] I proposed yesterday would have to be abandoned.
To which Morgan asked:
Would you abandon your simple relation on account of one star?
Schwarzschild replied:
I would need at least three!
One of us (AS) commented that there were at least three (in fact, there were nine) in an H-R diagram for field stars shown earlier at the conference, each with trigonometric parallaxes larger than . The comparison of these nine field subgiants with M 67 had already been made two years earlier by Eggen (1955), and his list was later expanded in Eggen (1957) as was noted by Baade (1958) in one of his papers, also at the Vatican Conference. Eggen (1960) could finally produce a master list of 205 subgiants that have old disk kinematics and between and , many of which were fainter than the M 67 subgiant sequence.
Hence, it had become clear by 1957 that the age of the Galactic disk in the solar neighborhood could be determined from the absolute magnitude of the lower envelope of the subgiant sequence in the H-R diagram, comparing its level with theoretical evolution tracks of different ages. An attempt was made by one of us (AS) in the 1970s (unpublished) to use the method based on the parallax data in the 1952 edition of the Yale Parallax Catalog with its extension in 1963 (Jenkins 1952, 1963), but the parallax errors were too large to permit a solution. Even restricting the sample to distances of 25 parsecs using the 1970 catalog of such stars by Woolley et al. (1970, Figures 1 and 2) was also unsatisfactory because there were too few subgiants in that sample to adequately define the lower envelope.
2 Hipparcos Parallaxes Defining the Lower Subgiant Envelope
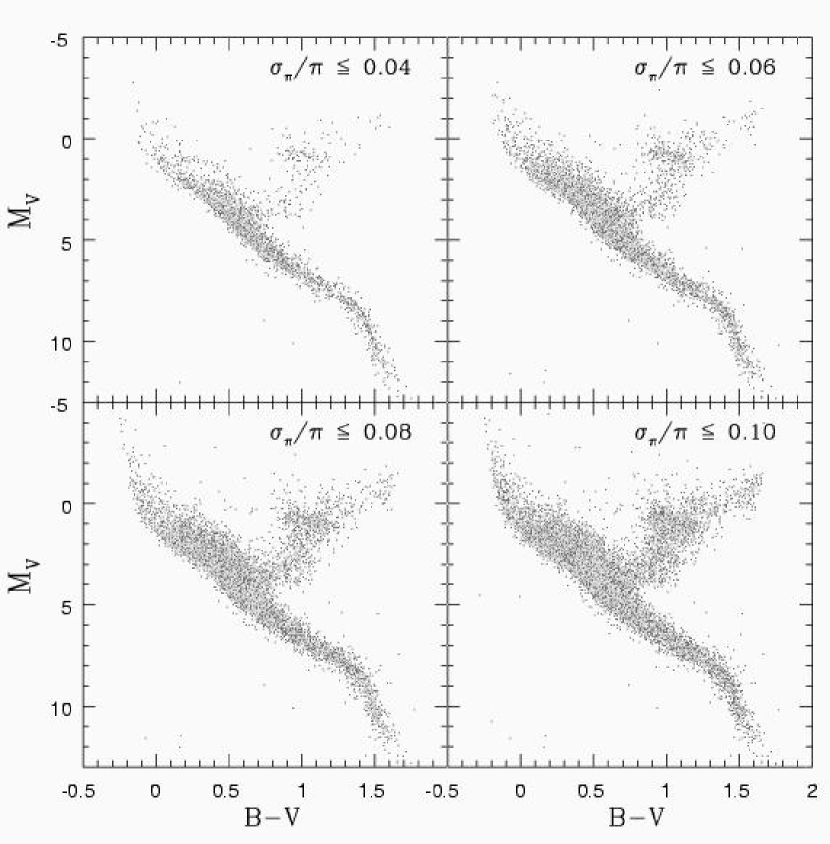
A preliminary solution is now possible using the more accurate and larger number of trigonometric parallaxes from the Hipparcos Catalog. Figure 1 shows the H-R diagram from that catalog (Perryman et al. 1995) using stars that have an rms parallax accuracy of , implying that each star in the sample has an rms magnitude error less than 0.22 mag, and an uncertainty in the color index of mag, ensuring accurate color measurements. Although not of encomic precision, we analyze the data by binning in intervals of between 0.04 and 0.10 to test the sensitivity of the lower envelope position to these various parallax interval errors. Of the many striking features of Figure 1, two of the important ones are the width of the main sequence fainter than , and the width of the upturning giant sequence between and .
It was shown from the earliest observations of globular clusters that the absolute magnitude of the giant branch at a given color (or equivalently, the color of the giant branch at a given absolute magnitude) is a strong function of metallicity (Arp, Baum, & Sandage 1953; Arp 1955; Sandage & Wallerstein 1960). This was eventually quantified by the introduction of the index, which is the color of the giant branch at the level of the horizontal branch (Sandage & Smith 1966). The prediction of such a color-metallicity relation for giants was made even in the earliest model calculations (Hoyle & Schwarzschild 1955; Kippenhahn, Temesvary, & Biermann 1958, summarized by Kinman 1959, his Figure 4). The highest metallicity giant branches are furthest to the red at a given absolute magnitude. Hence, in any composite H-R diagram, stars on the red envelope of a giant branch that has an appreciable width at any given absolute magnitude consists of stars of the highest metallicity in the sample.
The observed widths of the main and giant sequences in Figure 1 show that there must, in fact, be a range of metallicities between [Fe/H] in the Hipparcos sample, based on the new isochrones calculated in §3.
2.1 Determining the Luminosity of the Lower Subgiant Envelope
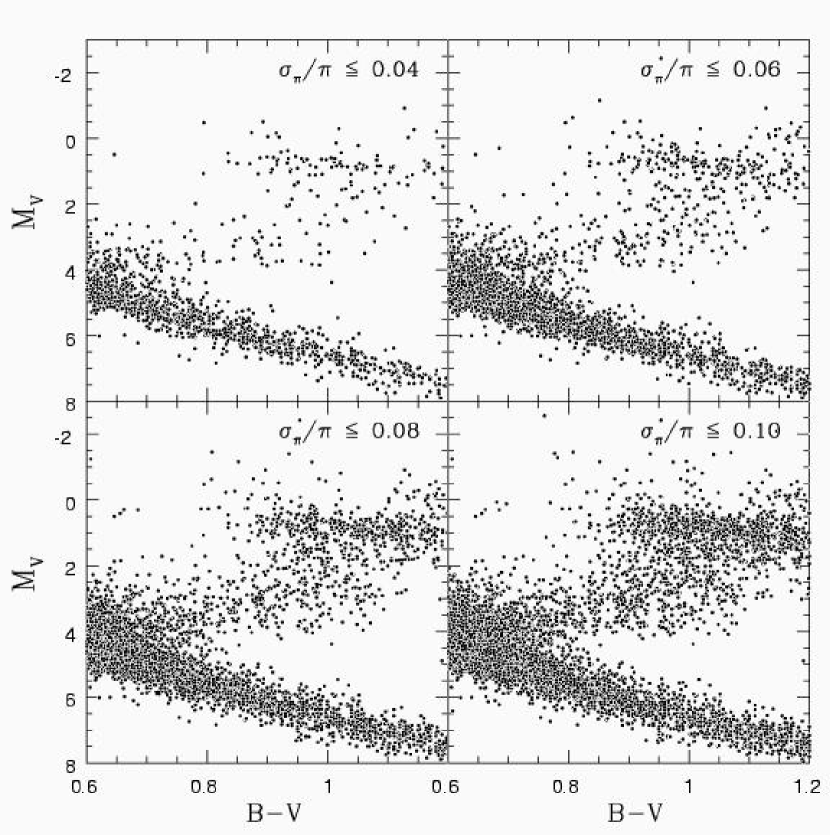
Figure 2 shows enlargements of those regions of Figure 1 that contain the subgiants in the Hipparcos data, binned into four intervals of the relative parallax error. There is a well defined, nearly horizontal, limit to the luminosity distribution of the subgiants in the color range . This limit, seen already by inspection of Figure 2, is near . This is much fainter than the subgiants in M 67 (as shown in §4 of this paper). The limit can be determined more accurately, and its error estimated, by deconvolving the observed distribution of luminosities between the designated color limits by the mean parallax error in the sample.
We divide the data in the subgiant region into two bins of color from to 0.95 and 0.95 to 1.05 (see Table 1). Figure 2 shows that this range encompasses the subgiant envelope with minimum contamination either from the main sequence or the beginning of the luminosity rise at the base of the giant branch starting near . Using all of the stars from the complete Hipparcos catalog that have and mag, we bin the absolute magnitude between of to in steps of 0.1 mag. Figure 3 shows the resulting histograms separately for each color strip, as well as for the combined color range from to 1.05.
There are only 79 stars in this color range with , which is the crucial magnitude interval for determining the lower subgiant limiting magnitude. Consistent with the visual impression from Figure 2, the lower envelope near is confirmed in Figure 3, yet there are too few stars to definitively determine it. However, we can use the data to show that the tail of the distribution fainter than may be due to the parallax error and, therefore, may not be real (but see §2.2 for a caveat, as well as §4 and §5).
In order to test this hypothesis, we have assumed that the true distribution of absolute magnitudes is a step function with a sharp lower envelope cut-off, . We then convolve this distribution with a Gaussian having a standard deviation that corresponds to a magnitude error of 0.139 mag, which is the result of a parallax error of . This is the mean parallax error in the complete distribution of stars having and mag. We allow the cut-off magnitude to vary from 3.9 to 4.2, in intervals of 0.01 mag. The amplitude of the step function is allowed to vary as well. Each model is compared to the original data using a test, and the is minimized to determine the best-fit parameters. The best-fit cut-off magnitude is given by . To derive the 1- error estimate, the amplitude of the step function is fixed and only the single parameter, , is allowed to vary; the values of at then give the 68% confidence interval for this parameter (Press et al. 2002).
Figure 4 shows an expanded version of Figure 3 for and , superimposed by the models, as calculated above, for and the best-fit amplitude of the step function. The contribution of parallax error accounts well for the tail of the observed magnitude distribution at ; however, there are only 25 stars with , which is too small a sample to definitively measure the lower envelope to any better accuracy. To make a definitive measurement will require a factor of 5–10 more stars per magnitude interval fainter than .
2.2 A Caveat
Based on the errors in absolute magnitude derived from their parallax uncertainties, eleven of the 14 stars in the tail of the distribution for fainter than 4.0 (see Figure 4) lie within 1- of our measured cut-off magnitude of , while the remaining three stars lie within 2 to 4- of this cut-off. As a result, we cannot be certain from these data if the tail is due only to parallax errors, or whether there is a small percentage of stars that are actually older than the apparent lower envelope near . We shall see later in §4 and §5 that the subgiants in the old Galactic cluster NGC 6791 may be as much as mag fainter than [if it has and ], in which case its CMD would encompass most of the stars in the tail of the distribution in Figure 4, assuming no parallax error for them. Clearly, a larger sample of parallax stars is necessary for a more complete solution to the question of the reality of the tail.
Furthermore, NGC 6791 may not be the oldest Galactic cluster (Phelps, Janes, & Montgomery 1994). It may be surpassed in age by such open clusters as Berkeley 17 (cf. Janes & Phelps 1994; Friel 1995), though the scatter of the available photometry is still too large to permit precise age determinations for them at this time. Below we use the Hipparcos subgiants (Figure 4) to derive the age of the local Galactic disk, under the assumption that the tail of the distribution is due to parallax error, but with the caveat that this tail may or may not be real.
3 New Evolutionary Tracks Fitted to the Hipparcos Subgiant Lower Envelope
3.1 The Models
New grids of stellar evolutionary tracks for masses between 0.4 and have been computed by VandenBerg, Bergbusch, & Dowler (2003) for metal abundances in the range using the code described by VandenBerg et al. (2000). The assumed helium content in each case was obtained from ; the constant term represents the assumed primordial helium abundance (cf. Peimbert, Peimbert, & Luridiana 2002), and the slope is such that this relation yields the value of required by a Standard Solar Model constructed for . (In order to match the solar , this model also needs for the usual parameter in the mixing-length theory (MLT) of convection: it gives the ratio of the mixing-length to the pressure scale-height. This value has been adopted in all of the model computations.) The Grevesse & Noels (1993) determination of the mix of heavy elements in the Sun has also been assumed. In addition, the relative abundances of the metals have been taken to be independent of — i.e., each considered here assumes [/Fe] , where represents any metal. In this investigation, we make use of the models for , 0.0188, 0.03, and 0.04 which have [m/H] values of , 0.0, and in the direction of increasing . Opacities for these chemical compositions were provided to one of us (DAV) several years ago by F. J. Rogers for the high-temperature regime, and by D. R. Alexander for temperatures below K; they are similar to the opacity data reported by Iglesias & Rogers (1996) and by Alexander & Ferguson (1994), respectively.
The main deficiency of these models is, perhaps, the neglect of diffusive processes (gravitational settling and radiative accelerations), which appear to be important in the Sun (e.g., Turcotte et al. 1998, and references therein). However, in both the Sun (see Brun, Turck-Chièze, & Zahn 1999) and Population II stars (Richard et al. 2002), slow mixing below fully convective surface layers, when they occur, seems to be necessary to improve the agreement with observational constraints. This extra mixing, which is not well understood theoretically, has the effect of inhibiting the diffusive processes in at least the surface layers of stars. To date, only the University of Montreal group (G. Michaud and colleagues; see Richard et al. 2002) have developed a code to treat gravitational settling, radiative accelerations, and (a fairly simple formulation of) turbulent mixing in a self-consistent way. (Our understanding of the efficiency of these processes is clearly still in a state of development.)
The main advantage of the models used here is that they reproduce the CMDs of both open and globular star clusters very well (e.g., Rosvick & VandenBerg 1998; VandenBerg 2000), including those of M 67, NGC 188, and NGC 6791 (see §4). M 67 and NGC 6791 were, in fact, used (in part) to calibrate the color– relations that are used to transpose the models to the observational planes (VandenBerg & Clem 2003). Provided that the assumed properties of these clusters are reasonably realistic, the models may be reliably used to describe the metallicity dependence of main-sequence and red-giant loci of other stellar populations, such as the Hipparcos CMD for field stars. However, it does seem probable that the ages of subgiant-branch stars that are inferred from the models (see below) may be too high by about 6%, given that such an effect is expected from the diffusion of helium and the metals in the deep interiors of stars (see Michaud et al. 2003). This is less than the % reduction predicted for Population II stars (VandenBerg et al. 2002) because of the compensating effects of differences in the solar normalization.
3.2 Comparison of the Calculated Isochrones With the Hipparcos Data
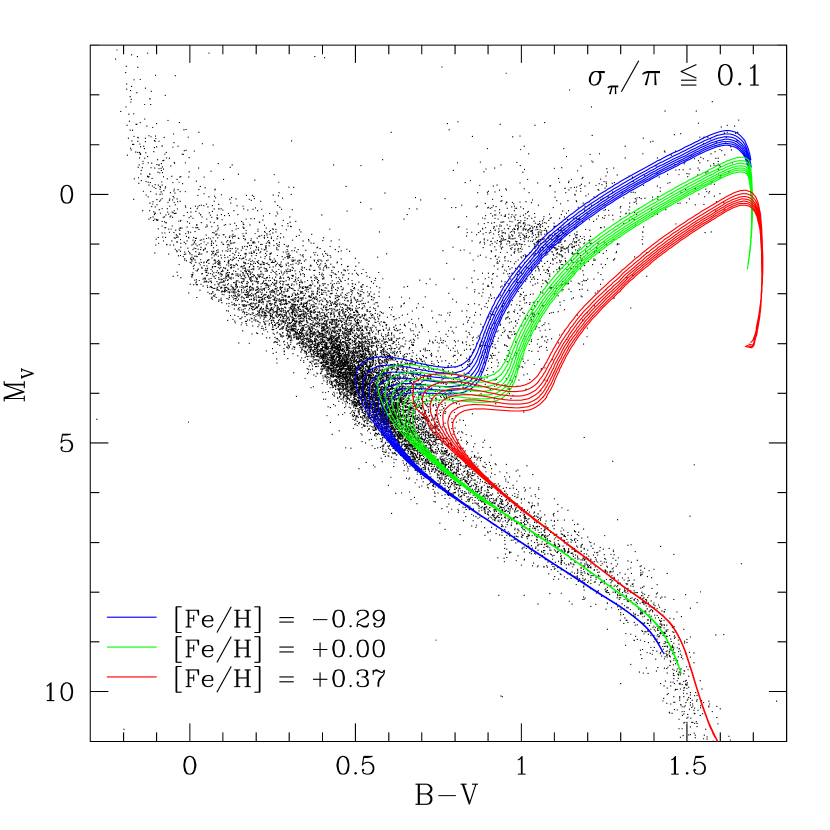
In Figure 5, the calculated isochrones for [Fe/H] , 0.0, and and ages between 6 and 12 Gyr, in steps of 1 Gyr, are superimposed on the complete Hipparcos H-R diagram from Figure 1 using all Hipparcos stars with and mag. The isochrone families are color-coded according to the assumed metallicity. The conclusion, seen simply by inspection, is that only the [Fe/H] metallicity isochrones fit both the reddest main-sequence stars and the reddest giants at any given absolute magnitude.
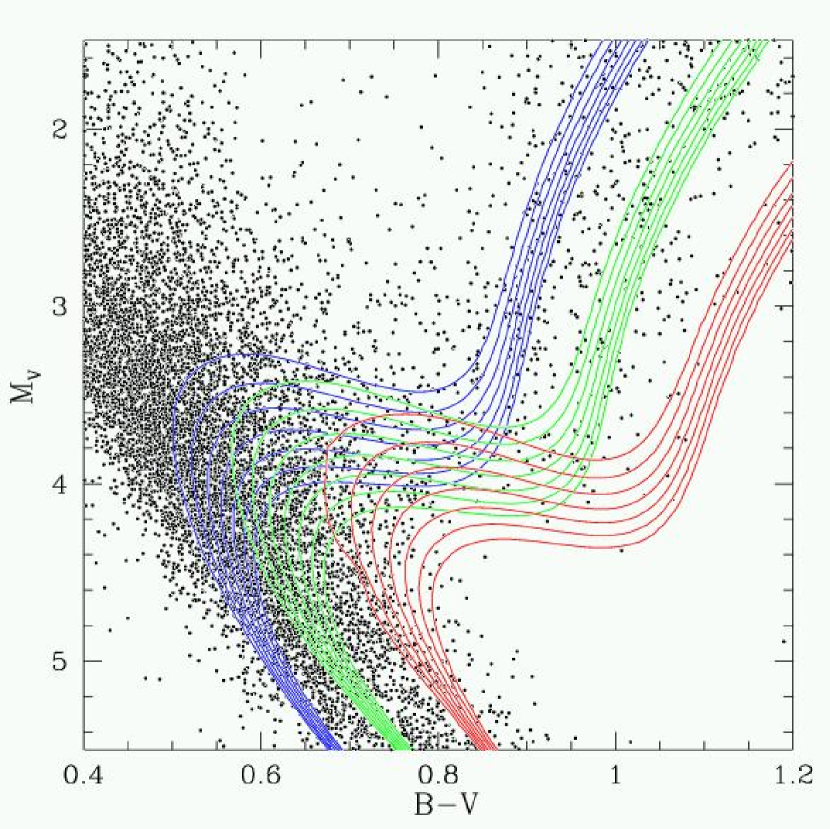
The second conclusion, seen most easily from the expanded H-R diagram in Figure 6, is that an age based on the subgiant envelope is larger than 7 Gyr from the [Fe/H] isochrones for (which is to the red of the subgiant sequences for both the solar and [Fe/H] metallicities). In the color range bluer than 0.90, there is a significant metallicity dependence in the sense that lower metallicites give larger ages at a given level (for details, see §3.3). This is the famous age–metallicity degeneracy. That degeneracy does not occur to the same degree for colors redder than because no subgiants with such red colors exist for [Fe/H] ; i.e., such red subgiants must be super-metal-rich.
Interpolating between the curves in Figure 6 for [Fe/H] and using the derived lower subgiant envelope of gives an age for the oldest field subgiants near 8 Gyr. The interpolation is analyzed in the next section where the metallicity dependence is set out explicitly.
3.3 Ages From the Isochrones and the Hipparcos Data as Functions of Metallicity
Fiducial points on the calculated isochrones in the color and magnitude range of the subgiants are set out in Table 2, interpolated from the models shown in Figure 5. The metallicity dependence of the age at a given absolute magnitude, evident from Figure 6, is plotted in Figure 7 in two representations. The upper panels and the lower left-hand panel show the age as a function of absolute magnitude at three discrete colors on the isochrones, taken from Table 2. The metallicity dependence shown in the upper right-hand panel for between metallicities of 0.00 and is . Thus, at , a subgiant with solar abundances is predicted to be Gyr older than one having [Fe/H] .
The explicit color dependence is shown in the lower right-hand panel of Figure 7, where the plotted curves are the isochrones in the color-magnitude diagram for [Fe/H] . Interpolating in these curves at , the midpoint in color for the data in Figures 3 and 4, gives an age (in Gyr) of for the lower subgiant envelope of .
A caution is that, if some of the Hipparcos stars in Figures 1, 2, 5, and 6 which are on, or near, the subgiant lower envelope with colors bluer than have solar metallicities rather than being super-metal-rich, these stars will have ages of Gyr, showing that further progress with this method will require high-dispersion spectroscopy to determine the [Fe/H] values of stars near the envelope line in this blue overlap color range.
4 Comparison with the H-R Diagrams of M 67, NGC 188, and NGC 6791
4.1 Adopted Fiducial Points for the Color-Magnitude Diagrams
Since the discovery of their antiquity, the three old Galactic clusters M 67, NGC 188, and NGC 6791 have been so extensively studied that a vast literature has developed about them. It is of interest for the present problem to compare their color-magnitude diagrams with the Hipparcos data. This work continues upon the early comparisons to field stars made by Wilson (1976), Sandage (1982, his Figures 4 and 5), and Twarog & Anthony-Twarog (1989, their Figure 7) for M 67 and NGC 188.
We have a wide choice of photometric studies from which to adopt fiducial color-magnitude diagrams for each of the clusters. For the fiducial points in and derived from the observed data, we must adopt values for the reddening and for the apparent modulus. (Recall that the true modulus is not needed; the true absolute magnitude is obtained by combining the observed apparent magnitude with the apparent modulus). Table 3 lists the observed , data that we have adopted for the three clusters. We detail in the following subsections a few of the principal photometric papers that have contributed to the earlier literature for each of these clusters.
4.1.1 M 67
We have adopted and from the analyses by VandenBerg & McClure (2003) using the observations of Montgomery, Marschall, & Janes (1993). This reddening was taken from the dust maps by Schlegel, Finkbeiner, & Davis (1998). The low value agrees with that from Strömgren intermediate-band photometry of individual M 67 member stars by Nissen, Twarog, & Crawford (1987) and from the latest analysis of the two-color diagram by Sarajedini et al. (1999). It is smaller than the early value of derived by Sandage (1962b), which gave . Eggen & Sandage (1964) also derived , based on their, at that time, new photometry, taking into account blanketing differences with the Hyades. The many divergent determinations of reddening and distance moduli in the literature were also discussed in these papers, including the earliest data measured by Johnson & Sandage (1955) for their initial diagram. A summary of work up to 1981 is given by Taylor (1985).
The age of M 67 derived by VandenBerg & McClure (2003; see also VandenBerg & Clem 2003) from fits of their theoretical isochrones to the Montgomery et al. (1993) CMD is Gyr on the assumption of [Fe/H] , as derived in the high-resolution spectroscopic studies by Hobbs & Thorburn (1991) and Tautvais̆iene et al. (2000). Table 3 lists the fiducial sequence that we have derived from the Montgomery et al. photometry. These data are plotted as open circles in Figure 8, along with the best-fitting isochrone (the solid curve). The adopted distance modulus, reddening, metallicity, and isochrone age are listed in the upper left of the diagram.
The following two facts, emphasized by VandenBerg & Clem, are germain to this discussion. (1) The predicted – relation for the cluster main-sequence stars is nearly identical with the empirical relationship derived by Sekiguchi & Fukugita (2000) in the “least model-dependent way” for their counterparts in the solar neighborhood. (2) The temperatures determined for M 67 giants from empirical – relations are in very good agreement with those implied by the models. Note, as well, that the models computed by VandenBerg, Bergbusch, & Dowler (2003) assume a small amount of convective core overshooting (equivalent to approximately 0.05 to 0.1 pressure scale heights) in order to match the luminosity of the gap near the turn-off of M 67 (coincident with the blueward hook at in Figure 8).
Plots provided by VandenBerg & McClure show that it is possible to obtain comparably good fits to the main-sequence and turn-off data using isochrones for any [Fe/H] value between and 0.0 and/or for mass fraction helium abundances between and 0.30, although some variation of the mixing-length parameter with evolutionary state must, in general, be postulated in order for the models to simultaneously reproduce the cluster giant branch.
4.1.2 NGC 188
NGC 188 is known to have close to the same metallicity as M 67, with some estimates in support of a slightly lower [Fe/H] value (e.g., Hobbs, Thorburn, & Rodriguez-Bell 1990), while others favor a slightly higher metal abundance (e.g., Friel et al. 2002). As the latest available studies of NGC 188 have obtained the solar metal abundance (Randich, Sestito, & Pallavicini 2003), or slightly above solar (Worthey & Jowett 2003), we have opted to fit models for [Fe/H] to the cluster CMD reported by VandenBerg & McClure (2003).
Fiducial points shown as black dots in Figure 8 represent the data listed in Table 3. They are compared with the best-fitting theoretical isochrone from the new models presented here (see §3.1) for an age of Gyr using our adopted parameters on distance and reddening (as indicated in the lower left-hand corner of the diagram). The consequences of adopting different values of [Fe/H] and/or the helium abundance are examined in the VandenBerg & McClure study.
The photoelectric photometry reported by Sandage (1962a, hereafter S62a) and Eggen & Sandage (1969, hereafter ES69) was used to calibrate the VandenBerg & McClure observations that provide the fiducial points in Figure 8 and Table 3. They are almost identical with the CMD tabulated by S62a, and they agree well with those of Kaluzny & Rucinski (1995) for the giant and subgiant branches, although they differ by 0.015 mag in color along the main sequence at , where the Kaluzny & Rucinski points are redder. More worrisome is the fact that the independently calibrated CCD observations of NGC 188 by von Hippel & Sarajedini (1998; see also Sarajedini et al. 1999) show marked differences relative to CMDs that have relied on the S62a and ES69 photoelectric photometry. As reported by von Hippel & Sarajedini, their magnitudes are, on average, 0.052 mag fainter than those measured by S62a and ES69. In addition, there are systematic differences in the colors published by Sarajedini et al., on the one hand, and those measured by VandenBerg & McClure using S62a and ES69 photoelectric standards, on the other.444It is beyond the scope of this study to do little more than to report these differences, although we do note that a small blueward shift of both the lower-main-sequence and red-giant fiducials, which is in the direction indicated by the Sarajedini et al. photometry, would improve their consistency with the theoretical isochrones and with the positions of the lower main sequences of M 67 and NGC 6791 — see Figure 8. Further observations are needed to better establish the fiducial sequences of NGC 188.
In order for the models to provide a satisfactory match to the morphology of the NGC 188 CMD (in particular to the shape and length of the subgiant branch), it is necessary to assume (if the solar metallicity is also assumed). In so doing, a fully consistent interpretation of both M 67 and NGC 188 is obtained, as seen in Figure 8, where the theoretical isochrones agree quite well with the observational fiducial points. (A similar approach was used in their reconciliation of the CMDs of M 67 and NGC 188 by Twarog & Anthony-Twarog 1989).
In fact, our adopted reddening is within 0.01 mag of that derived from the Schlegel et al. (1998) dust maps, which give . It is also nearly identical with the reddening determined by Sarajedini et al. (1999) from the two-color diagram, which yielded mag. All of these modern estimates are larger than than the mag used in the first discussion of the NGC 188 CMD (Sandage 1962b) that gave . This initial result was re-discussed by ES69 using new photometry and a more detailed examination of the reddening and the blanketing. After 1970, the literature exploded with many papers, either with new photometry or with new discussions of the metallicity, reddening, and distance modulus (see e.g., Racine 1971; McClure 1974; McClure & Twarog 1977; VandenBerg 1985; Caputo et al. 1990; Dinescu et al. 1995; Twarog, Ashman, & Anthony-Twarog 1997 – to name only a few in addition to those already mentioned).
4.1.3 NGC 6791
The first CMD for NGC 6791, providing the Ur text, was measured by Kinman (1965). Among the more modern photometry and discussions are those by Kaluzny & Rucinski (1995) and Montgomery, Janes, & Phelps (1994). A recent comprehensive paper by Chaboyer, Green, & Liebert (1999) lists 16 previous studies of the CMD and the spectroscopy of NGC 6791 between 1965 and 1998. The deepest, tightest, and most populous CMD is that of Stetson, Bruntt, & Grundahl (2003). The fiducial points derived from their data are listed in Table 3 and plotted in Figure 8. The adopted fiducial also represents the Kaluzny & Rucinski CMD very well over the magnitude range from to except in the vicinity of the turn-off () where the former is redder by mag than the latter.
Stetson et al. (2003) discussed the cluster reddening and metallicity using an analysis based on reddening-insensitive photometric indices. Their conclusion is that mag, the metallicity is [Fe/H] , and the age is near 12 Gyr. They employed the same isochrones as those used here (VandenBerg, Bergbusch, & Dowler 2003), but their transformation to the observed []-plane was based on a preliminary version of the VandenBerg & Clem (2003) color– relations. (The latter were subsequently refined so that the isochrones are better able to reproduce both the lower-main-sequence and giant-branch slopes of the Stetson et al. CMD: no adjustments were made to the color transformations appropriate to the cluster turn-off stars.) Note that the VandenBerg & Clem color– relations have been tightly constrained by the Hyades, whose distance, metallicity, and helium abundance have been established to very high precision. Consequently, there is some justification for believing that these transformations are realistic for super-metal-rich stars.
VandenBerg & Clem (2003) found that, if NGC 6791 has a metallicity as high as [Fe/H] (cf. Peterson & Green 1998), a 10 Gyr isochrone for this metallicity gives a very good fit to the cluster CMD from 1–2 mag below the turn-off to 1–2 mag above the base of the red-giant branch, if it is also assumed that . This fit of the 10 Gyr isochrone for [Fe/H] to the cluster fiducial from Table 3 is shown in Figure 8. However, it is quite possible that this age is slightly too high as, for instance, the slope of the fiducial subgiant branch is somewhat steeper than that predicted by the 10 Gyr isochrone (see Figure 8).
Also of concern is the fact that the adopted and [Fe/H] values are close to the smallest and largest estimates of these quantities, respectively, in the current literature. As discussed by Chaboyer et al. (1999), the derived reddenings for NGC 6791 span the range , while recent spectroscopic determinations of the cluster metallicity vary from [Fe/H] (Friel & Janes 1993; Garnavich et al. 1994) to (Peterson & Green 1998). In fact, there is considerable evidence to suggest that the foreground reddening in the direction of NGC 6791 is higher than . Not easily disregarded is the finding by Kaluzny & Rucinski (1995) that the cluster sdB stars tightly constrain the reddening to . This agrees well with the value derived from the Schlegel et al. (1998) dust maps, which give mag. We are inclined to favor the latter estimate given that VandenBerg (2000) has found no indication of any problem with the Schlegel et al. reddenings in his analysis of many globular cluster CMDs and because of its apparent consistency with the Kaluzny & Rucinski results.
However, a reddening as high as 0.155 requires an increased distance modulus by mag (if derived using the main-sequence fitting technique) and a correspondingly reduced age. This poses a problem for the reason that a younger isochrone by the required amount will have a longer subgiant branch than the observed one. It is well known that the length of the subgiant branch from the main-sequence turn-off to the rise of the giant branch is a fairly strong function of absolute magnitude (cf. VandenBerg 1985; VandenBerg, Bolte, & Stetson 1990; VandenBerg & Stetson 1991; Phelps et al. 1994; Janes & Phelps 1994). Figure 8 shows that the subgiant branch in NGC 6791 is shorter than that of either M 67 or NGC 188, indicating that it is indeed older than either of the latter clusters. The same conclusion was reached by Anthony-Twarog & Twarog (1985) on the basis of their MAR age index.
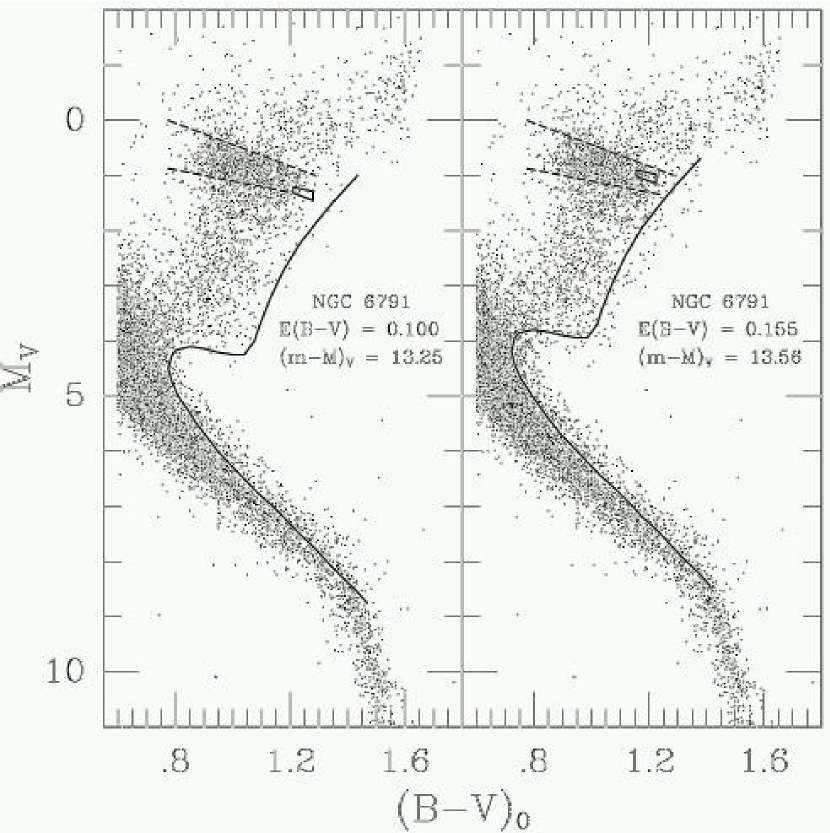
As a result of similar considerations, Chaboyer et al. (1999) also argued in support of . In addition, it must be emphasized that we need [Fe/H] to fit, in particular, the Hipparcos giants at a given absolute magnitude using our new theoretical isochrones (see Figures 5 and 6). The CMD of NGC 6791 coincides with both this envelope and the red edge of the main-sequence stars fainter than only if we use a reddening near 0.10 mag (see the left-hand panel of Figure 9), whereas it does not using (see the right-hand panel). In the latter case, the cluster giant branch is appreciably bluer than the reddest field giants. Interestingly, the NGC 6791 fiducial does provide a good match to the densest part of the distribution of field stars over the entire range in from 0 to if and . (Figure 9 shows that, in order to obtain the same match of the cluster CMD to the red envelope of the distribution of Hipparcos main-sequence stars fainter than , a 0.055 mag increase in the reddening must be accompanied by a 0.31 mag increase in the apparent distance modulus. The main-sequence stars to the right of the cluster fiducial, in both panels, are very likely binaries.)
Although Chaboyer et al. adopted , in conjunction with a reddening of 0.10, in order to obtain a satisfactory fit of their isochrones to the CMD of NGC 6791, we obtain if the same reddening is assumed (see Figure 8).555As discussed by VandenBerg & Clem (2003), the distance derived by Chaboyer et al. may too high because their color transformations are arguably too red by mag. They justify their color– relations by fitting models to the Hyades, but they adopt a helium abundance for that cluster based on a enrichment law, even though a sub-solar helium content is implied by the Hyades binaries (see also Swenson et al. 1994, Lebreton, Fernandez, & Lejeune 2001). Models for lower would require bluer color transformations to obtain comparable fits to the Hyades CMD on the assumption of the same distance and metallicity. Furthermore, bluer color– relations will result in reduced distances when derived from main-sequence fits to theoretical isochrones. The left-hand panel of Figure 9 supports our distance estimate. However, there is the hint in this figure of a problem with such a low reddening. The 4-sided polygon indicates the location of the clump giants in the CMD for NGC 6791 published by Stetson et al. (2003), and it is evident that they are redder and fainter than the main distribution of such stars in the Hipparcos CMD. Are there really so few field counterparts to the clump giants in NGC 6791, or is this another indication that the adopted cluster reddening is too low? Certainly there is substantial overlap when is assumed (see the right-hand panel). On the other hand, the paucity of field clump giants would be consistent with the fact that there are relatively few first-ascent giants in the field with such red colors as those in NGC 6791, if the comparison between the two stellar populations in the left-hand panel of Figure 9 is the correct one.
An obvious question to ask is: how well do isochrones for [Fe/H] match the NGC 6791 fiducial if the cluster has and ? The answer is given in Figure 10, which is identical with Figure 8, except for the comparison between theory and observations in the case of NGC 6791. This shows that (i) an isochrone for an age of Gyr is needed to match the observed luminosities of the turn-off and subgiant branch, and (ii) in line with comments made above, the length of the predicted subgiant branch, in this case, is considerably longer than the observed one. Unfortunately, we cannot say with certainty that this explanation of NGC 6791 can be completely ruled out. The isochrone provides a very good match to the cluster main-sequence and to the shape of the subgiant branch, but there is a discrepancy of mag between the predicted and observed giant branches.
In deriving their empirically constrained color– relations, VandenBerg & Clem (2003) found it necessary (as stated in their paper) to apply a zero-point offset of mag to the colors appropriate to giants in order to obtain a consistent interpretation of a 10 Gyr isochrone with the NGC 6791 CMD on both the []- and []-planes.666The problem is that there are few constraints on the colors of super-metal-rich giants, and VandenBerg & Clem had little choice but to tie their color calibrations at high metallicities to a particular interpretation of NGC 6791. Consequently, as emphasized in their paper, the adopted color– relations are quite uncertain above [Fe/H] (the Hyades metallicity).. Perhaps they should have corrected only the colors to achieve this consistency, in which case a younger isochrone (one near 8.5 Gyr) would have been the preferred one. This could potentially account for about one-half of the discrepancy in the giant branch seen in Figure 10. It is also possible that the predicted scale of the models that they used for super-metal-rich giants is somewhat too cool. However, an age as young as 7.5 Gyr seems unlikely, as consistency between NGC 6791 and NGC 188 (in particular, of the lengths of their respective subgiant branches) would suggest that these clusters must differ in age by more than 1.3 Gyr.
The key to the resolution of these issues is the metallicity of NGC 6791 (and of the reddest Hipparcos stars at a given ). In this regard, we note that the latest spectroscopic study of 39 giants in NGC 6791 by Friel et al. (2002) has found that this cluster is more metal rich than M 67 by 0.25 dex, which gives an [Fe/H] value in the range of to if M 67 has an [Fe/H] between and 0.0. [Recall that the Peterson & Green (1998) determination of [Fe/H] is based on only one star.] On the other hand, Worthey & Jowett (2003) have obtained [Fe/H] from low-resolution spectra of K giants in NGC 6791. A straight mean of the spectroscopic results obtained by Friel & Janes (1993), Garnavich et al. (1994), Peterson & Green (1998), Friel et al. (2002, assuming M 67 has [Fe/H] ), and Worthey & Jowett (2003) yields [Fe/H].
Given that we have isochrones in hand for [Fe/H] , it is of interest to know how well they are able to reproduce the NGC 6791 CMD on the assumption of and . As illustrated in Figure 11, this possibility is even more problematic than that just discussed. Although the location of the cluster giant branch, the slope and position of the subgiant branch, and the turn-off luminosity can be matched quite well by an 8 Gyr isochrone, it is very difficult to understand the large discrepancy between the predicted and observed colors in the vicinity of the turn-off. As already noted, the properties of the models (for main-sequence stars, in particular) are well constrained up to the Hyades metallicity, and it seems inconceivable that the errors in the colors of the models for stars that are more metal rich than the Hyades by only 0.1 dex in [Fe/H] would be as much as 0.04 mag (in a relative sense). For this reason, it is tempting to conclude from Figure 11 that NGC 6791 has a higher metal abundance than [Fe/H] (if it also has a reddening near 0.155 mag). Of course, it is possible that some other factor(s) are responsible for the difficulties discussed above; e.g., perhaps the assumed helium abundance for NGC 6791 is wrong.
Not until we have accurately measured metallicities for Hipparcos giants near the red envelope of their distribution at will it be possible to decide which of the possibilities shown in Figure 9 is closer to the truth. It may turn out, for instance, that the field giants which are overlayed by the NGC 6791 fiducial in the right-hand panel have [Fe/H] values near , in which case, the sprinkling of stars to the right of the cluster giant branch must be even more metal rich. Finally, we note that, if the adopted cluster parameters in Figure 8 (and the left-hand panel of Figure 9) are the correct ones to use, the lower limit to the subgiant luminosity in NGC 6791 corresponds to . This is mag fainter than our value of 4.03 for the Hipparcos field subgiants. In this case, NGC 6791, a high-latitude thick-disk cluster that is 1000 parsecs above the plane, would be older at 10 Gyr than the thin disk near the Sun, whose age from the field subgiants is 7.9 Gyr, according to section 3.3.
4.2 Comparison of M 67 and NGC 6791 with the Hipparcos CMD
Figure 12 shows the superposition of the color-magnitude diagrams of M 67 and NGC 6791 from Table 3 onto the H-R diagram defined by the Hipparcos stars with and mag. The assumed reddenings and distance moduli for the two open clusters are as indicated in Figure 10. If our estimates of these properties are accurate, it is clear from Figure 12 that there are many field stars as super-metal-rich (and as old) as in NGC 6791 and that a small fraction of the field-star population has an even higher metallicity (likely above [Fe/H] ). Alternatively, if NGC 6791 has and (Figure 8), the cluster is representative of the most metal-rich stars in the field.
In the latter case, even though the left-hand panel of Figure 9 suggests that a good fit of the cluster CMD to the lower envelope of the field stars can be achieved, Figure 4 shows that an envelope as faint as cannot accommodate the field-star data; the cluster fiducial is too faint by at least 0.2 mag, provided that the luminosities of the 14 Hipparcos field subgiants apparently fainter than are, in fact, due to parallax errors rather than being real (recall the caveat in §2.2).777There is a tantalizing suggestion of a distinct turn-off in the Hipparcos CMD at and (just below and to the right of the NGC 6791 turn-off in Figure 12 and in the right-hand panel of Figure 9). A suitably chosen (old) isochrone would pass through these stars, as well as the faintest subgiants and the reddest giants. Thus, there may be some reason to believe that the faintest subgiants are real, after all. Only a larger trigonometric parallax sample with increased accuracy can clarify this possibility. The implication of this would be that NGC 6791 is older than the oldest local field subgiants. Moreover, NGC 6791 may not be the oldest Galactic cluster (see Phelps et al. 1994), in which case the age gap between the halo and the oldest disk cluster (set out in the next section) would be reduced (perhaps substantially).
It will be important to test these conclusions by direct determinations of metallicity (by spectroscopy) of these field stars. An early listing of the metallicity determinations of a few local subgiants by Eggen & Sandage (1969) was based on a summary by Cayrel & Cayrel de Strobel (1966). This list suggested that several may, in fact, be super-metal-rich, but the evidence was weak. The prospect for a modern solution to the metallicity of the envelope stars in Figures 9 and 12, using the power of modern analysis and high-resolution spectrographic instrumentation, is clearly of high priority for “origin” work on Galactic structure.
Finally, we comment on the advances made since the Vatican Conference by the clear fact from Figure 12 that there are very many subgiants fainter than the M 67 CMD in the region of the subgiants where only a handful were known in 1958 (Eggen 1955, 1957; Sandage 1958).
5 The Oldest Age of the Disk Derived Here Compared with Other Determinations of the Age of the Disk and Halo
5.1 Ages from the Luminosity Function of White Dwarfs
With the fundamental paper by Mestel (1952), concerning the physics of the cooling mechanisms of white dwarfs (WDs) after the exhaustion of their nuclear energy, the way was opened to determine the oldest age of stellar aggregates from the faint termination point of their white dwarf (WD) luminosity functions (LFs). The method was first applied by Winget et al. (1987) to the local Galactic neighborhood using the observed local WD luminosity function derived by Liebert (1980), as updated by Liebert, Dahn, & Sion (1983). The result was an oldest age for the white dwarfs in the local thin disk of Gyr, considerably younger than the age of the halo globular clusters, thought at the time to be Gyr (cf. Sandage & Cacciari 1990, their Figures 13 and 14 and references within).
One of us (AS) failed to appreciate the conclusion that such a large time gap exists because of a prejudice for a model (Eggen, Lynden-Bell, & Sandage 1962) with a rapid collapse of the halo to form the disk on a timescale of less than 1 Gyr, leaving no large age gap. Nevertheless, the lower age for the disk, and therefore a conclusion for a probable time gap, has persisted to this day with an expanding literature on both the observations for the WD luminosity function (cf. Garcia-Berro et al. 1996, expanding on the LF of Liebert, Dahn, & Monet 1988) and on the physics of the cooling mechanisms, definitively reviewed up to 1990 by D’Antona & Mazzitelli (1990).
Recent advances include the papers by Wood (1992), who derived a range of WD ages between 6 and 13.5 Gyr, updated by Wood (1995) giving an age of Gyr. Adding to the ever increasingly complicated physics is a series of papers by the Montreal group, the latest being by Bergeron, Leggett, & Ruiz (2001) where they derive an age within the range from 7.9 to 9.7 Gyr using the Wood (1995) models. Their age is definitely younger by at least 3 to 5 Gyr than the halo globular clusters and the halo subdwarfs (cf. VandenBerg 2000; Grundahl et al. 2000).
The most definitive proof that the local disk WDs are younger than the oldest halo stars is the discovery by Hansen et al. (2002) that the faintest white dwarfs in the globular cluster M 4 are 2.5 magnitudes fainter than the faintest WD in the field using any of the modern determinations of the field white dwarf LF. They determined an age for M 4 of Gyr from its white dwarfs, compared with their WD age for the Galactic disk of Gyr. This disk age is 0.6 Gyr younger than our age from the Hipparcos subgiants of Gyr, although the two ages are consistent to within their respective errors (especially as our age estimate should be reduced by Gyr to take the effects of diffusive processes into account). They are both, beyond doubt, younger than the oldest halo globular clusters (§5.2).
A comprehensive modern review of both the observations and the theory of white dwarf cooling and its consequences for age dating is given by Hansen & Liebert (2003).
5.2 Ages for Halo Globular Clusters
A new era in the age dating of globular clusters began with the discovery of the oxygen enhancement relative to Fe in the oldest Galactic stars. New evolutionary models were required to account for the increased relative opacity due to the [O/Fe] overabundance as [Fe/H] decreases. Oxygen is important because it is 20 times more abundant than Fe for [Fe/H] , dominating the metal opacity. Models of the isochrones for globular clusters using increased oxygen abundance relative to Fe have recently been completed by one of us (VandenBerg 2000) and applied to the available observational data for the globular cluster M 92 and selected halo subdwarfs in the solar neighborhood. The result is an age of 15 Gyr (depending on the assumed distance, see VandenBerg & Clem 2003) both for M 92 and the field subdwarfs. However, a new distance-independent method that uses Strömgren intermediate-band colors plus theoretical calibrations via model stellar atmospheres also gives an almost identical age for M 92 (Grundahl et al. 2000). The agreement between the two independent methods gives considerable confidence in the precepts used for both. As reported by VandenBerg et al. (2002), these estimates need to be reduced by about 10% to 13.5 Gyr if diffusive processes are taken into account. We expect that Gyr is the maximum error that the data will allow.
6 Summary and Conclusions
Following a review in §1 of the discovery of subgiants in the 1920s and 1930s and their importance in the 1950s in understanding that Nature can break the Schönberg-Chandrasekar main-sequence “limit” for stable stars, there are nine principal research points in this paper.
(1) Stars with Hipparcos relative parallax errors of and uncertainties in the color index of mag show an H-R diagram that has a conspicuous lower magnitude bound to the subgiant sequence for colors between (Figures 1 and 2).
(2) Deconvolving the histogram (Figures 3 and 4) of the subgiant absolute magnitude distribution near the lower envelope with a Gaussian with standard deviation of 0.14 mag (corresponding to the average rms error of ) gives the absolute magnitude of the lower subgiant envelope as (see §2.1). Between five and ten times more stars than are available from the Hipparcos catalog will be necessary to (a) improve the measurement of this lower envelope absolute magnitude and to search for its expected small variation with color required from the models in Figures 5 and 6, and (b) to test if there are real stars in the tail of the distribution fainter than in Figure 4 or if that tail is due entirely to parallax error, as we have assumed here. The point is crucial in determining the age of the oldest disk stars in the local neighborhood from this subgiant method.
(3) From a consideration of new stellar evolution models computed for [Fe/H] values of , 0.00, , and , a high metallicity () is required (Figure 5) to fit the envelopes in the Hipparcos H-R diagram of the reddest main-sequence stars at a given absolute magnitude fainter than and also the reddest giants at given values between and . Models with [Fe/H] and turn-up from the end of the subgiant sequence to the base of the giant sequence at colors that are too blue by 0.12 mag and 0.20 mag, respectively. However, the models with [Fe/H] to provide excellent envelope lines for both the Hipparcos main-sequence and giant field stars for all ages between 6 and 12 Gyr (Figures 5, 6, 9, and 11).
(4) A fit of the models to the observations in Figure 6, using the derived lower subgiant envelope of , gives an age (in Gyr) of , assuming a metallicity of [Fe/H] (see the lower right-hand panel of Figure 7). This age would be reduced by Gyr were models that treat diffusive processes (gravitational settling and radiative accelerations) used in the analysis (see Michaud et al. 2003). The exact age is also dependent on the assumed metallicity, as shown in Figures 6 and 7, and the difference in age is given by the equation . This effect is the well known age-metallicity degeneracy.
(5) Comparison of the Hipparcos H-R diagram with the CMD of the old Galactic cluster NGC 6791 shows good agreement of the fiducial cluster diagram with the position in color of the giant sequence for the Hipparcos field giants. The fit of NGC 6791 with the reddest Hipparcos main-sequence stars at a given absolute magnitude is also excellent. Because independent spectroscopic evidence gives a metal abundance of at least [Fe/H] (possibly as high as ) for NGC 6791, the evidence is clear that the field stars near these envelope positions must also be super-metal-rich. A fine-analysis spectroscopic campaign is warranted.
(6) The age of 7.9 Gyr for the local disk Hipparcos subgiants agrees very well with the age of the local disk white dwarfs based on the white dwarf luminosity function and modern cooling theory. The age of 13.5 Gyr for the halo globular cluster M 92 and the field subdwarfs of the halo population (VandenBerg et al. 2002) suggests an appreciable age difference between the local disk subgiants of up to 5 Gyr or more. This is supported by the discovery (Hansen et al. 2002) that the faintest white dwarfs in the globular cluster M 4 are 2.5 magnitudes fainter than the faintest white dwarfs that define the local WD luminosity function.
(7) However, the issue is clouded to some extent by the possibility that NGC 6791 is not the oldest Galactic cluster. Phelps et al. (1994) have identified a handful of open clusters that may be older than NGC 6791, as judged by the age indices developed by VandenBerg et al. (1990) and refined by Phelps et al. (1994) with their MAI index, and earlier by Anthony-Twarog & Twarog (1985) with their MAR index. Of this sample, Berkeley 17 is widely considered to be the oldest cluster. Indeed, if the age estimate of 12 Gyr for this system (Friel 1995, Phelps 1997) is correct, it would support the conclusion by Janes & Phelps (1994) that “the age distribution of the open clusters overlaps [slightly, their Figure 3] with that of globular clusters, indicating that the Galactic disk began to develop toward the end of the period of star formation in the Galactic halo.” Such a picture would favor the early model of Eggen et al. (1962) of a halo collapse that was followed very shortly by the dissipative disk formation. On the other hand, the most reliable of the relative age indicators considered by Phelps et al. does not support more than a small age difference, if any, between Berkeley 17 and NGC 6791; they measured the magnitude difference between the clump stars and the mean level of the subgiant branch to be the same in both clusters (to within the uncertainties), which implies that both clusters have similar ages.
(8) Furthermore, the evidence from the white dwarf age dating of the local disk in §5.1 appears to argue strongly for an appreciable age gap, as does the derived age difference between M 4 and the local field white dwarfs by Hansen et al. (2002). Perhaps we are seeing here an age differential in the disk as a function of disk position. The local stars are no older than 7 to 10 Gyr seen from Figures 2, 4, 6, and 7, whereas those parts of the disk associated with the oldest open clusters, such as Berkeley 17, are older. Clearly these are important clues, including those from the Hipparcos subgiants studied here, about events in the early Galaxy. We expect the subject to clarify when trigonometric parallax data become available for a larger and more accurate database than is available in the current Hipparcos Catalog, wonderful as it is. The expectation is that Figure 4 could then become definitive.
(9) The mystery of the timing and the nature of the events that has led to the super-metal richness of at least a fraction of the oldest field main-sequence, subgiant, and giant stars is also expected to be clarified when detailed abundance measurements are made of the isotope ratios of particular elements involved either in the or nucleosynthesis of the chemical elements. Particular abundance ratios, both within and across the - and -process elements, are expected to identify eventually the origins of the super-metallicity. This is because the isotope ratios of [m/H] and [m/Fe] are expected to differ depending on the mechanism of nucleosynthesis, such as from type I or type II supernovae, stellar winds from stars at the top of the AGB, winds from neutron-star atmospheres, the debris from gamma-ray bursts, or perhaps from other processes not yet identified. Work has begun by Andrew McWilliam at Las Campanas on such abundance-ratio measurements for Hipparcos field stars stars near the envelopes of the relevant sequences in Figure 12.
References
- Adams (1916) Adams, W. S. 1916, Proc. Nat. Acad. Sci. 2, 147
- Adams & Joy (1917) Adams, W. S., & Joy, A. H. 1917, ApJ, 46, 313 (Mount Wilson Contribution 142) (500 stars)
- Adams & Joy (1920) Adams, W. S., & Joy, A. H. 1920, Pub. AAS, 4, 201
- Adams et al. (1935) Adams, W. S., Joy, A. H., Humason, M. L., & Brayton, A. M. 1935, ApJ, 81, 187 (Mount Wilson Contribution 511) (4179 stars)
- Adams & Kohschutter (1914) Adams, W. S., & Kohlschutter, A. 1914, ApJ, 40, 385 (Mount Wilson Contribution 89)
- Alexander & Ferguson (1994) Alexander, D. R., & Ferguson, J. W. 1994, ApJ, 437, 879
- Anthony-Twarog & Twarog (1985) Anthony-Twarog, B. J., & Twarog, B. A. 1985, ApJ, 291, 595 (their MAR index)
- Arp (1955) Arp, H. C. 1955, AJ, 60, 1
- Arp, Baum, & Sandage (1952) Arp, H. C., Baum, W. A., & Sandage, A. 1952, AJ, 57, 4
- Arp, Baum, & Sandage (1953) Arp, H. C., Baum, W. A., & Sandage, A. 1953, AJ, 58, 4
- Baade (1958) Baade, W. 1958, in Stellar Populations, ed. D. J. K. O’Connell, Specola Astronomica Vaticana, Vol. 5, (The Vatican Conference), p. 303
- Becker & Stock (1953) Becker W., & Stock, J. 1953, Zs. f. Ap., 31, 316 (M 67)
- Bergeron, Leggett, & Ruiz (2001) Bergeron, P., Leggett, S. K., & Ruiz, M.-T. 2001, ApJS, 133, 413
- Brun, Turck-Chièze, & Zahn (1999) Brun, A. S., Turck-Chièze, S., & Zahn, J.-P. 1999, ApJ, 525, 1032
- Caputo et al. (1990) Caputo, F., Chieffi, A., Castellani, V., Collados, M., Martinez Roger, C., & Paez, E. 1990, AJ, 99, 261
- Cayrel & Cayrel de Strobel (1966) Cayrel, R. & Cayrel de Strobel, G. 1966, ARAA, 4, 1
- Chaboyer, Green, & Liebert (1999) Chaboyer, B., Green, E. M., & Liebert, J. 1999, AJ, 111, 1360 (NGC 6791)
- D’Antona & Mazzitelli (1990) D’Antona, F., & Mazzitelli, I. 1990, ARAA, 28, 139
- Dinescu et al. (1995) Dinescu, D. J., Demarque, P., Guenther, D. B., & Pinsonneault, M. H. 1995, AJ, 109, 2090
- Eddington (1924) Eddington, A. S. 1924, MNRAS, 84, 308
- Eddington (1926) Eddington, A. S. 1926, The Internal Constitution of the Stars (Cambridge: Cambridge University Press)
- Eggen (1955) Eggen, O. J. 1955, PASP, 67, 315
- Eggen (1957) Eggen, O. J. 1957, AJ, 62, 45
- Eggen (1960) Eggen, O. J. 1960, MNRAS, 120, 430
- Eggen, Lynden-Bell, & Sandage (1962) Eggen, O. J., Lynden-Bell, D., & Sandage, A. 1962, ApJ, 136, 748
- Eggen & Sandage (1959) Eggen, O. J., & Sandage, A. 1959, MNRAS, 119, 255
- Eggen & Sandage (1964) Eggen, O. J., & Sandage, A. 1964, ApJ, 140, 130 (M 67, NGC 188)
- Eggen & Sandage (1969, hereafter ES69) Eggen, O. J., & Sandage, A. 1969, ApJ, 158, 669 (ES69)
- Friel (1995) Friel, E. D. 1995, ARAA, 33, 381
- Friel & Janes (1993) Friel, E. D., & Janes, K. A. 1993, A&A, 267, 75
- Friel et al. (2002) Friel, E. D., James, K. A., Tanarez, M., et al. 2002, AJ, 124, 2693
- Garcia-Berro et al. (1996) Garcia-Berro, L., Hernanz, M., Isern, J., Chabier, G., Segretain, L., & Mochkovitch, R. 1996, A&AS, 117, 13
- Garnavich et al. (1994) Garnavich, P. M., VandenBerg, D. A., Zurek, D. R., & Hesser, J. E. 1994, AJ, 107, 1097
- Grevesse & Noels (1993) Grevesse, N., & Noels, A. 1993, in Origin and Evolution of the Elements, eds. N. Prantos, E. Vanioni-Flam, & M. Cassé (Cambridge: Cambridge Univ. Press), p. 15
- Grundahl et al. (2000) Grundahl, F., VandenBerg, D. A., Bell, R. A., Andersen, M. I., & Stetson, P. B. 2000, AJ, 120, 1884
- Hansen et al. (2002) Hansen, B. M. S., Brewer, J., Fahlman, G. G., et al. 2002, ApJ, 574, L155
- Hansen & Liebert (2003) Hansen, B. M. S., & Liebert, J. 2003, ARAA, 41, in press
- Hobbs & Thorburn (1991) Hobbs, L. M., & Thorburn, J. A. 1991, AJ, 102, 1070
- Hobbs, Thorburn, & Rodriguez-Bell (1990) Hobbs, L. M., Thorburn, J. A., & Rodriguez-Bell, T. 1990, AJ, 100, 710
- Hoyle & Schwarzschild (1955) Hoyle, F., & Schwarzschild, M. 1955, ApJS, 2,1
- Iglesias & Rogers (1996) Iglesias, C. A., & Rogers, F. J. 1996, ApJ, 464, 943
- Janes & Phelps (1994) Janes, K. A., & Phelps, R. L. 1994, AJ, 108, 1773
- Jenkins (1952) Jenkins, L. 1952, General Catalogue of Trigonometric Parallaxes, Yale Univ. Obs.
- Jenkins (1963) Jenkins, L. 1963, Supplement to the General Catalogue of Trigonometric Parallaxes
- Johnson & Sandage (1955) Johnson, H. L., & Sandage, A. 1955, ApJ, 121, 616 (M 67)
- Kaluzny & Rucinski (1995) Kaluzny, J., & Rucinski, S. M. 1995, A&AS, 114, 1
- Kinman (1959) Kinman, T. D. 1959, MNRAS, 119, 538
- Kinman (1965) Kinman, T. D. 1965, ApJ, 142, 665
- Kippenhahn, Temesvary, & Biermann (1958) Kippenhahn, R. R., Temesvary, St., & Biermann, L. 1958, Zs. f. Ap., 46, 257
- Lebreton, Fernandez, & Lejeune (2001) Lebreton, Y., Fernandez, J., & Lejeune, T. 2001, A&A, 374, 523
- Liebert (1980) Liebert, J. 1980, ARAA, 18, 363
- Liebert, Dahn, & Monet (1988) Liebert, J. Dahn, C. C., & Monet, D. G. 1988, ApJ, 332, 891
- Liebert, Dahn, & Sion (1983) Liebert, J. W., Dahn, C. C., & Sion, E. M. 1983, in IAU Collq. 76, The Nearby Stars and the Stellar Luminosity Function, ed. A. G. D. Philip & A. R. Upgren (Schenectady; L. Davis Press), p. 103
- Liu & Chaboyer (2000) Liu, W. M., & Chaboyer, B. 2000, ApJ, 544, 818
- Luyten (1922) Luyten, W. J. 1922, Lick Obs. Bull., 10, 135
- McClure (1974) McClure, R. D. 1974, ApJ, 194, 355
- McClure & Twarog (1977) McClure, R. D., & Twarog, B. A. 1977, ApJ, 214, 111
- Mestel (1952) Mestel, L. 1952, MNRAS, 112, 583
- Michaud et al. (2003) Michaud, G., Richard, O., Richer, J., & VandenBerg, D. A. 2003, in preparation
- Montgomery, Janes, & Phelps (1994) Montgomery, K. A., Janes, K. A., & Phelps, R. L. 1994, AJ, 108, 585 (NGC 6791)
- Montgomery, Marschall, & Janes (1993) Montgomery, K. A., Marschall, L. A., & Janes, K. A. 1993, AJ, 106, 181 (M 67)
- Morgan (1937) Morgan, W. W. 1937, ApJ, 85, 380
- Morgan, Keenan, & Kellman (1943) Morgan, W. W., Keenan, P. C., & Kellman, E. 1943 (Chicago: Univ. Chicago Press)
- Nissen, Twarog, & Crawford (1987) Nissen, P. E., Twarog, B. A., & Crawford, D. L. 1987, AJ, 93, 634
- O’Connell (1958) O’Connell, D. J. K., ed. 1958, Stellar Populations, Specola Astronomica Vaticana, Vol. 5. (The Vatican Conference Report), Vatican City: Specola Vaticana
- Peimbert, Peimbert, & Luridiana (2002) Peimbert, A., Peimbert, M., & Luridiana, V. 2002, ApJ, 565, 668
- Perryman et al. (1995) Perryman, M. A. C., Lindgren, L., Kovalevsky, J., et al. 1995, A&A, 304, 69
- Peterson & Green (1998) Peterson, R. C., & Green, E. M. 1998, ApJ, 502, L39
- Phelps (1997) Phelps, R. L. 1997, ApJ, 481, 826
- Phelps, Janes, & Montgomery (1994) Phelps, R. L., Janes, K. A., & Montgomery, K. A. 1994, AJ, 107, 1079
- Press et al. (2002) Press, W.H., Flannery, B.P., Teukolsky, S.A., & Vetterling, W.T. 2002, Numerical Recipes : The Art of Scientific Computing (Cambridge: Cambridge Univ. Press)
- Racine (1971) Racine, R. 1971, ApJ, 162, 891
- Randich, Sestito, & Pallavicini (2003) Randich, S., Sestito, P., & Pallavicini, R. 2003, A&A, 399, 133
- Richard et al. (2002) Richard, O., Michaud, G., Richer, J., Turcotte, S., Turck-Chìeze, S., & VandenBerg, D. A. 2002, ApJ, 568, 979
- Rosvick & VandenBerg (1998) Rosvick, J., & VandenBerg, D. A. 1998, AJ, 115, 1516
- Russell (1914) Russell, H. N. 1914, Popular Astronomy, 22, 342
- Russell (1925a) Russell, H. N. 1925a, Nature, 116, 209
- Russell (1925b) Russell, H. N. 1925b, Scientific American, October, 241
- Russell, Dugan, & Stewart (1927) Russell, H. N., Dugan, R. S., & Stewart, J. Q. 1927, Astronomy, Vol. 2 (Boston: Ginn and Co.), p. 909 (First edition)
- Sandage (1953) Sandage, A. 1953, AJ, 58, 127, 513
- Sandage (1958) Sandage, A. 1958, in Stellar Populations, ed. D. J. K. O’Connell, Specola Astronomica Vaticana, Vol. 5, (The Vatican Conference), p. 287
- Sandage (1962a, hereafter S62a) Sandage, A. 1962a, ApJ, 135, 333 (S62a) (NGC 188)
- Sandage (1962b) Sandage, A. 1962b, ApJ, 135, 349
- Sandage (1982) Sandage, A. 1982, ApJ, 252, 553
- Sandage & Cacciari (1990) Sandage, A., & Cacciari, C. 1990, ApJ, 350, 645
- Sandage & Eggen (1959) Sandage, A., & Eggen, O. J. 1959, MNRAS, 119, 278
- Sandage & Schwarzschild (1952) Sandage, A., & Schwarzschild, M. 1952, ApJ, 116, 463
- Sandage & Smith (1966) Sandage, A., & Smith, L. L. 1966, ApJ, 144, 886
- Sandage & Wallerstein (1960) Sandage, A., & Wallerstein, G. 1960, ApJ, 131, 598
- Sarajedini et al. (1999) Sarajedini, A., von Hippel, T., Kozhurina-Platais, V., & Demarque, P. 1999, AJ, 118, 2894
- Schlegel, Finkbeiner, & Davis (1998) Schlegel, D. J., Finkbeiner, D. P., & Davis, M. 1998, ApJ, 500, 525
- Schönberg & Chandrasekhar (1942) Schönberg, M., & Chandrasekhar, S. 1942, ApJ, 96, 161
- Schwarzschild (1958) Schwarzschild, M. 1958, in Stellar Populations, ed. D. J. K. O’Connell, Specola Astronomica Vaticana, Vol. 5, (The Vatican Conference), p. 300
- Sekiguchi & Fukugita (2000) Sekiguchi, M., & Fukugita, M. 2000, AJ, 120, 1072
- Shapley (1915) Shapley, H. 1915, Contributions of the Mount Wilson Solar Observatory, No. 116 (no Journal paper)
- Shapley (1916) Shapley, H. 1916, Contributions of the Mount Wilson Solar Observatory, No. 117 (no Journal paper)
- Stetson, Bruntt, & Grundahl (2003) Stetson, P. B., Bruntt, H., & Grundahl, F. 2003, PASP, 115, 413
- Stromberg (1930) Stromberg, G. 1930, ApJ, 71, 175 (Mount Wilson Contribution 396)
- Stromberg (1932) Stromberg, G. 1932, ApJ, 75, 120 (Mount Wilson Contribution 442)
- Swenson et al. (1994) Swenson, F. J., Faulkner, J., Rogers, F. J., & Iglesias, C. 1994, ApJ, 425, 286
- Tautvais̆iene et al. (2000) Tautvais̆iene, G., Edvardsson, B., Tuominen, I., & Ilyin, I. 2000, A&A, 360, 499
- Taylor (1985) Taylor, B. J. 1985, Vistas in Astronomy, 26, 253
- Trumpler (1925) Trumpler, R. J. 1925, PASP, 37, 307
- Turcotte et al. (1998) Turcotte, S., Richer, J., Michaud, G., Iglesias, C. A., & Rogers, F. J. 1998, ApJ, 504, 539
- Twarog & Anthony-Twarog (1989) Twarog, B. A. & Anthony-Twarog, B. J. 1989, AJ, 97, 759
- Twarog, Ashman, & Anthony-Twarog (1997) Twarog, B. A., Ashman, K. M., & Anthony-Twarog, B. J. 1997, AJ, 114, 2556
- VandenBerg (1985) VandenBerg, D. A. 1985, ApJS, 58, 711
- VandenBerg (2000) VandenBerg, D. A. 2000, ApJS, 129, 315
- VandenBerg, Bergbusch, & Dowler (2003) VandenBerg, D. A., Bergbusch, P. A., & Dowler, P. D. 2003, in preparation
- VandenBerg, Bolte, & Stetson (1990) VandenBerg, D. A., Bolte, M., & Stetson, P. B. 1990, AJ, 100, 445
- VandenBerg & Clem (2003) VandenBerg, D. A., & Clem, J. L. 2003, AJ in press
- VandenBerg & McClure (2003) VandenBerg, D. A. & McClure, R. D. 2003, in preparation
- VandenBerg & Stetson (1991) VandenBerg, D. A., & Stetson, P. B. 1991, AJ, 102, 1043
- VandenBerg et al. (2000) VandenBerg, D. A., Swenson, F. J., Rogers, F. J., Iglasias, C. A., & Alexander, D. R. 2000, ApJ, 532, 430
- VandenBerg et al. (2002) VandenBerg, D. A., Richard, O., Michaud, G., & Richer, J. 2002, ApJ, 571, 487
- von Hippel & Sarajedini (1998) von Hippel, T., & Sarajedini, A. 1998, AJ, 116, 1789
- Wilson (1976) Wilson, O. C. 1976, ApJ, 205, 823
- Winget et al. (1987) Winget, D. E., Hansen, C. J., Liebert, J., van Horn, H. M., Fontaine, G., Nather, R. E., Kepler, S. O., & Lamb, D. Q. 1987, ApJ, 315, L77
- Wood (1992) Wood, M. A. 1992, ApJ, 386, 539
- Wood (1995) Wood, M. A. 1995, Lecture Notes in Physics,, Vol. 43, ed. D. Koester & K. Werner (Springer-Verlag; Heildberg), p. 41
- Woolley et al. (1970) Woolley, R., Epps, E. A., Penston, M. J., & Pecock, S. B. 1970, Roy. Obs. Annals Vol. 5
- Worthey & Jowett (2003) Worthey, G., & Jowett, K. J. 2003, PASP, 115, 96


| Color Range | |||
|---|---|---|---|
| 0.85–0.95 | 0.95–1.05 | 0.85–1.05 | |
| 1.95–2.05 | 11 | 12 | 23 |
| 2.05–2.15 | 13 | 9 | 22 |
| 2.15–2.25 | 7 | 16 | 23 |
| 2.25–2.35 | 10 | 12 | 22 |
| 2.35–2.45 | 13 | 16 | 29 |
| 2.45–2.55 | 11 | 16 | 27 |
| 2.55–2.65 | 14 | 13 | 27 |
| 2.65–2.75 | 11 | 11 | 22 |
| 2.75–2.85 | 10 | 11 | 21 |
| 2.85–2.95 | 12 | 11 | 23 |
| 2.95–3.05 | 18 | 8 | 26 |
| 3.05–3.15 | 13 | 6 | 19 |
| 3.15–3.25 | 14 | 9 | 23 |
| 3.25–3.35 | 9 | 9 | 18 |
| 3.35–3.45 | 9 | 4 | 13 |
| 3.45–3.55 | 6 | 7 | 13 |
| 3.55–3.65 | 7 | 3 | 10 |
| 3.65–3.75 | 11 | 6 | 17 |
| 3.75–3.85 | 6 | 4 | 10 |
| 3.85–3.95 | 7 | 8 | 15 |
| 3.95–4.05 | 3 | 2 | 5 |
| 4.05–4.15 | 3 | 2 | 5 |
| 4.15–4.25 | 1 | 0 | 1 |
| 4.25–4.35 | 0 | 0 | 0 |
| 4.35–4.45 | 1 | 1 | 2 |
| 4.45–4.55 | 0 | 1 | 1 |
| Color | ||||||||||
|---|---|---|---|---|---|---|---|---|---|---|
| Age | 0.60 | 0.65 | 0.70 | 0.75 | 0.80 | 0.85 | 0.90 | 0.95 | 1.00 | 1.05 |
| (Gyr) | ||||||||||
| [Fe/H] | ||||||||||
| 6 | 3.27 | 3.33 | 3.41 | 3.47 | 3.47 | 3.23 | – | – | – | – |
| 7 | 3.43 | 3.47 | 3.53 | 3.58 | 3.59 | 3.39 | – | – | – | – |
| 8 | 3.58 | 3.59 | 3.64 | 3.68 | 3.69 | 3.52 | – | – | – | – |
| 9 | 3.72 | 3.70 | 3.73 | 3.77 | 3.78 | 3.63 | – | – | – | – |
| 10 | 3.87 | 3.81 | 3.83 | 3.86 | 3.86 | 3.73 | – | – | – | – |
| 11 | 4.01 | 3.91 | 3.91 | 3.94 | 3.94 | 3.82 | – | – | – | – |
| 12 | 4.19 | 4.00 | 3.99 | 4.01 | 4.01 | 3.90 | – | – | – | – |
| [Fe/H] | ||||||||||
| 6 | 3.48 | 3.42 | 3.45 | 3.53 | 3.61 | 3.67 | 3.66 | – | – | – |
| 7 | – | 3.59 | 3.59 | 3.64 | 3.71 | 3.77 | 3.76 | – | – | – |
| 8 | – | 3.76 | 3.72 | 3.75 | 3.81 | 3.86 | 3.86 | – | – | – |
| 9 | – | 3.94 | 3.84 | 3.85 | 3.90 | 3.95 | 3.95 | – | – | – |
| 10 | – | – | 3.96 | 3.95 | 3.99 | 4.03 | 4.03 | 3.88 | – | – |
| 11 | – | – | 4.08 | 4.04 | 4.07 | 4.10 | 4.10 | 3.98 | – | – |
| 12 | – | – | 4.20 | 4.13 | 4.15 | 4.17 | 4.18 | 4.06 | – | – |
| [Fe/H] | ||||||||||
| 6 | – | – | – | 3.61 | 3.63 | 3.69 | 3.78 | 3.85 | 3.85 | 3.64 |
| 7 | – | – | – | 3.79 | 3.77 | 3.81 | 3.89 | 3.95 | 3.96 | 3.78 |
| 8 | – | – | – | 4.00 | 3.91 | 3.93 | 3.99 | 4.04 | 4.05 | 3.89 |
| 9 | – | – | – | – | 4.05 | 4.03 | 4.08 | 4.13 | 4.14 | 3.99 |
| 10 | – | – | – | – | 4.19 | 4.13 | 4.16 | 4.21 | 4.22 | 4.09 |
| 11 | – | – | – | – | 4.33 | 4.23 | 4.24 | 4.28 | 4.29 | 4.18 |
| 12 | – | – | – | – | – | 4.32 | 4.32 | 4.35 | 4.36 | 4.25 |
| M 67 | NGC 188 | NGC 6791 | |||||
|---|---|---|---|---|---|---|---|
| 9.00 | 1.555 | 12.00 | 1.387 | 14.25 | 1.535 | ||
| 9.50 | 1.430 | 12.54 | 1.305 | 14.45 | 1.500 | ||
| 10.00 | 1.320 | 13.00 | 1.233 | 14.73 | 1.450 | ||
| 10.50 | 1.220 | 13.50 | 1.162 | 15.04 | 1.400 | ||
| 11.00 | 1.127 | 14.00 | 1.112 | 15.50 | 1.331 | ||
| 11.50 | 1.059 | 14.25 | 1.091 | 16.00 | 1.274 | ||
| 11.75 | 1.032 | 14.75 | 1.060 | 16.50 | 1.228 | ||
| 12.18 | 1.000 | 15.00 | 1.028 | 17.00 | 1.191 | ||
| 12.50 | 0.974 | 15.06 | 1.005 | 17.25 | 1.175 | ||
| 12.72 | 0.950 | 15.08 | 0.950 | 17.50 | 1.140 | ||
| 12.86 | 0.937 | 15.02 | 0.900 | 17.50 | 1.100 | ||
| 13.05 | 0.900 | 14.96 | 0.850 | 17.46 | 1.050 | ||
| 13.05 | 0.850 | 14.89 | 0.800 | 17.39 | 1.000 | ||
| 12.90 | 0.800 | 14.86 | 0.750 | 17.35 | 0.950 | ||
| 12.75 | 0.750 | 14.91 | 0.702 | 17.42 | 0.900 | ||
| 12.63 | 0.700 | 15.00 | 0.677 | 17.50 | 0.888 | ||
| 12.61 | 0.650 | 15.25 | 0.663 | 17.75 | 0.875 | ||
| 12.60 | 0.600 | 15.50 | 0.670 | 18.00 | 0.888 | ||
| 12.85 | 0.535 | 15.75 | 0.687 | 18.25 | 0.909 | ||
| 13.15 | 0.578 | 16.00 | 0.714 | 18.50 | 0.942 | ||
| 13.50 | 0.559 | 16.25 | 0.747 | 18.75 | 0.974 | ||
| 13.75 | 0.562 | 16.50 | 0.793 | 19.00 | 1.010 | ||
| 14.00 | 0.585 | 16.75 | 0.838 | 19.25 | 1.047 | ||
| 14.25 | 0.623 | 17.00 | 0.884 | 19.50 | 1.093 | ||
| 14.50 | 0.665 | 17.25 | 0.928 | 19.75 | 1.139 | ||
| 14.75 | 0.706 | 17.50 | 0.982 | 20.00 | 1.186 | ||
| 15.00 | 0.749 | 17.75 | 1.035 | 20.25 | 1.239 | ||
| 15.25 | 0.796 | 18.00 | 1.100 | 20.50 | 1.287 | ||
| 15.50 | 0.846 | 18.25 | 1.160 | 20.75 | 1.332 | ||
| 15.75 | 0.897 | 18.50 | 1.216 | 21.00 | 1.384 | ||
| 16.00 | 0.952 | 18.75 | 1.276 | 21.25 | 1.428 | ||
| 16.25 | 1.010 | 19.00 | 1.334 | 21.50 | 1.474 | ||
| 16.50 | 1.069 | 19.25 | 1.400 | 21.75 | 1.525 | ||
| 16.75 | 1.126 | 19.50 | 1.455 | 22.00 | 1.568 | ||
| 17.00 | 1.187 | – | – | – | – | ||
| 17.25 | 1.241 | – | – | – | – | ||
| 17.50 | 1.298 | – | – | – | – | ||
| 17.75 | 1.357 | – | – | – | – | ||
| 18.00 | 1.407 | – | – | – | – | ||
| 18.25 | 1.448 | – | – | – | – | ||