A Massive X-ray Outflow from the Quasar PDS 456
Abstract
We report on XMM-Newton spectroscopic observations of the luminous, radio-quiet quasar PDS 456. The hard X-ray spectrum of PDS 456 shows a deep absorption trough (constituting 50% of the continuum) at energies above 7 keV in the quasar rest frame, which can be attributed to a series of blue-shifted K-shell absorption edges due to highly ionized iron. The higher resolution soft X-ray RGS spectrum exhibits a broad absorption line feature near 1 keV, which can be modeled by a blend of L-shell transitions from highly ionized iron (Fe xvii – xxiv). An extreme outflow velocity of km s-1 is required to model the K and L shell iron absorption present in the XMM-Newton data. Overall, a large column density (cm-2) of highly ionized gas (log ) is required in PDS 456. A high mass outflow rate of year-1 (assuming a conservative outflow covering factor of 0.1 steradian) is derived, which is of the same order as the overall mass accretion rate in PDS 456. The kinetic energy of the outflow represents a substantial fraction (%) of the quasar energy budget, whilst the large column and outflow velocity place PDS 456 towards the extreme end of the broad absorption line quasar population.
1 Introduction
PDS 456 is a luminous, low redshift () radio-quiet quasar identified in 1997 (Torres et al., 1997). The optical and infra-red spectra (Simpson et al., 1999) show broad Balmer and Paschen lines (e.g. H FWHM 3000 km s-1), strong Fe ii, a hard (de-reddened) optical continuum (), and one of the strongest ‘big blue bumps’ of any AGN (Simpson et al., 1999; Reeves et al., 2000). PDS 456 has a de-reddened, absolute blue magnitude of M (Simpson et al., 1999), making it at least as luminous as the radio-loud quasar 3C 273. Indeed PDS 456 is the most luminous known AGN in the local Universe (z ), its luminosity being more typical of quasars at z=2-3, at the peak of the quasar luminosity function.
PDS 456 was first detected as the X-ray source RXS J172819.3-141600 in the ROSAT All Sky Survey (Voges et al., 1999). Subsequent ASCA and RXTE and BeppoSAX observations showed that it was highly X-ray variable (Reeves et al., 2000, 2002), requiring that the X-ray source was very compact ( Schwarzschild radii) and accreting with a unusually high efficiency (between 6% and 41%), close to the limit for rotating Kerr black hole (Thorne, 1974). The X-ray spectrum of PDS 456, obtained by ASCA and RXTE also appeared to be unusual for a quasar. A strong edge like feature was present in the iron K-shell band, either due to a highly ionized absorber or reflector, whilst absorption towards the soft X-ray band was also observed (Reeves et al., 2000). An XMM-Newton observation of PDS 456 was subsequently obtained in AO-1, in order to obtain high signal to noise spectra of both the iron K-shell complex with the EPIC CCD detectors and a high resolution spectrum of the soft X-ray absorber with the XMM-Newton RGS (Reflection Grating Spectrometer). Here we report on the X-ray spectra obtained through the XMM-Newton observations of PDS 456, which reveal evidence for a massive outflow, with a velocity of km s-1. A previous paper (Reeves et al., 2002) discussed in detail the X-ray variability during the XMM-Newton observation and a simultaneous week long BeppoSAX observation.
2 The X-ray Observations
PDS 456 was observed by XMM-Newton on 2001 February 26th with a duration of 40 ks. Data were taken with the EPIC-pn detector (Struder et al., 2001) in Full Window Mode and with the EPIC-MOS detector (Turner et al., 2001) in Large Window mode. The data was reduced using version 5.4 of the XMM-SAS software. Note that the time-averaged, 0.5-10 keV flux of PDS 456 during the observation was ergs cm-2 s-1; at this flux level the effect of photon pile-up is small (%). All time intervals were included, as the observation contained no background flares. Data were selected using event patterns 0-12 (for the MOS) and pattern 0-4 (for the pn) and only good X-ray events were included. The spectra were extracted from circular source regions of 40′′ radius, whilst background spectra were extracted from an offset circle, close to PDS 456, but free of any background sources. Response matrices and ancillary response files were generated using the SAS tasks rmfgen and arfgen respectively.
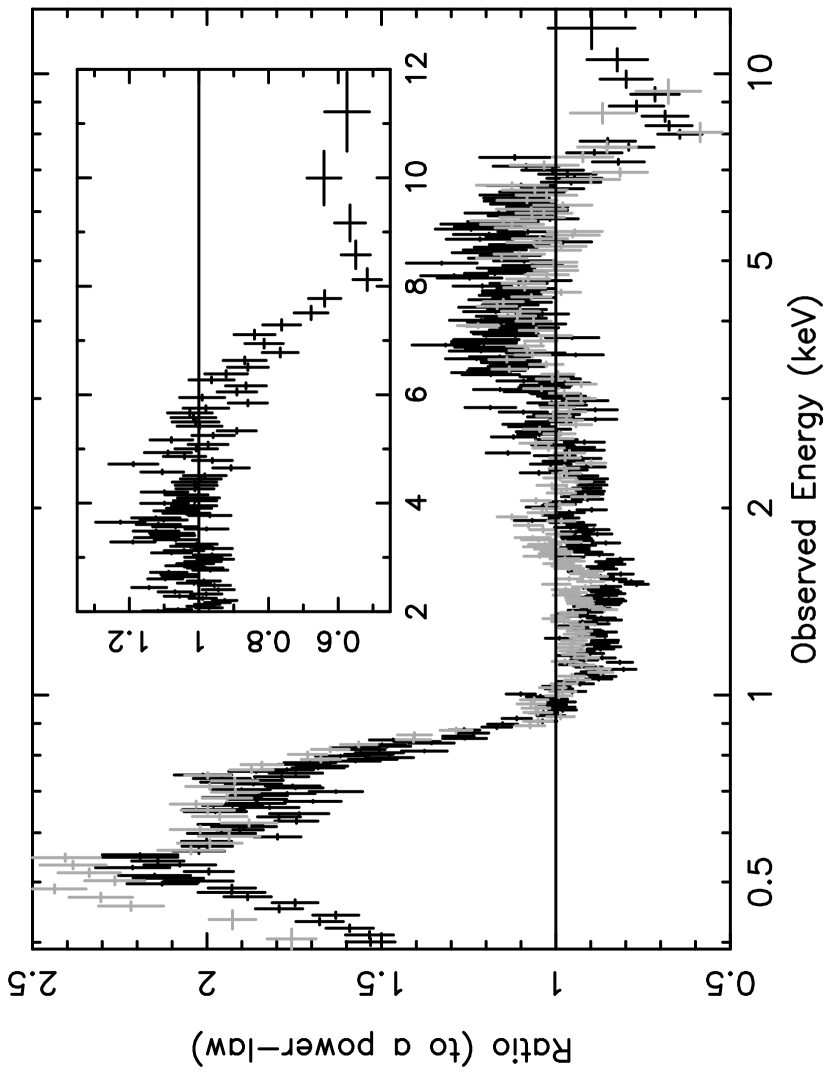
Background subtracted spectra were fitted using xspec v11.2, including data over the energy ranges 0.4 to 12 keV for the EPIC-pn and 0.4 keV to 10 keV for the co-added EPIC-MOS spectrum. A Galactic absorption column of cm-2 (Dickey & Lockman, 1990) was included in all the fits. A single absorbed power-law fit (photon index, ) to both MOS and PN data is clearly inadequate (reduced ). Figure 1 shows the data/model ratio to this power-law, a strong soft excess is observed below 1 keV and a large drop in counts is observed above 7 keV in the iron K-shell band. The MOS and pn spectra are consistent, except below 0.5 keV where there is a small divergence in spectral slope.
3 The Ionized Absorber in PDS 456
Initially, to model the iron K-shell band, the data were fitted from 2-12 keV (or 2-10 keV for EPIC-MOS), so that the effects of the large soft excess are negligible. As the EPIC-pn data contained significantly more counts than the EPIC-MOS at the highest energies, we proceeded to fit the EPIC-pn data only. The ratio spectrum above 2 keV to a power-law fitted over the 2-5 keV range (i.e. outside of the iron K band) is shown in the inset to Figure 1. A strong deficit of counts occurs above 7 keV, where one would expect to observe K-shell absorption edges from highly ionized iron. Indeed a simple Galactic absorbed power-law produced a poor fit (, null hypothesis probability ).
Adding three absorption edges between 7 and 10 keV significantly improves the fit (), modeling the broad Fe absorption feature present in the X-ray spectrum. The energies (in the quasar rest frame) and optical depths of the edges are then; keV, keV and keV with , , respectively. The breadth of the absorption feature suggests that a wide range of ionizations may be present, whilst the depth of the feature implies a column of gas of cm-2. Note that the upper limit to a narrow (i.e. unresolved) Fe emission line (in the energy range 6.4 - 6.97 keV) is 12 eV, implying that the solid angle subtended by the absorber must be small ( steradian). Note that an extreme broad iron K emission line from an accretion disk cannot model the shape of the spectrum from 2-12 keV. If one attempts to model the spectrum with a Fe line profile from a rapidly rotating Kerr black hole (Laor, 1991), the physical parameters required are unphysical (disk emissivity , inclination=90∘, equivalent width keV), because the line is (unsuccessfully) attempting to model the broad absorption dip above 7 keV with the blue-wing of the line profile.
To obtain a more physical representation of the Fe K-shell absorber, we used a grid of models generated by the xstar photoionization code (Kallman et al., 1996) to fit the EPIC-pn data above 2 keV. Solar elemental abundances were assumed, whilst a turbulence velocity of 1000 km s-1 was used. A one zone photoionization model was adopted, with the column density (), ionization parameter (), partial covering fraction () and outflow velocity () as free parameters. An effective hydrogen column density (for a solar abundance H/Fe ratio) of cm-2 is required, together with an ionization parameter of and a partial covering fraction of , whilst the power-law continuum steepens to . At this ionization state most of the absorption is due to Fe xvii - Fe xxiv (i.e. where the L-shell is partially filled). The best fit spectrum modeled by xstar is shown in Figure 2 (panel a), the depth and energy of the absorption feature being well matched, whilst the partial covering warm absorber also models the convex spectral curvature (through the increase in opacity at lower energies due to iron L-shell absorption) present in the EPIC-pn data between 2-6 keV. Overall, the fit statistic for this model is excellent ().
Importantly a large outflow velocity of 47000 km s-1 (90% confidence limits, 36000 km s-1 – 82000 km s-1) is needed to model the spectrum. Although the exact outflow velocity is not well constrained by the EPIC-pn data alone, a significant outflow velocity is still required. Figure 2(b) illustrates this point, if one fixes the absorber velocity to zero, then the model fit becomes poor as the iron K edges then lie at a significantly lower energy than is observed in the EPIC data. Indeed if one tries to increase the energy of the model absorption feature by increasing the ionization state of the absorber (so that He and H-like iron dominates), the result is a worse fit still, partly because the absorption edge feature becomes weaker (as a significant fraction of iron becomes fully ionized) and also because the most prominent absorption features are now the strong K and K absorption lines due to Fe xxvi which are not present in the actual XMM-Newton data (Figure 2c). Thus a significant outflow velocity is required by the data, indeed one can place a conservative lower-limit (at 99.9% confidence) on the velocity of 24000 km s-1 (or ).
3.1 The soft X-ray RGS Spectrum of PDS 456
Extrapolation of the hard X-ray spectrum to lower energies (down to 0.4 keV), leaves clear residuals in the EPIC MOS and pn data (e.g. Figure 1). A strong soft excess is present below 1 keV, whilst residuals due to an additional absorber may also be present in the soft X-ray band. To investigate this at higher spectral resolution, we used data available from the Reflection Grating Spectrometer (RGS) below 2 keV. The most noticeable feature present is a broad absorption trough observed between 12-15 Å (see Figure 3). The feature is highly significant, being detected at confidence. When parameterized by a simple broad Gaussian shaped absorption line, the best fit parameters (in the quasar rest frame) are keV with an equivalent width of eV and a velocity width of km s-1.
As in the previous section, we used our grid of photoionization models to characterize the properties of the absorbing gas, apparent in the RGS spectrum. A lower column density ( cm-2) is required to fit the data, whilst both a similar ionization parameter () and outflow velocity (with km s-1) are needed, as per the fits to the EPIC-pn data. Partial covering is not required in the RGS fits. The photon index obtained (, after correcting for absorption) is consistent with the EPIC-pn data, whilst a soft blackbody component (with eV) is also needed in the fit. The lower column density derived from the RGS fit indicates that the absorber is patchy and thus is likely to be located quite close to the X-ray source. Thus we see a higher (partially covered) column along the line of sight towards the hard X-ray continuum, whilst the column towards the soft X-ray continuum is lower.
Inspection of the best-fit photoionization model implies that a blend of L-shell transitions from Fe xvii – Fe xxiv as well as K-shell absorption from Ne ix/x is responsible for the broad absorption feature at 12-15 Å. A weak Ly- absorption line due to O viii may also be present at 19 Å. The outflow velocity derived appears robust, due to the positioning of the broad absorption feature. If one fixes the absorber velocity at zero in the quasar rest-frame, then the Fe L-shell absorption in the model is located at energies below the observed absorption trough, whilst increasing the ionization of the absorber only serves to significantly weaken the soft X-ray absorber.
4 Discussion
X-ray spectroscopy of PDS 456 with XMM-Newton has revealed a high column density ( cm-2), highly ionized (log ) warm absorber, its main signature being a series of K and L shell absorption edges and lines due to iron in the ionization range Fe xvii – Fe xxiv. Crucially, a near relativistic outflow velocity is required, of the order 50000 km s-1. This velocity is similar to the actual systemic velocity of PDS 456 (at ), therefore it is possible that the absorbing material is unrelated to the quasar, and is local to our Galaxy. However we consider it extremely unlikely that such a high column, highly ionized absorber could occur by chance along the local line of sight. Furthermore, although the Galactic column towards PDS 456 is moderately high (cm-2), this neutral absorption does not contribute towards the features seen in the iron K and L-shell bands, and in any event has been accounted for in all our modeling. Therefore it is highly probable that the absorber is intrinsic to the quasar PDS 456.
4.1 A Massive Outflow in PDS 456
The combination of a large column density, high ionization and a fast outflow velocity in PDS 456 indicates that the absorber is located close to the quasar’s central engine and that its mass outflow rate is significant relative the to the accretion rate. A maximum distance to the absorber can be calculated on the condition that its thickness () cannot exceed its distance from the ionizing source (), i.e. . This requires that (where ) for a black hole mass of for PDS 456 (Reeves et al., 2000), thus it is located within the BLR. One likely possibility is that the absorber arises through a disk driven outflow or wind. The exact origin of these winds and the mechanism responsible for driving them (radiation and/or magnetic) is unclear. For Broad Absorption Line (BAL) QSOs, line driven winds have been proposed (Murray et al., 1995; Proga, Stone & Kallman, 2000) as well as centrifugal driving along open magnetic field lines (Bottorff et al., 1997).
Using conservation of mass, the outflow rate () for an outflow subtending a solid angle of steradian with a constant velocity is given by:-
where is the density, the distance from the X-ray source and the proton mass. Now the ionization parameter is defined as , so we can obtain:-
From the observations, the hard X-ray luminosity of PDS 456 (above 2 keV) is erg s-1, the ionization parameter is , whilst km s-1. From the lack of any iron K line emission it is likely that the outflow subtends a solid angle of steradian. However even for a conservative value of 0.1 steradian, the mass outflow rate derived is g s-1 or year-1. A lower limit of year-1 is obtained using the 99.9% confidence lower bound on the outflow velocity of km s-1. Note the outflow rate calculated assumes the gas is in equlibrium, if the gas is being accelerated then the actual rate may differ.
PDS 456 is an extremely luminous quasar with a bolometric luminosity of erg s-1 and a black hole mass of assuming accretion occurs near the Eddington limit (Simpson et al., 1999; Reeves et al., 2000). The mass accretion rate for PDS 456, given by , is year-1, for an efficiency of . Thus it seems likely the outflow rate is of the same order as the mass accretion rate in PDS 456. Similarly the kinetic output of the outflow in PDS 456 is large, about erg s-1 corresponding to 10% of the bolometric output of the quasar. The high velocity also implies that the outflow is likely to be driven from the accretion disk at a fairly small radius. For a Keplerian disk, the launch radius for the outflow is simply , where is the escape velocity of the material. Assuming that (although some acceleration of the matter will probably occur), this implies that the outflow in PDS 456 is launched from a radius of (about cm for a M⊙ black hole). Indeed the launch radius may be smaller if the gas is not in simple equilibrium.
PDS 456 appears to be in a small but growing group of AGN to show extreme absorption properties in the iron K-shell band. The lensed BAL quasar APM 08279+5255 has been found to exhibit iron K absorption lines and/or edges (Chartas et al., 2002; Hasinger, Schartel & Komossa, 2002) in both Chandra and XMM-Newton observations. A similar absorber has also been reported in the BAL quasar PG 1115+080 (Chartas, Brandt & Gallagher, 2003). The outflow velocities are similar to PDS 456, in the range . Given this apparent association between high velocity X-ray outflowing gas and the UV BALs, one may predict to see BAL features in the UV spectrum of PDS 456. Indeed a HST-STIS spectrum of PDS 456 (O’Brien et al. 2003, in preparation) reveals that there may be cooler gas in the outflow; a BAL is seen in Lyman- with an outflow velocity of 12000 – 22000 km s-1, whilst the C IV emission line is also blue-shifted by km s-1. Thus PDS 456 may just reside at the extreme end of the BAL quasar population (Turnshek et al., 1988; Weymann et al., 1991).
Similar highly ionized X-ray outflows have recently been discovered in the non-BAL radio-quiet quasars PG 1211+143 and PG 0844+349 (Pounds et al., 2003a, b), suggesting that these properties are not unique to UV identified BAL quasars. We also note that strong iron K absorption has also been observed in the NLS1s 1H 0707-495 and IRAS 13324-3809 (Boller et al., 2002, 2003) and also in some X-ray binaries, e.g. GRS 1915+105 (Lee et al., 2002), GX 13+1 (Sidoli et al., 2002), X 1624-490 (Parmar et al., 2002). In the quasars PDS 456, PG 1211+143 and PG 0844+349, the X-ray columns are near to cm-2, the outflow velocities measured are , whilst the ionizations are also similar (). Using PG 1211+143 as an example, King & Pounds (2003) have recently demonstrated, for radiatively driven outflows, that objects accreting near to the Eddington rate are likely to contain massive () Compton-thick winds. Indeed when the outflow rate is of the same order as the accretion rate, the flow can become optically thick at . This can account for both the high columns and velocities of the X-ray outflows, as well as provide a natural source of thermalized photons for the UV and soft X-ray excesses observed in these quasars.
However other scenarios are possible, for instance Reeves et al. (2002) recently used a magnetic flare model to explain the rapid X-ray variability in PDS 456, through coherent flaring events occuring when the accretion rate is close to Eddington. Indeed it is conceivable that the outflowing matter in PDS 456 is the ejecta associated with these flares. Interestingly the output of the magnetic events ( erg s-1) in PDS 456 is very similar to the kinetic power of the outflow, so this scenario seems energetically plausible. Overall the extreme properties of the outflow in PDS 456 seem linked to its high accretion rate (Reeves et al., 2000), which appears to drive the energetics of its unusually massive outflow.
5 Acknowledgments
This paper is based on observations obtained with XMM-Newton, an ESA science mission with instruments and contributions directly funded by ESA Member States and the USA (NASA). We thank Ken Pounds and Andrew King for discussions and Kim Page for performing spectral fits. James Reeves thanks the Leverhulme Trust for their support.
References
- Boller et al. (2002) Boller, Th., et al. 2002, MNRAS, 329, 1
- Boller et al. (2003) Boller, Th., Tanaka, Y., Fabian, A.C., Brandt, W.N., Gallo, L., Anabuki, N., Haba, Y., & Vaughan, S. 2003, MNRAS, in press (astro-ph/0305239)
- Bottorff et al. (1997) Bottorff, M.C., Korista, K.T., Shlosman, I., & Blandford, R.D. 1997, ApJ, 479, 200
- Chartas et al. (2002) Chartas, G., Brandt, W.N., Gallagher, S.C., & Garmire, G.P. 2002, ApJ, 579, 163
- Chartas, Brandt & Gallagher (2003) Chartas, G., Brandt, W.N., & Gallagher, S.C. 2003, ApJ, in press (astro-ph/0306125)
- Dickey & Lockman (1990) Dickey, J.M., & Lockman, F.J. 1990, ARA&A, 28, 215
- Hasinger, Schartel & Komossa (2002) Hasinger, G., Schartel, N., & Komossa, S. 2002, ApJ, 573, L77
- Kallman et al. (1996) Kallman, T., Liedahl, D., Osterheld, A., Goldstein, W., & Kahn, S. 1996 ApJ, 465, 994
- King & Pounds (2003) King, A., & Pounds, K.A. 2003, MNRAS, submitted (astro-ph/0305541)
- Laor (1991) Laor, A. 1991, ApJ, 376, L90
- Lee et al. (2002) Lee, J., Reynolds, C.S., Remillard, R., Schultz, N., Blackman, E.G., & Fabian, A.C. 2002, ApJ, 567, 1102
- Murray et al. (1995) Murray, N., Chiang, J., Grossman, S.A., & Voit, G.M. 1995, ApJ, 451, 498
- Parmar et al. (2002) Parmar, A., Oosterbroek, T., Boirin, L., & Lumb, D. 2002, A&A, 386, 910
- Pounds et al. (2003a) Pounds, K.A., Reeves, J.N., King, A., Page, K., & O’Brien, P.T. 2003a, MNRAS, in press (astro-ph/0303603)
- Pounds et al. (2003b) Pounds, K.A., King, A., Page, K., & O’Brien, P.T. 2003b, MNRAS, submitted (astro-ph/0305571)
- Proga, Stone & Kallman (2000) Proga, D., Stone, J.M., & Kallman, T. 2000, ApJ, 543, 686
- Reeves et al. (2000) Reeves, J.N., O’Brien, P.T., Vaughan, S., Law-Green, D., Ward, M., Simpson, C., Pounds, K.A., & Edelson, R. 2000, MNRAS, 312, L17
- Reeves et al. (2002) Reeves, J.N., Wynn, G., O’Brien, P.T., & Pounds, K.A. 2002, MNRAS, 336, L56
- Sidoli et al. (2002) Sidoli, L., Parmar, A., Oosterbroek, T., & Lumb, D. 2002, A&A, 385, 940
- Simpson et al. (1999) Simpson, C., Ward, M., O’Brien, P.T., & Reeves, J.N. 1999, MNRAS, 303, L23
- Struder et al. (2001) Struder, L., et al. 2001, A&A, 365, L18
- Thorne (1974) Thorne, K.S. 1974, ApJ, 191, 507
- Torres et al. (1997) Torres, C.A.O., et al. 1997, ApJ, 488, L19
- Turner et al. (2001) Turner, M.J.L., et al. 2001, A&A, 365, L27
- Turnshek et al. (1988) Turnshek, D.A., Grillmair, C.J., Foltz, C.B., & Weymann, R.J. 1988, ApJ, 325, 651
- Voges et al. (1999) Voges, W., et al. 1999, A&A, 349, 389
- Weymann et al. (1991) Weymann, R.J., Morris, S.L., Foltz, C.B., & Hewett, P.C. 1991, ApJ, 373, 23