Low Mass X-ray Binaries and Globular Clusters in Early-Type Galaxies
Abstract
A high fraction of the Low Mass X-ray Binaries (LMXBs) in early-type galaxies are associated with globular clusters (GCs). Here, we discuss the correlations between LMXBs and GCs in a sample of four early-type galaxies with X-ray source lists determined from Chandra observations. There is some evidence that the fraction of LMXBs associated with globular clusters () increases along the Hubble sequence from spiral bulges (or spheroids) to S0s to Es to cDs. On the other hand, the fraction of globular clusters which contain X-ray sources appears to be roughly constant at %. There is a strong tendency for the X-ray sources to be associated with the optically more luminous GCs. However, this correlation is consistent with a constant probability of finding a LMXB per unit optical luminosity; that is, it seems to result primarily from the larger number of stars in optically luminous GCs. The probability of finding a bright LMXB per unit optical luminosity in the GCs is about LMXBs per for erg s-1 (0.3–10 keV) and rises to about LMXBs per at lower X-ray luminosities, erg s-1. This frequency appears to be roughly constant for different galaxies, including the bulges of the Milky Way and M31. There is a tendency for the X-ray sources to be found preferentially in redder GCs, which is independent of optical luminosity correlation. This seems to indicate that the evolution of X-ray binaries in a GC is affected either by the metallicity or age of the GC, with younger and/or more metal rich GCs having more LMXBs. There is no strong difference in the X-ray luminosities of GC and non-GC LMXBs. There is a weak tendency for the brightest LMXBs, whose luminosities exceed the Eddington luminosity for a 1.4 neutron star, to avoid GCs. That may indicate that black hole X-ray binaries are somewhat less likely to be found in GCs, as seems to be true in our Galaxy. On the other hand, there are some luminous LMXBs associated with GCs. There is no clear evidence that the X-ray spectra or variability of GC and non-GC X-ray sources differ. We also find no evidence for a difference in the spatial distribution of GC and non-GC LMXBs. Many of these results are similar to those found in NGC 1399 and NGC 4472 by Angelini et al. and Kundu et al., respectively.
1 Introduction
X-ray observations since the time of the Einstein Observatory have shown that early-type galaxies are often luminous X-ray sources (e.g., Forman, Jones, & Tucker, 1985). For the X-ray-luminous early-type galaxies (defined as those having a relatively high ratio of X-ray to optical luminosity ), it is clear that the bulk of the X-ray luminosity is from hot ( K) interstellar gas. On the other hand, recent Chandra observations have resolved most of the X-ray emission in the X-ray-faint early-type galaxies into individual point-like sources (e.g., Sarazin, Irwin, & Bregman, 2000, 2001). Given their properties and the stellar populations in these galaxies, these X-ray sources are assumed to be Low Mass X-ray Binaries (LMXBs). LMXBs are also observed in Chandra observations of X-ray-luminous early-type galaxies, and often dominate the X-ray emission at hard X-ray energies (e.g., Kraft et al., 2000; Angelini, Loewenstein, & Mushotzky, 2001).
Chandra observations of early-type galaxies have shown that a significant fraction (20-70%) of the LMXBs are associated with globular clusters in the host galaxies (Sarazin et al., 2000, 2001; Angelini et al., 2001; Kundu et al., 2002). The fraction of LMXBs located in GCs is much higher than the fraction of optical light, which indicates that nondegenerate stars in GCs are much more likely (by a factor of 300) to be donor stars in X-ray binaries than field stars. As has been known for a number of years, a similar result applies to our own Galaxy and to the bulge of M31 (Katz, 1975; Hertz & Grindlay, 1983; White et al., 1995). This is generally believed to result from stellar dynamical interactions in globular clusters, which can produce compact binary systems (Clark, 1975; Fabian, Pringle, & Rees, 1975; Hills, 1976).
X-ray observations with ASCA indicate that the total luminosity of LMXBs in early-type galaxies correlates better with the number of GCs than with the optical luminosity of the galaxy (White, Sarazin, & Kulkarni, 2002). The correlation is consistent with the total X-ray luminosity of LMXBs being proportional to the number of GCs. This is somewhat surprising, as a nontrivial fraction (%) of the LMXBs in most of the early-type galaxies observed so far with Chandra are not identified with GCs. This suggests that most (perhaps all?) of the LMXBs in early-type galaxies were made in GCs (Grindlay, 1984; Sarazin et al., 2001; White et al., 2002). The field LMXBs might have been ejected from globular clusters by kick velocities resulting from supernovae, by stellar dynamical processes, or by the dissolution of the globular due to tidal effects. If this is true, then the field LMXBs are a useful record of the total globular cluster populations and of the history of globular cluster destruction in galaxies.
Alternatively, if field LMXBs are not generally made in GCs, then one might expect field LMXBs and GC LMXBs to have different properties. Presumably, the stars in field LMXBs are formed in binaries, and evolve independently (i.e., they are not affected by their environment). As evidenced by the high X-ray to optical ratio of GCs, LMXBs in GCs are strongly affected by dynamical interactions within the GC. For example, it has been argued that it is difficult for GCs to retain LMXBs with massive black holes (BHs), which may be ejected by dynamical interactions (e.g., Portegies Zwart & McMillan, 2000), which is consistent with the fact that there are presently no BH LMXBs identified with GCs in our own Galaxy. Thus, one might expect very luminous LMXBs to avoid GCs in early-type galaxies.
One might also expect LMXBs in different GCs to be affected by differences in their GC environment. This might occur because of differences in the ages or metallicities of different GCs, which might affect the evolution of individual LMXBs. Alternatively, differences in stellar densities would change the rates of stellar dynamical interactions.
In this paper, we give a preliminary analysis of the correlations of GC LMXBs and non-GC LMXBs, and of the differences between X-ray GCs and non-X-ray GCs in early-type galaxies. This analysis should be viewed as preliminary because of the small size and incompleteness of the existing samples. At present, only a relatively small number of early-type galaxies have been observed with Chandra. The spatial resolution of Chandra is needed to separate LMXBs at the distance of the Virgo cluster, where most of the nearby early-type galaxies are located. Moreover, most of the galaxies observed with Chandra so far are X-ray bright galaxies. In these galaxies, bright diffuse emission from hot gas makes it difficult to detect LMXBs near the center of the galaxy (e.g., Angelini et al., 2001). The optical samples of GCs also are incomplete. Ground-based observations have difficulty in detecting GCs near the centers of early-type galaxies, where they are blended into the diffuse optical emission from the galaxy. Thus, ground-based GC samples tend to be restricted to the outer parts of the galaxies, which is not where most of the LMXBs are located. Also, ground-based observations do not generally resolve GCs at the distance of the Virgo cluster. Thus, there is a significant chance that ground-based GCs detected in the outer parts of early-type galaxies may actually be foreground or background objects. GC observations with the Hubble Space Telescope (HST) are greatly preferable, as the resolution of HST allows GCs to be detected in the inner regions of galaxies, and slightly resolves them. However, some of the galaxies with the best X-ray data have no HST GC observations (e.g., NGC 4697). Also, the field of view of a single Wide Field Planetary Camera 2 (WFPC2) observation is smaller than the angular size of early-type galaxies at the distance of the Virgo cluster. Multiple pointings with the WFPC2 (e.g., Kundu et al., 2002) or with the recently installed Advanced Camera for Surveys (ACS) may improve this situation.
Because the GC observations of most galaxies do not cover the entire galaxy, we will restrict our analysis to the LMXBs located in the regions covered by the GC sample. We will also restrict our discussion to the relative properties of GC LMXBs and non-GC LMXBs, and of X-ray GCs and non-X-ray GCs. Hopefully, comparing the relative properties of these samples within the spatial regions they share should reduce most of the selection effects in these incomplete samples, particularly as the LMXBs were detected solely by their X-ray properties and the GC were detected solely by their optical properties. All other things being equal, there is no reason why a LMXB in a GC is any more or less detectable in the X-ray than a field LMXB. Because of the irregular spatial regions covered by the GC samples, we will concentrate on the intrinsic properties of the sources rather than their spatial distribution.
Our galaxy sample, X-ray source lists, and the detection limits for the LMXBs are discussed in § 2. The statistics of occurrence of LMXBs in the galaxies are given in § 3. The relative properties of GC and non-GC LMXBs are analyzed in § 4, while the relative characteristics of X-ray and non-X-ray GCs are determined in § 5. In § 6, we briefly discuss the relative spatial distributions of the samples. We discuss our results and summarize our conclusions in § 7.
2 Sample
Table Low Mass X-ray Binaries and Globular Clusters in Early-Type Galaxies lists some of the properties of the early-type galaxies in our sample. The first five columns give the name, Hubble type, Galactic absorbing column (Dickey & Lockman, 1990), effective radius , and distance . For consistency, all of the distances for these galaxies are taken from Tonry et al. (2001), based on the method of surface brightness fluctuations. For these galaxies, the statistical error in their distance modulus is generally about 0.17, leading to an error in the distance of 8%. There also is a systematic error (which would affect all of the galaxies by the same factor) of about 8% in the distance.
The last 5 columns in Table Low Mass X-ray Binaries and Globular Clusters in Early-Type Galaxies give the useful exposure time in the Chandra X-ray image, the minimum detectable source count rate, and the minimum detectable X-ray luminosity in the 0.3–10 keV band, and the references for the original papers giving the detections of the LMXBs and the GCs. The criteria for the detection of the X-ray sources are discussed in detail in our original papers on the X-ray observations. These papers also list the properties, including the count rates, for each of the sources. In every case, a wavelet detection algorithm (ciao wavdetect111See http://asc.harvard.edu/ciao/. program), was used to detect the sources, with a significance threshold of . This implies that 1 false source (due to a statistical fluctuation in the background) would be detected in the entire S3 image. We further restricted the sources by requiring sufficient source counts to determine the source flux at the level. In general, this implies that the minimum detectable sources had 10 net counts.
For the Virgo cluster galaxies, some of the X-ray sources have been identified with outer globular clusters from the lists given by Hanes (1977). In general, less information is available for these outer globulars. Also, there is a higher chance that the globulars and X-ray sources at large distances from the centers of the galaxies are actually foreground or background objects. Thus, we haven’t included these globulars and the associated X-ray sources in our sample.
Table 2 lists some of properties of the X-ray sources in the region covered by the GC surveys. More detailed information is given in the original references on the X-ray detections, which are listed in Table Low Mass X-ray Binaries and Globular Clusters in Early-Type Galaxies. Table 2 gives the galaxy, the source number from the tables in the original references, the net X-ray count rate and error in the 0.3–10 keV band, the X-ray luminosity in the same band (§ 5.1 below), the X-ray hardness ratios and (§ 5.2 below), an indication of whether the source was found to be variable (§ 5.3 below), a check if the source was identified with a GC, the I-band absolute magnitude of the GC (§ 4.1 below), and the color of the GC (§ 4.2 below). The last column has a check if the source belongs to an X-ray luminosity limited complete sample which is defined in § 2.5 below.
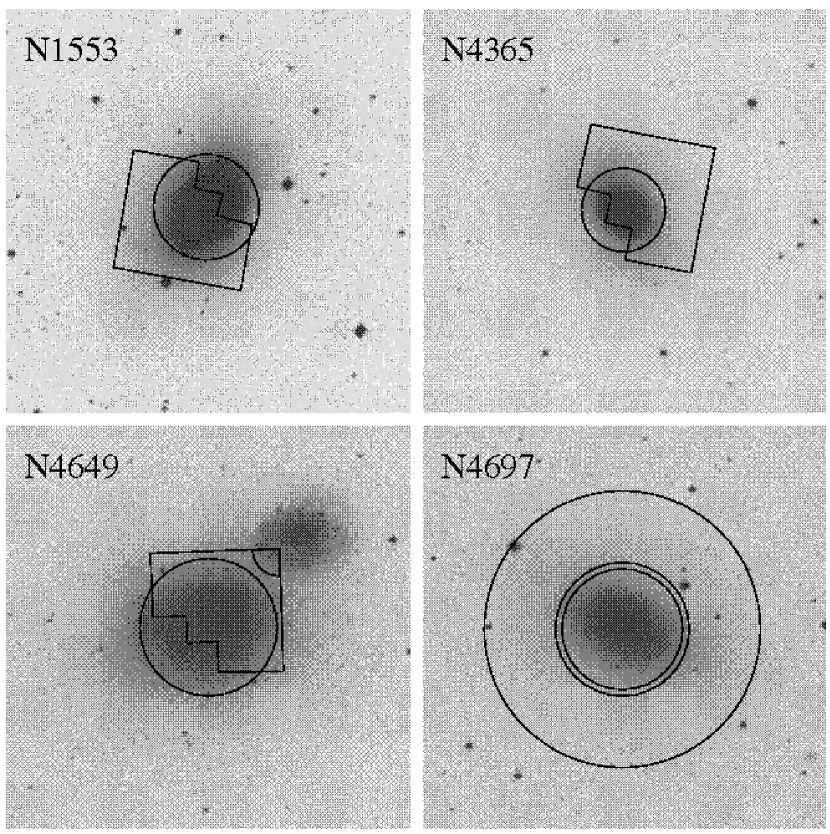
Figure 1 shows the regions surveyed to detect GCs in these galaxies. These are compared to the circle with a radius of one effective radius.
2.1 NGC 1553
The globular cluster identifications in NGC 1553 come from a survey of globulars in S0 galaxies with the HST Wide Field / Planetary Camera 2 (WFPC2; Kundu & Whitmore, 2001b). This GC sample included the nucleus of the galaxy and the inner parts of the galaxy to the southeast of the nucleus, out to a radius of about 2′ (Fig. 1).
The X-ray sources were published in Blanton et al. (2001). We adjusted the values of the X-ray luminosities to be consistent with the new distance to this galaxy (Tonry et al., 2001). We excluded the central X-ray source (Src. 1, CXOU J041610.5554646) because it is the central active galactic nucleus (AGN). Srcs. 2 (CXOU J041609.9554646) and 6 (CXOU J041611.7554652) were excluded because they are located near the center of the galaxy and 1-2″ from several globular cluster positions. This is too large a separation for a definite identification in this crowded region, so we were uncertain whether to associate these sources with the GCs or not.
The globular cluster identifications are discussed in Blanton et al. (2001). We used the position of the central AGN, which is present in both the HST optical and Chandra X-ray images, to register the two images, assuming a simple shift. This required an offset of 19. [We also registered the images individually by comparison to accurate optical positions from the U.S. Naval Observatory A2.0 optical catalog (USNOA2 Monet D., et al., 1998) and the Two Micron All Sky Survey (2MASS Cutri et al., 2001). This indicated that both the Chandra and HST positions were off by 15, and that the relative offset was the combination of these systematic errors.] Three potential GCs were found to agree in position with LMXBs to within 05. Based on simulations of the distributions of GCs and LMXBs, the expected number of random associations would be about 0.05. However, one of the potential GCs had a very blue color, and was dropped from the sample using the criteria for GC identifications given in Kundu & Whitmore (2001b).
2.2 NGC 4365
Sivakoff, Sarazin, & Irwin (2003) have determined the X-ray source population in NGC 4365. The globular cluster population is from an HST WFPC2 survey of elliptical galaxies by Kundu & Whitmore (2001a). This GC sample included the nucleus of the galaxy and the inner parts of the galaxy to the northwest of the nucleus, out to a radius of about 2′ (Fig. 1). We found an offset of about 13 between the HST and Chandra positions. After removing this offset, 18 X-ray sources were found to lie within 102 of a GC. Simulations of the distributions of GCs and LMXBs indicate that about 0.6 associations would be expected at random. One additional association was found between a LMXB and a GC in the short list of clusters with spectroscopy recently published by Larsen et al. (2003). However, it is outside of the region covered by the GC survey in Kundu & Whitmore (2001a), and we haven’t included this source in the present study.
2.3 NGC 4649
The X-ray sources in NGC 4649 (M60) have been published in Randall, Sarazin, & Irwin (2003). As with NGC 4365, the globular cluster sample here is from Kundu & Whitmore (2001a). This sample included the nucleus of the galaxy and the inner parts of the galaxy to the northwest of the nucleus, out to a radius of about 2′ (Fig. 1). At the northwest corner of the WFPC2 field, there is a high density of globular clusters which are probably associated with the companion Sc galaxy NGC 4647. Because we wish to study the LMXB population in early-type galaxies, we have excluded this region from our sample. We found an offset of 09 between the HST and Chandra positions. After correcting for this offset, 22 GCs associated with NGC 4649 were found to coincide with X-ray sources to better than 087. Based on simulations of the distributions of GCs and LMXBs, the expected number of random associations would be about 2.96, so a few of these identification may be spurious. NGC 4649 is an X-ray bright elliptical galaxy (the only one in our sample). Unfortunately, the bright X-ray emission by interstellar gas makes it difficult to detect faint sources near the center of the galaxy, and the LMXB source list is incomplete within approximately 70″ of the center of NGC 4649. This X-ray incompleteness may reduce the detected fraction of GCs containing X-ray sources, . Ideally, one would exclude this region from our sample, but this would leave almost no area of the galaxy which was on the WFPC2 image, beyond 70″, and not confused with the companion NGC 4647. Since our primary aim is a comparative study of globular cluster and non-globular cluster LMXBs, we have included all of the covered area of the galaxy. We exclude X-ray Src. 1 (CXOU J124340.0+113311), which is an extended feature due to structure in the diffuse gaseous emission.
2.4 NGC 4697
The X-ray source population of NGC 4697 has been analyzed and listed in Sarazin et al. (2000, 2001). We adjusted the values of the X-ray luminosities to be consistent with the new distance to this galaxy (Tonry et al., 2001). The X-ray observation was done in Chandra Cycle-1 at a time when significant absolute errors in positions occurred. Thus, the X-ray image was registered by comparing the positions of X-ray sources with optical identifications (not the GC discussed below) to optical positions from the USNOA2 catalog (Monet D., et al., 1998). This required an offset of about 26. Following this correction, the X-ray and optical positions agreed to better than 03. Subsequently, 2MASS (Cutri et al., 2001) positions became available for several X-ray sources with optical IDs, and these confirmed the offset and corrected accuracy of the X-ray positions.
The globular cluster sample for NGC 4697 comes from an unpublished, ground-based ccd survey very kindly provided by J. Kavelaars (2000, private communication). These globulars are all located in a circular annular region extending from about 15 to 25 from the center of NGC 4697 (Fig. 1). Seven of the X-ray sources were found to lie within 078 of X-ray sources. From simulations based on the distribution of LMXBs and GCs, we would expect 0.18 associations to occur at random. Although the GCs are not resolved in these ground-based observations, this sample doesn’t extend to a large enough projected distance that an important fraction of the GCs are likely to actually be background AGN or foreground stars. It is difficult to detect globular clusters in the central regions of early-type galaxies with ground-based observations because of the effects of seeing and the high surface brightness of the galaxy. The available data on NGC 4697 do not include colors for the globular clusters, so these GCs will not be used for looking for trends with color. Also, the magnitudes for the NGC 4697 GCs were determined in the R-band, whereas the three other galaxies used the V and I bands. For comparison, we converted the R magnitudes to I magnitudes assuming that , which is appropriate for the average color of the GCs in the other galaxies. We also increased the errors to include a systematic error on this conversion.
2.5 Combined Samples
In this paper, we will discuss some of the properties of the LMXBs and associated GCs in the individual galaxies. However, our primary aim is to compare LMXBs and GCs in the sample formed by combining the galaxies. We will consider two combined samples. First, we will consider an X-ray luminosity limited sample (“ complete”) of sources whose X-ray luminosities exceed erg s-1 in the 0.3–10 keV band, which is the highest detection limit for the galaxies in the sample (Table Low Mass X-ray Binaries and Globular Clusters in Early-Type Galaxies). In order to improve the statistics, we will also consider the sample formed by combining all of the sources, although this sample is not complete in the X-ray luminosity, However, we will restrict our discussion to the relative properties of GC LMXBs and non-GC LMXBs, and of X-ray GCs and non-X-ray GCs. Hopefully, comparing the relative properties of these samples within the spatial regions they share should reduce most of the selection effects in this incomplete sample, particularly as the LMXBs were detected solely by their X-ray properties and the GC were detected solely by their optical properties. All other things being equal, there is no reason why a LMXB in a GC is any more or less detectable in the X-ray than a field LMXB.
3 Statistics of Occurrence of LMXBs
The numbers of LMXBs and GCs in our sample are listed in Table 3. The first three columns give the galaxy name, the Hubble type, and the number of GCs in the surveyed region . The next five columns give the number of LMXBs in the same region , the number of LMXBs coincident with GCs , the fraction of LMXBs identified with GCs , the fraction of GCs associated with LMXBs , and the number of LMXBs in GCs divided by their total optical luminosity. The LMXBs included in these columns are only those in the complete sample ( erg s-1 in the 0.3–10 keV band). The errors listed are 1–; errors on fractions are derived assuming a binomial distribution. The next five columns repeat the statistics for the full sample of LMXBs.
Note that the elliptical galaxies in our sample all have a similar fraction of LMXBs in GCs (%). The value for NGC 4697 in the complete sample is larger, but the errors are very big because of the small number of sources. In any case, the hypothesis that the number of LMXBs in GCs in NGC 4697 was drawn from the same distribution as that of the other ellipticals can only be rejected at the 57% confidence level. In the full sample, the fraction in NGC 4697 is in good agreement with those of the other ellipticals. A similar fraction was found for the X-ray bright elliptical NGC 4472 by Kundu et al. (2002).
Although the statistics are very poor, the fraction in the one S0 galaxy in our sample (NGC 1553) is lower, %. We tested the hypothesis that the number of LMXBs in GCs in NGC 1553 was drawn from the same distribution as that for the elliptical galaxies, and found that it could be rejected at the 99% confidence level. The fraction in spiral bulges or spheroids appears to be even lower, (e.g., Verbunt & van den Heuvel, 1995). For example, in our Galaxy there are 14 LMXBs which have been associated with GCs (White et al., 1995; Harris, 1996; Liu et al., 2001; White & Angelini, 2001) out of a total of about 150 LMXBs. This would suggest that %. However, most of the LMXBs seen in our Galaxy are much too faint to have been detected in distant galaxies. In the Milky Way, there are very few LMXBs with persistent X-ray luminosities as high as those for our complete sample. So, we instead compare to the fraction seen in NGC 4697, where the luminosity limit is erg s-1. If we limit the sample to sources which are more luminous than this for periods of many hours (i.e., not the burst luminosity), then the fraction is very roughly %. At similar luminosity levels, the fraction of bulge or spheroid X-ray sources in M31 which are identified with GCs is about 20% (Primini, Forman, & Jones, 1993; Supper et al., 1997; Barmby & Huchra, 2001; Di Stefano et al., 2002). On the other hand, Angelini et al. (2001) report a fraction of 70% in NGC 1399, the cD galaxy at the center of the Fornax cluster. Although the number of galaxies tested so far is small and the statistics in most of the galaxies are poor, all of this is consistent with an increase in along the Hubble sequence from spiral bulges to S0s to Es to cDs. The specific frequency of globular clusters (the number per unit galaxy luminosity) also increases along the same sequence (e.g., Harris, 1991).
There is no clear trend in the fraction of GCs containing X-ray sources () with Hubble-type. All of our galaxies are roughly consistent with about 3.3% of the GCs hosting luminous LMXBs at the luminosity level of the complete sample ( erg s-1 in the 0.3–10 keV band). At lower luminosity levels, the fraction appears to increase to about 4%. Similar numbers are found for the spiral bulge or spheroid of our Galaxy and M31 (e.g., Harris, 1996; Barmby & Huchra, 2001; Liu et al., 2001; Di Stefano et al., 2002). If we compare to the fraction seen in NGC 4697, where the luminosity limit is erg s-1, we find that roughly . Since many of the LMXBs are highly variable, and catalogs for our Galaxy include sources detected at different times, it is not clear how many of these sources could be detected in a single hour observation with Chandra if our Galaxy were at the distance of the Virgo cluster. In the bulge of M31, the fraction of GCs containing LMXBs with erg s-1 is about 2% (e.g., Barmby & Huchra, 2001; Di Stefano et al., 2002). Similar fractions have been found for the elliptical galaxy NGC 4472 (Kundu et al., 2002), and for the galaxy NGC 1399 at the center of the Fornax cluster (Angelini et al., 2001). In fact, Kundu et al. (2002) argued that was constant at about 4% in a wide range of galaxies. This fraction may provide a constraint on the duty cycle of quiescence vs. X-ray brightness in the LMXBs in GCs.
One concern with the fraction is that it may be affected by incompleteness in the detection of faint GCs. Luminosity functions of globular clusters in early-type galaxies are often well fit by log-normal functions (e.g., Harris, 1991); for such a luminosity distribution, faint GC may contribute to the number of GCs, but do not add significantly to the total luminosity. Below, we will find that LMXBs are preferentially associated with more luminous GCs, but that the probability of finding a LMXB in a GC is roughly proportional to its optical luminosity. Thus, a more useful measure of the abundance of LMXBs in GCs may be the number per unit optical luminosity, which should be less sensitive to incompleteness or to the details of the luminosity function of GCs in each galaxy. This is given as the last numerical column in Table Low Mass X-ray Binaries and Globular Clusters in Early-Type Galaxies. For the entire sample of four galaxies, the total value is LMXBs per in the complete sample and LMXBs per in the full sample. To within the errors, all of the galaxies are consistent with this value. At luminosities erg s-1 (2–10 keV), the corresponding value for our Galaxy is about LMXBs per .
4 GC Properties of LMXBs
4.1 Luminosities
Figure 2 shows histograms of the absolute I magnitude, , of the total GC sample (upper histogram) and of the GCs containing LMXBs (shaded histogram) for the complete sample (left) and the full source sample (right). The results for the individual galaxies NGC 4365 and NGC 4649 are shown in Figure 3. In NGC 1553 and NGC 4697, there are too few LMXBs associated with GCs to allow a useful comparison. All of the magnitudes were corrected for Galactic extinction.
The LMXBs seem to be associated preferentially with the more optically luminous GCs. For example, the median values of for non-X-ray GCs are ( complete sample), (full sample), (NGC 4365), and (NGC 4649), while the corresponding values for the X-ray GCs are ( complete sample), (full sample), (NGC 4365), and (NGC 4649). Using the Wilcoxon or equivalent Mann-Whitney rank-sum tests (Mann & Whitney, 1947), the distribution of X-ray and non-X-ray luminosities are found to disagree at more than the 5 ( complete sample), 6 (full sample), 4 (NGC 4365), and 5 (NGC 4649), with the probability that they are drawn from the same distribution being ( complete sample), (full sample), (NGC 4365), and (NGC 4649). We also compared the distributions of X-ray and non-X-ray GC absolute magnitudes using the Kolmogorov-Smirnov (KS) two-sample test. The probability that they were drawn from the same distribution is less than ( complete sample), (full sample), (NGC 4365), (NGC 4649). Thus, the X-ray sources are strongly correlated with the brighter globular clusters. A similar result was found previously for the galaxy NGC 1399 by Angelini et al. (2001) and for NGC 4472 by Kundu et al. (2002).
Of course, a correlation between optical luminosity and the probability of having an X-ray source is not unexpected. LMXBs contain normal stars, and globular clusters which have higher luminosities have more stars as potential donors in LMXBs. Thus, it is interesting to test the hypothesis that the probability that a GC contains a LMXB is proportional to its optical luminosity. Figure 4 compares the cumulative probability distribution of LMXBs versus the cumulative distribution of the optical luminosity in GCs (for the complete sample). Both were accumulated starting at small (high optical luminosity) and going to higher (low luminosity). The optical luminosity is determined solely from the I-band absolute magnitude. The two cumulative distribution functions track one another fairly well. For example, half of the optical luminosity comes from GCs brighter than , while the medium absolute magnitude of GCs with LMXBs is . There is a slight tendency for the fainter GCs to have a higher probability to have an X-ray source per unit luminosity, but it is not statistically significant. However, the GC samples are incomplete at the faint end, and the completeness limit differs significantly from galaxy to galaxy in our sample. Although there is no obvious reason why this incompleteness would affect GCs with X-ray sources differently than those without LMXBs, this suggests caution in interpreting differences among faint GCs. We used a modified version of the KS two-sample test to compare the two distributions. The largest vertical difference in the cumulative distributions is , and this difference is not significant given the number of LMXBs. Very similar results were found for the full sample (albeit more strongly) and for NGC 4365 and NGC 4649 (but less strongly).
Thus, the current data indicate that optically bright GCs are much more likely to contain LMXBs than faint GCs, but the distribution is consistent with a constant probability per unit optical luminosity. A similar result was found previously for the galaxy NGC 4472 by Kundu et al. (2002). As noted in § 3, the probability of having a LMXB per unit optical luminosity of the GC also appears to be constant from galaxy to galaxy, with a value of about LMXBs per for erg s-1 (0.3–10 keV). The value rises to about LMXBs per at lower X-ray luminosities ( erg s-1).
4.2 Optical Colors
Figure 5 shows histograms of the colors for the total GC sample (upper histogram) and for the GCs containing LMXBs (shaded histogram) for the complete sample (left) and the full source sample (right). The colors are all corrected for Galactic reddening. Because these samples contain a mixture of three galaxies, the overall color distribution may be less obviously bimodal than that seen in some individual galaxies (e.g., Kundu et al., 2002). The results for the individual galaxies NGC 4365 and NGC 4649 are shown in Figure 6. As has been noted previously (e.g., Kundu et al., 2002), NGC 4649 has a bimodal color distribution, whereas NGC 4365 was a broad color distribution which is not clearly bimodal. In NGC 1553, there are too few LMXBs associated with GCs to allow a useful comparison, and no colors were available to us for the GCs in NGC 4697.
The LMXBs appear to be associated preferentially with the redder GCs (larger values of ), although the trend is not as strong as that for the absolute magnitude or optical luminosity (§ 4.1). The median colors of the non-X-ray GCs are ( complete sample), (full sample), (NGC 4365), and (NGC 4649), while the corresponding medians for the X-ray GCs are ( complete sample), (full sample), (NGC 4365), and (NGC 4649). Using the Wilcoxon or Mann-Whitney rank-sum tests, the probabilities that the distribution of X-ray and non-X-ray optical colors were drawn from the same distribution are ( complete sample), (full sample), (NGC 4365), and (NGC 4649), which correspond to differences of 2.1 ( complete sample), 2.9 (full sample), 1.7 (NGC 4365), and 2.5 (NGC 4649). Using the KS test, the probabilities that the two color distributions where drawn from the same distribution are ( complete sample), (full sample), (NGC 4365), and (NGC 4649). Thus, a significant trend for LMXBs to be associated with red GCs appears in the complete sample, in the full sample, and in NGC 4649. A similar correlation with the optical color of GCs was found previously for the galaxy NGC 1399 by Angelini et al. (2001) and for NGC 4472 by Kundu et al. (2002). The trend is less obvious in NGC 4365. Recent optical/IR observations of GCs in NGC 4365 indicate that this galaxy has both old and intermediate age (5 Gyr) red GCs (Puzia et al., 2002; Larsen et al., 2003), which may account for its broad but unimodal color distribution. The LMXBs seem to be preferentially associated with the younger red GCs (Sarazin et al., 2003).
A correlation between LMXBs and GC color might result from the correlation between LMXBs and the optical luminosity of GCs, if the brighter globular clusters were preferentially redder. Figure 7 shows the scatter diagram between the optical colors and absolute magnitudes for the GCs, with those associated with LMXBs in the complete sample indicated. Various correlation measures show no evidence for a significant statistical correlation between absolute magnitude and color. This test doesn’t take into account the various selection effects which went into constructing this sample; it only shows that there is no strong correlation between absolute magnitude and color within this sample. However, previous detailed optical studies, including selection effects, on the GCs in these and other early-type galaxies have found no significant correlation of color with optical luminosity (e.g., Kundu & Whitmore, 2001a).
The correlations between X-ray sources and GC color would seem to suggest that the evolution of X-ray binaries in GCs is affected either by the metallicity or age of the GC, with younger and/or more metal-rich GCs having more LMXBs.
5 X-ray Properties of GCs
5.1 X-ray Luminosities
Figure 8 shows histograms of the numbers of X-ray sources as a function of their X-ray luminosities for all of the sources (upper histogram) and for the sources associated with GCs. This figure is for the full sample, but the lower limit luminosity for the complete sample is also marked. Figure 9 shows the distribution of X-ray luminosities for the individual galaxies NGC 4365 and NGC 4649; NGC 1553 and NGC 4697 had too few GC-LMXBs to provide useful comparisons. The X-ray luminosities are in the band 0.3–10 keV and have been corrected for absorption. Although the statistical accuracy is limited by the small number X-ray sources, at most luminosity levels there is no obvious difference in the two distributions. However, there may be a tendency for the most X-ray-luminous sources to avoid GCs. In the complete sample. the rank sum test and KS test both find that the GC sources are fainter. The probability that the two populations are drawn from the same distribution can be rejected at the 97% level, corresponding to a difference of about 1.9.
It is generally found that the luminosity functions of X-ray sources in early-type galaxies have a broken power-law form, with a break luminosity of erg s-1 (e.g., Sarazin et al., 2001). This break luminosity is close to the Eddington luminosity of a 1.4 neutron star. As a result, Sarazin et al. (2000, 2001) have argued that the sources with predominantly contain black holes, while those below this luminosity may contain neutron stars. In the complete sample. 196% of LMXBs in GC have luminosities greater than erg s-1, while the fraction for the non-GC sources is 448% (1 error bars). Thus, the difference is somewhat significant.
Our results are similar to those found for the X-ray bright elliptical galaxy NGC 4472 by Kundu et al. (2002), who found no significant difference in the X-ray luminosities of GC and non-GC sources. On the other hand, Angelini et al. (2001) found that the brightest X-ray sources in NGC 1399 were mainly associated with GCs, which is the opposite of the weak tendency we find.
5.2 X-ray Hardness Ratios
We used hardness ratios or X-ray “colors” to crudely characterize the spectra of the sources. We defined two hardness ratios as
| (1) | |||||
| (2) |
where , , and are the total counts in the soft (0.3–1 keV), medium (1–2 keV), and hard (2–10 keV) bands, respectively. Although all of the galaxies lie in directions with low Galactic absorbing columns (Table Low Mass X-ray Binaries and Globular Clusters in Early-Type Galaxies), there is a small variation in the absorption towards the different galaxies. Thus, we have corrected the hardness ratio to remove the effects of Galactic absorption. Let , , and be the soft, medium, and hard band counts, corrected for absorption. We define , and . Then, the absorption-corrected hardness ratios are
| (3) | |||||
| (4) |
We calculated the corrections assuming a single spectrum for all of the sources, which we took to be 7 keV thermal bremsstrahlung. The corrections are smaller than the errors in the hardness ratios for almost all of the sources, and the differences in the corrections from galaxy to galaxy are even smaller.
In Figure 10, we show the absorption-corrected hardness ratios for the sources with more than 20 net counts in the complete sample. The filled squares are the sources identified with GCs, while the open squares are non-GC sources. For comparison, the solid line shows the hardness ratios for power-law spectral models; the triangles indicate values of the power-law photon number index of (upper right) to 3.2 (lower left) in increments of 0.4. Although there are significant variations in spectra from source to source, on average the source spectrum can be fit by either thermal bremsstrahlung with a temperature of 7 keV or a power-law with a photon index plus Galactic absorption. The hardnesses ratios for the sources in the galaxies NGC 4365 and NGC 4649 are given separately in Figure 11. NGC 1553 and NGC 4697 had too few GC-LMXBs to provide useful comparisons.
Histograms of the and hardness ratios are given in Figure 12 for the complete sample. Considering both Figures 10 and 12, no very significant differences in the hardness ratios are evident. The rank-sum and KS tests suggest that the colors of the GC sources are slightly harder (larger ), but the difference is only significant at the 93% confidence level. The same tests indicate that the distributions are identical. Thus, there is no strong evidence that the spectra of the GC and non-GC sources differ in any systematic way. This agrees with the conclusions of Angelini et al. (2001) and Kundu et al. (2002) for NGC 1399 and NGC 4472, respectively.
There are two X-ray sources (one GC and one non-GC source) with hardness ratios of . It is likely that these X-ray sources are strongly self-absorbed. In some cases, such sources are found to be identified with background AGNs (e.g., Sarazin et al., 2000). However, both of these X-ray sources are projected within the central regions of NGC 4649, where the chance of finding a background source is low (due to the small solid angle involved). One might be concerned that the GC optical identification of one of the hard sources might actually be a background AGN. However, the identified GC has very normal red optical colors, which would be atypical (but not unheard of) for an AGN. This suggests that a small portion of the GC and non-GC X-ray sources may have strongly self-absorbed spectra.
In some early-type galaxies, “supersoft” sources have been found which have no X-ray emission at energies above 1 keV (e.g., Sarazin et al., 2000). These sources can be fit with 75 eV blackbody spectra. In terms of their spectra, these sources are similar to the many supersoft sources observed in our Galaxy and in M31 (e.g., Kahabka & van den Heuvel, 1997). In general, the Galactic supersoft sources are believed to be accreting white dwarf stars in binaries, with the luminosity due to steady nuclear burning. However, the supersoft sources found in distant early-type galaxies have very large bolometric luminosities which exceed the Eddington luminosity for a Chandrasekhar mass white dwarf. A similar bright supersoft source has been found in the bulge of M81 (Swartz et al., 2002). One hypothesis is that these sources contain intermediate mass () accreting black holes (Swartz et al., 2002). It is unfortunate that there are no supersoft sources in the regions of these galaxies which are covered by the GC surveys, particularly as it has been suggested that intermediate mass black holes are produced in GCs (Miller & Hamilton, 2002).
5.3 X-ray Variability
During these Chandra observations lasting typically 10 hours, about 10% of the X-ray sources are found to vary significantly. Due to the weakness of the sources and some features of the detector used, only secular variations over the observation period (source turns on, turns off, or increases or decreases by a significant fraction) are detectable. Of the 111 LMXBs in our full sample, 9 varied significantly, of which 4 were in GCs. In the complete sample, 4 sources varied, of which 2 were in GCs. In the entire full sample, 44% of the LMXBs are in GCs. Within these very limited statistics, there is no evidence for a strong difference in the variability of GC and non-GC X-ray sources.
5.4 X-ray/Optical Correlations
Among the LMXBs which were located in GCs, we also searched for correlations between their X-ray properties (, , ) and the optical properties of the GCs in which they are situated. For example, Figure 13 shows the logarithm of the X-ray luminosity () plotted against the optical color () of the GC for sources in the complete sample. No significant correlations were found between any of the X-ray properties and any of the optical properties discussed here. The probabilities that the properties were uncorrelated were all 24% or greater for the various pairs of properties. One possible problem with these tests is the relatively small sample of only 49 LMXBs in GCs.
6 Spatial Distributions
As discussed in § 1, the available GC samples for these galaxies only cover a small fraction of the areas of the galaxies. As a result of this spatial incompleteness and possible position-dependent selection effects for both the GC and LMXBs, we will not analyze the spatial distribution functions of the GCs or LMXBs. Instead, we will only address the relative distributions of GC and non-GC LMXBs, and of X-ray and non-X-ray GCs. Also, we will only consider the radial distribution of sources. Because the galaxies have differing eccentricities, it would be difficult to compare their azimuthal distributions. In order to improve the statistics by combining the data from all of the galaxies, we will scale the projected radius of each source by the effective radius for its host galaxy. The adopted values of are given in Table 1. The references are given in the papers containing the X-ray data.
6.1 Distribution of LMXBs
We first compare the spatial distributions of GC and non-GC X-ray sources. Figure 14 shows histograms of the spatial distributions of these two types of LMXBs for the complete sample. There is a slight tendency for the GC LMXBs to be located at larger radii than the non-GC LMXBs, but it is not very significant. The median radii of the GC and non-GC LMXBs are 0.65 and 0.49 , respectively. Using the Wilcoxon or Mann-Whitney rank-sum test or the KS test, the probability that the two samples were drawn from the same radial distribution can only be rejected at the 93% level. In the full sample, this trend is even weaker. The individual galaxies in our sample have too few sources to allow useful comparisons. Kundu et al. (2002) found that the spatial distributions of GC and non-GC X-ray sources were similar in NGC 4472.
6.2 Distribution of GCs
Next, we compared the radial distributions of GCs either containing or not containing LMXBs. Figure 15 shows histograms of the spatial distribution of X-ray and non-X-ray GCs in the complete sample. There appears to be some tendency for the X-ray GCs to be located at smaller radii. The median radius of the X-ray GCs is 0.67 , while that for the non-X-ray GCs is 1.00 . The rank-sum test indicates that the radii of the X-ray GCs are smaller, with a probability that they were drawn from the same distribution of 0.3%. Similarly, the KS test finds that the probability that the distributions are identical is about 0.5%. Similar results are found for the full sample, and in each of the individual galaxies, although the statistics for individual galaxies are poor. Figure 16 shows histograms of the spatial distribution of X-ray and non-X-ray GCs in NGC 4365 and in NGC 4649. In NGC 4649 and in NGC 4697, the ranges of radii covered (in terms of ) are both small, in NGC 4649 because the value of in large in angular units (Table Low Mass X-ray Binaries and Globular Clusters in Early-Type Galaxies) and in NGC 4697 because the GCs are all in an annulus at larger radii (Figure 1).
Thus, there is at least marginal evidence that the X-ray GCs are more centrally located than the non-X-ray GCs. Kundu et al. (2002) found a similar effect in NGC 4472. Since the X-ray globular clusters are brighter and redder than the non-X-ray GCs, this weaker radial trend might be due to these other stronger correlations, and to a radial trend in the absolute magnitudes or colors of GCs within our sample. Indeed, we find that there is a correlation between GC optical luminosity or color and radius, with the brighter and redder GCs being more likely to be found at smaller radii. The optical luminosity gradient is certainly, at least in part, a selection effect, since it is harder to see faint GC near the center of the host galaxy. Other selection effects might be introduced by differing absolute magnitude limits and differing radial coverage in each galaxy. In light of various selection effects in the raw data (e.g., the radial variation of incompleteness in the detection limits of GCs, which differs from galaxy to galaxy), and the radial variation in the intrinsic properties of GCs, such as the more spatially concentrated nature of red clusters with respect to the blue ones seen in most galaxies (e.g., Geisler, Lee, & Kim, 1996; Kundu et al., 1999), it is not clear from this data set whether the distance from the center of a galaxy independently affects the efficiency of LMXB formation in a GC. Crude statistical tests with this sample suggest that the radial variations due to selection effects and intrinsic properties might indeed be able to reproduce the observed radial gradient.
7 Conclusions
We have studied the connection between LMXBs and GCs in a sample of early-type galaxies. Ultimately, it is hoped that such studies may provide information on the origin and evolution of LMXBs, and on the evolution of GCs. In general, the fraction of LMXBs associated with globular clusters () is much higher (by factors of ) than the fraction of optical light in GCs. This result, which is also true for our Galaxy, indicates that stellar dynamical interactions in globular clusters are very effective at producing compact binary systems (Clark, 1975; Fabian et al., 1975; Hills, 1976).
There is evidence that the fraction of LMXBs associated with globular clusters increases along the Hubble sequence from spiral bulges to S0s to Es to cDs. The increase is a factor of 6. For some time, it has been known that the specific frequency of globular clusters (the number per unit galaxy bulge optical luminosity) also increases along the same sequence (e.g., Harris, 1991) by a similar factor. These two trends might suggest that there are two populations of LMXBs in early-type galactic systems: those formed in GCs, and those formed from field binary stars. The variation in the fraction of LMXBs in GCs might then result from the variation in the specific frequency of GCs. If the number of field LMXBs were proportional to the field optical luminosity in all galaxies, and the number of GC LMXBs were proportional to the number of GCs, one might expect the variation in the fraction of LMXBs in GCs with Hubble type to be considerably smaller than the increase in the specific frequency of GCs, which is not really the case. However, variations in the field stellar populations from galaxy to galaxy might result in variations in the number of field LMXBs per optical luminosity. We note that observations suggest that the total number and X-ray luminosity of LMXBs in galaxies increase in proportion to the total number of GCs rather than the optical luminosity (White et al., 2002). This suggests that most or all LMXBs are formed in GCs (Grindlay, 1984; Sarazin et al., 2001; White et al., 2002), at least in the earlier type galaxies. Then, the variation in the fraction seen in GCs today with galaxy type requires that a higher fraction of LMXBs have escaped from GCs in later type galaxies (spiral bulges) than earlier galaxies (gEs and cDs). However, the fraction of LMXBs which would have escaped from GCs in later type galaxies would be rather large, and might be inconsistent with models for the destruction of GCs or the stellar dynamical escape of LMXBs. Future tests with larger samples may allow us to determine what fraction of LMXBs are made in GCs versus the field, and might provide independent information on the rate of destruction of GCs in galaxies.
The fraction of globular clusters which contain X-ray sources appears to be roughly constant at % in different galaxy types (Kundu et al., 2002). Because of possible incompleteness of the GC samples at the faint end and because the probability of a GC containing a LMXB correlates with its optical luminosity, it may be more useful to give the number of high luminosity LMXBs per optical luminosity of GCs. In our complete sample, this value is about LMXBs per for erg s-1 (0.3–10 keV). The value rises to about LMXBs per at lower X-ray luminosities ( erg s-1). The value for the Milky Way is also very similar to this. The rate of occurrence of bright LMXBs in GCs may provide information on the duty cycle of quiescence vs. X-ray brightness for GC LMXBs, complementing information from the detection of quiescent LMXBs in Galactic GCs (e.g., Grindlay et al., 2001).
The strongest trend which we have found is a correlation between the probability that a GC has an X-ray source and its optical luminosity. However, this correlation is consistent with a constant probability of finding a LMXB per unit optical luminosity; that is, it seems to result primarily from the larger number of stars in optically luminous GCs. Thus, this correlation doesn’t provide any direct information on the physics of the formation and evolution of LMXBs in GCs. It would be very useful to correlate the probability that a GC contains a LMXB with the stellar density in the cluster in order to test the role of stellar dynamical interactions. The stellar densities could be estimated from the optical magnitudes and sizes determined from HST observations.
We find that LMXBs are more likely to be found in redder GCs, and that this trend is independent of the optical luminosity correlation. This seems to indicate that the evolution of X-ray binaries in GCs is affected either by the metallicity or age of the GC, with younger and/or more metal-rich GCs having more LMXBs.
Models for the evolution of LMXBs suggest that the population should vary with time after the formation of the stellar population (White & Ghosh, 1998; Wu, 2001). White & Ghosh (1998) argued that the number of LMXBs would initially rise with time for 1 Gyr, which is set by the time scale for the secondaries in LMXBs to evolve. After this, the number of LMXBs should decline slowly with time as the number of pre-LMXB systems decreases and the existing LMXBs evolve into millisec pulsar binaries. Given that the stellar populations in GCs are generally much older than 1 Gyr, we should be in the latter phase of evolution. Thus, a decline with age would not be unexpected. However, the arguments in White & Ghosh (1998) apply to LMXBs formed from the isolated evolution of a population of initial binary stars; in GCs, new tight binary systems can be produced by stellar dynamical interactions. This might reduce (or even reverse) the rate of decline of LMXBs with age. More detailed models for the evolution of the population of LMXBs in GCs would be very useful.
The number of LMXBs might also depend on the metallicity of the stellar population. A correlation between metallicity and the presence of LMXBs is also seen in GCs in our Galaxy and in M31 (e.g., Bellazzini et al., 1995). This might be due to the fact that higher metallicity stars are larger (Bellazzini et al., 1995); however, the direct effect of this on the evolution of LMXBs does not appear to be very strong (e.g., Ritter, 1999). Larger stellar sizes might also promote tidal captures to form LMXBs (Bellazzini et al., 1995). Alternatively, metallicity might affect the stellar initial mass function (Grindlay, 1993) or have some other more complicated effect on the formation of LMXBs.
There is no strong difference in the X-ray luminosities of GC and non-GC LMXBs in our sample. This disagrees with the result found by Angelini et al. (2001) for the galaxy NGC 1399, where the brightest LMXBs appeared to be positively correlated with GCs. On the other hand, our result is consistent with the analysis of the sources in NGC 4472 by Kundu et al. (2002). There is a weak tendency for the brightest LMXBs, whose luminosities exceed the Eddington luminosity for a 1.4 neutron star, to avoid GCs. That may indicate that black hole X-ray binaries are somewhat less likely to be found in GCs, as seems to be true in our Galaxy. It may be difficult to retain massive BH binaries in GCs (Portegies Zwart & McMillan, 2000). In any case, there are some luminous LMXBs associated with GCs. If one assumes that these most luminous sources contain fairly massive BHs, it would appear that GCs can retain at least some massive BH binaries.
There is no clear evidence that the X-ray spectra or variability of GC and non-GC X-ray sources differ. A much larger sample and repeated observations with Chandra would give stronger limits on the differences in the spectra or variability.
We also find no evidence for a significant difference in the spatial distribution of GC and non-GC LMXBs. There is some evidence that X-ray GCs are more likely to be found near the centers of the galaxies than non-X-ray GCs, but this seems to be mainly due to an anticorrelation of optical luminosity with radius in our sample, plus the correlation of LMXBs with the more optically luminous GCs. Unfortunately, there are problems with the completeness of both the X-ray LMXB samples and optical GC samples. For the X-ray samples, the biggest problem is probably that most of the galaxies observed by Chandra so far have been X-ray bright galaxies, where diffuse emission from hot gas makes it difficult to detect fainter LMXBs near the centers of the galaxies. Hopefully, more observations of X-ray faint early-type galaxies will resolve this problem. Repeated Chandra observations would also allow variability to be detected in more cases, and would allow fainter persistent sources to be detected in the combined exposure. The main limitation in the optical samples of GCs is that not all of the best galaxies have been studied with the HST, and the field of view of a single WFPC2 observation is smaller than the angular size of nearby early-type galaxies. Multiple observations with the WFPC2 or with the ACS may provide more complete samples of GCs for more galaxies.
References
- Angelini et al. (2001) Angelini, L., Loewenstein, M., & Mushotzky, R. F. 2001, ApJ, 557, L35
- Barmby & Huchra (2001) Barmby, P., & Huchra, J. P. 2001, AJ, 119, 2349
- Bellazzini et al. (1995) Bellazzini, M., Pasquali, A., Federici, L., Ferraro, F. R., & Pecci, F. F. 1995, ApJ, 439, 687
- Blanton et al. (2001) Blanton, E. L., Sarazin, C. L., & Irwin, J. A. 2001, ApJ, 552, 106 (BSI)
- Clark (1975) Clark, G. W. 1975, ApJ, 199, L143
- Cutri et al. (2001) Cutri, R. M., et al. 2001, Explanatory Supplement to the 2MASS Second Incremental Data Release, The Two Micron All Sky Survey at IPAC Website: http://www.ipac.caltech.edu/2mass/releases/second/doc/explsup.html
- Dickey & Lockman (1990) Dickey, J. M., & Lockman, F. J. 1990, ARA&A, 28, 215
- Di Stefano et al. (2002) Di Stefano, R., Kong, A. K., Garcia, M. R., Barmby, P., Greiner, J., Murray, S. S., & Primini, F. A. 2002, ApJ, 570, 618
- Fabian et al. (1975) Fabian, A. C., Pringle, J. E., & Rees, M. J. 1975, MNRAS, 172, 15
- Forman et al. (1985) Forman, W., Jones, C., & Tucker W. C. 1985, ApJ, 293, 102
- Geisler et al. (1996) Geisler, D., Lee, M. G., & Kim, E. 1996, AJ, 111, 1529
- Grindlay (1984) Grindlay, J. E. 1984, AdSpR, 3, 19
- Grindlay (1993) Grindlay, J. E. 1993, in ASP Conf. Ser. 48: The Globular Cluster-Galaxy Connection, ed. G. H. Smith & J. P. Brodie (San Francisco: ASP), 156
- Grindlay et al. (2001) Grindlay, J. E., Heinke, C., Edmonds, P. D., & Murray, S. S. 2001, Science, 292, 2290
- Hanes (1977) Hanes, D. A. 1977, MNRAS, 84, 45
- Harris (1991) Harris, W. E. 1991, ARAA, 29, 543
- Harris (1996) Harris, W. E. 1996, AJ, 112, 1487
- Hertz & Grindlay (1983) Hertz, P., & Grindlay, J. E. 1983, ApJ, 275, 105
- Hills (1976) Hills, J. G. 1976, MNRAS, 175, 1
- Kahabka & van den Heuvel (1997) Kahabka, P., & van den Heuvel E. P. J. 1997, ARAA 35, 69
- Katz (1975) Katz, J. I. 1975, Nature, 253, 698
- Kavelaars (2000) Kavelaars. J. J. 2000, private communication
- Kraft et al. (2000) Kraft, R. P., et al. 2000, ApJ, 531, L9
- Kundu et al. (1999) Kundu, A., Whitmore, B. C., Sparks, W. B., Macchetto, F. D., Zepf, S. E., & Ashman, K. M. 1999, ApJ, 513, 733
- Kundu & Whitmore (2001a) Kundu, A., & Whitmore, B. C. 2001a, AJ, 121, 2950 (KWa)
- Kundu & Whitmore (2001b) Kundu, A., & Whitmore, B. C. 2001b, AJ, 122, 1251 (KWb)
- Kundu et al. (2002) Kundu, A., Maccarome, T. J., & Zepf, S. E. 2002, ApJ, 574, L5
- Larsen et al. (2003) Larsen, S. S., Brodie, J. P., Beasley, M. A., Forbes, D. A., Kissler-Patig, M., Kuntschner, H., & Puzia, T. H. 2003, ApJ, 585, 767
- Liu et al. (2001) Liu, Q. Z., van Paradijs, J., & van den Heuvel, E. P. J. 2001, A&A, 368, 1021
- Mann & Whitney (1947) Mann, H. B., & Whitney, D. R. 1947, Ann. Math. Stat., 18, 50
- Miller & Hamilton (2002) Miller, M. C., & Hamilton, D. P. 2002, MNRAS, 330, 232
- Monet D., et al. (1998) Monet D., et al. 1998, USNO-A V2.0, A Catalog of Astrometric Standards (Flagstaff: U.S. Naval Observatory)
- Portegies Zwart & McMillan (2000) Portegies Zwart, S. F., & McMillan, S. L. 2000, ApJ, 528, L17
- Primini et al. (1993) Primini, F. A., Forman, W., & Jones, C. 1993, ApJ, 410, 615
- Puzia et al. (2002) Puzia, T. H., Zepf, S. E., Kissler-Patig, M., Hilker, M., Minniti, D., & Goudfrooij, P. 2002, A&A, 391, 453
- Randall et al. (2003) Randall, S. W., Sarazin, C. L., & Irwin, J. A. 2003, ApJ, submitted (RSI)
- Ritter (1999) Ritter, H. 1999, MNRAS, 309, 360
- Sarazin et al. (2000) Sarazin, C. L., Irwin, J. A., & Bregman, J. N. 2000, ApJ, 544, L101 (SIB)
- Sarazin et al. (2001) Sarazin, C. L., Irwin, J. A., & Bregman, J. N. 2001, ApJ, 556, 533 (SIB)
- Sarazin et al. (2003) Sarazin, C. L., Angelini, L., & Sivakoff, G. R. 2003, ApJ, submitted
- Sivakoff et al. (2003) Sivakoff, G. R., Sarazin, C. L., & Irwin, J. A. 2003, ApJ, submitted
- Supper et al. (1997) Supper, R., Hasinger, G., Pietsch, W., Trümper, J., Jain, A., Magnier, E. A., Lewin, W. H. G., & van Paradijs, J. 1997, A&A, 317, 328
- Swartz et al. (2002) Swartz, D. A., Ghosh, K. K., Suleimanov, V., Tennant, A. F., & Wu, K. 2002, ApJ, 574, 382
- Tonry et al. (2001) Tonry, J. L., Dressler, A., Blakeslee, J. P., Ajhar, E. A., Fletcher, A. B., Luppino, G. A., Metzger, M. R., & Moore, C. B. 2001, ApJ, 546, 681
- Verbunt & van den Heuvel (1995) Verbunt, F., & van den Heuvel, E. P. J. 1995, in X-ray Binaries, ed. W. Lewin, J. van Paradijs, & E. van den Heuvel (Cambridge: Cambridge Univ. Press), 457
- White & Angelini (2001) White, N. E., & Angelini, L. 2001, ApJ, 561, L101
- White & Ghosh (1998) White, N. E., & Ghosh, P. 1998, ApJ, 504, L31
- White et al. (1995) White, N. E., Nagase, F., & Parmar, A. N. 1995, in X-ray Binaries, ed. W. Lewin, J. van Paradijs, & E. van den Heuvel (Cambridge: Cambridge Univ. Press), 1
- White et al. (2002) White, R. E. III, Sarazin, C. L., & Kulkarni, S. R. 2002, ApJ, 571, L23
- Wu (2001) Wu, K. 2001, PASA, 18, 443
| X-ray Exp. | Count Rate Limit | Limit | References | ||||||
|---|---|---|---|---|---|---|---|---|---|
| Galaxy | Type | ( cm-2) | (″) | (Mpc) | (ks) | ( s-1) | ( erg s-1) | LMXB | GC |
| NGC 1553 | S0 | 1.50 | 63 | 18.5 | 23.2 | 4.3 | 12.3 | BSI | KWb |
| NGC 4365 | E3 | 1.63 | 50 | 20.4 | 40.4 | 2.7 | 10.6 | SSI | KWa |
| NGC 4649 | E2 | 2.13 | 82 | 16.8 | 36.8 | 3.1 | 7.0 | RSI | KWa |
| NGC 4697 | E6 | 2.14 | 72 | 11.7 | 39.4 | 2.6 | 2.7 | SIB | K |
| Src. | Count Rate | (0.3–10 keV) | ||||||||
|---|---|---|---|---|---|---|---|---|---|---|
| Galaxy | No. | ( s-1) | ( erg s-1) | H210 | H310 | Var.? | GC? | (mag) | (mag) | Complete? |
| NGC 1553 | 3 | 15.072.67 | 43.3 | 0.34 | 0.35 | |||||
| NGC 1553 | 4 | 7.641.94 | 21.9 | 0.40 | 0.47 | 10.63 | 1.054 | |||
| NGC 1553 | 5 | 9.042.08 | 25.9 | 0.20 | 0.13 | |||||
| NGC 1553 | 7 | 5.471.62 | 15.7 | 0.66 | 0.11 | |||||
| NGC 1553 | 8 | 8.462.03 | 24.3 | 0.14 | 0.59 | |||||
| NGC 1553 | 11 | 4.561.50 | 13.1 | 0.09 | 0.69 | |||||
| NGC 1553 | 16 | 40.044.22 | 114.9 | 0.10 | 0.54 | |||||
| NGC 1553 | 17 | 66.515.41 | 190.9 | 0.15 | 0.65 | V | ||||
| NGC 1553 | 18 | 7.241.83 | 20.8 | 0.09 | 0.51 | |||||
| NGC 1553 | 19 | 4.461.52 | 12.8 | 0.57 | 0.67 | |||||
| NGC 1553 | 23 | 6.141.68 | 17.6 | 0.43 | 0.72 | 12.17 | 1.088 | |||
| NGC 4365 | 1 | 37.343.18 | 152.5 | 0.17 | 0.53 | |||||
| NGC 4365 | 2 | 14.231.98 | 58.1 | 0.30 | 0.34 | |||||
| NGC 4365 | 3 | 48.893.61 | 199.6 | 0.13 | 0.40 | |||||
| NGC 4365 | 4 | 8.861.56 | 36.2 | 0.18 | 0.06 | |||||
| NGC 4365 | 5 | 4.591.16 | 18.7 | 0.42 | 0.42 | 9.26 | 0.936 | |||
| NGC 4365 | 6 | 5.941.35 | 24.3 | 0.67 | 0.77 | |||||
| NGC 4365 | 7 | 13.661.97 | 55.8 | 0.26 | 0.23 | |||||
| NGC 4365 | 8 | 3.371.01 | 13.8 | 0.13 | 0.28 | 11.18 | 1.069 | |||
| NGC 4365 | 9 | 7.111.43 | 29.0 | 0.31 | 0.11 | 9.24 | 1.038 | |||
| NGC 4365 | 10 | 5.401.28 | 22.0 | 0.44 | 0.06 | 8.51 | 1.056 | |||
| NGC 4365 | 11 | 3.531.04 | 14.4 | 0.01 | 0.41 | |||||
| NGC 4365 | 12 | 7.181.45 | 29.3 | 0.22 | 0.25 | 10.14 | 1.241 | |||
| NGC 4365 | 13 | 4.161.14 | 17.0 | 0.76 | 0.43 | 9.95 | 0.926 | |||
| NGC 4365 | 16 | 5.741.30 | 23.5 | 0.11 | 0.42 | V | ||||
| NGC 4365 | 17 | 3.220.97 | 13.1 | 0.58 | 0.26 | 10.68 | 1.071 | |||
| NGC 4365 | 18 | 11.781.80 | 48.1 | 0.05 | 0.28 | 11.37 | 1.125 | |||
| NGC 4365 | 22 | 3.931.06 | 16.0 | 0.24 | 0.02 | |||||
| NGC 4365 | 25 | 6.861.38 | 28.0 | 0.20 | 0.06 | 11.18 | 1.057 | |||
| NGC 4365 | 26 | 2.690.89 | 11.0 | 0.33 | 0.00 | 8.64 | 1.226 | |||
| NGC 4365 | 29 | 2.650.89 | 10.8 | 0.24 | 0.01 | V | ||||
| NGC 4365 | 30 | 6.671.36 | 27.2 | 0.37 | 0.49 | |||||
| NGC 4365 | 31 | 2.660.89 | 10.9 | 0.05 | 0.88 | V | ||||
| NGC 4365 | 32 | 4.051.08 | 16.5 | 0.26 | 0.02 | |||||
| NGC 4365 | 33 | 5.031.51 | 20.5 | 0.41 | 0.76 | |||||
| NGC 4365 | 34 | 2.940.93 | 12.0 | 0.59 | 0.71 | 10.00 | 1.205 | |||
| NGC 4365 | 37 | 2.790.92 | 11.4 | 0.47 | 0.48 | 10.13 | 1.290 | |||
| NGC 4365 | 38 | 18.652.27 | 76.1 | 0.38 | 0.92 | |||||
| NGC 4365 | 40 | 3.601.03 | 14.7 | 0.07 | 0.85 | 11.38 | 1.101 | |||
| NGC 4365 | 42 | 11.861.79 | 48.4 | 0.08 | 0.22 | |||||
| NGC 4365 | 43 | 3.951.06 | 16.1 | 0.46 | 0.18 | |||||
| NGC 4365 | 44 | 3.221.07 | 13.1 | 0.05 | 0.70 | 11.15 | 1.172 | |||
| NGC 4365 | 45 | 4.211.19 | 17.2 | 0.19 | 0.09 | 10.98 | 0.958 | |||
| NGC 4365 | 46 | 2.620.86 | 10.7 | 0.05 | 0.70 | |||||
| NGC 4365 | 47 | 10.721.68 | 43.8 | 0.04 | 0.63 | |||||
| NGC 4365 | 48 | 2.700.89 | 11.0 | 0.15 | 0.00 | V | 9.86 | 1.180 | ||
| NGC 4365 | 50 | 6.291.31 | 25.7 | 0.26 | 0.72 | 9.69 | 1.120 | |||
| NGC 4365 | 53 | 5.851.26 | 23.9 | 0.55 | 0.44 | 10.32 | 1.027 | |||
| NGC 4649 | 2 | 33.523.46 | 75.4 | 0.61 | 0.90 | |||||
| NGC 4649 | 3 | 20.432.90 | 45.9 | 0.32 | 0.47 | 9.93 | 1.081 | |||
| NGC 4649 | 4 | 20.802.92 | 46.8 | 0.44 | 0.40 | |||||
| NGC 4649 | 5 | 13.112.50 | 29.5 | 0.22 | 0.68 | |||||
| NGC 4649 | 6 | 21.493.01 | 48.3 | 0.13 | 0.55 | 11.19 | 0.999 | |||
| NGC 4649 | 9 | 15.942.57 | 35.8 | 0.21 | 0.42 | |||||
| NGC 4649 | 12 | 9.941.98 | 22.4 | 0.09 | 0.23 | |||||
| NGC 4649 | 16 | 4.061.28 | 9.1 | 1.00 | 0.28 | |||||
| NGC 4649 | 18 | 20.772.80 | 46.7 | 0.06 | 0.23 | 11.03 | 1.116 | |||
| NGC 4649 | 19 | 9.432.00 | 21.2 | 0.11 | 1.00 | |||||
| NGC 4649 | 20 | 15.202.36 | 34.2 | 0.08 | 0.22 | 10.22 | 1.225 | |||
| NGC 4649 | 21 | 6.381.69 | 14.3 | 0.15 | 0.34 | |||||
| NGC 4649 | 22 | 5.151.43 | 11.6 | 0.01 | 0.56 | 11.23 | 1.246 | |||
| NGC 4649 | 23 | 9.291.85 | 20.9 | 1.00 | 1.00 | 11.27 | 1.149 | |||
| NGC 4649 | 25 | 16.212.36 | 36.5 | 0.20 | 0.10 | |||||
| NGC 4649 | 26 | 6.691.66 | 15.1 | 0.21 | 0.03 | |||||
| NGC 4649 | 27 | 7.681.75 | 17.3 | 0.14 | 0.57 | |||||
| NGC 4649 | 28 | 7.391.72 | 16.6 | 0.44 | 0.11 | 10.19 | 1.085 | |||
| NGC 4649 | 29 | 11.722.10 | 26.4 | 0.05 | 0.68 | 10.28 | 1.228 | |||
| NGC 4649 | 31 | 18.102.49 | 40.7 | 0.00 | 0.55 | 10.57 | 1.220 | |||
| NGC 4649 | 32 | 7.531.77 | 16.9 | 0.50 | 0.54 | 10.41 | 1.031 | |||
| NGC 4649 | 33 | 6.161.60 | 13.8 | 0.42 | 0.82 | 8.46 | 1.335 | |||
| NGC 4649 | 40 | 5.231.45 | 11.8 | 0.09 | 0.01 | |||||
| NGC 4649 | 41 | 5.921.48 | 13.3 | 1.00 | 1.00 | |||||
| NGC 4649 | 42 | 11.382.01 | 25.6 | 0.09 | 0.40 | 10.19 | 1.217 | |||
| NGC 4649 | 45 | 6.421.52 | 14.4 | 0.04 | 0.43 | 8.95 | 1.218 | |||
| NGC 4649 | 46 | 6.961.63 | 15.7 | 0.54 | 0.19 | 9.50 | 1.185 | |||
| NGC 4649 | 47 | 5.881.51 | 13.2 | 0.70 | 0.54 | 10.19 | 1.282 | |||
| NGC 4649 | 48 | 8.741.72 | 19.7 | 0.03 | 0.04 | 10.60 | 1.218 | |||
| NGC 4649 | 49 | 4.891.36 | 11.0 | 0.44 | 0.71 | |||||
| NGC 4649 | 53 | 10.121.94 | 22.8 | 0.04 | 0.06 | 10.21 | 1.320 | |||
| NGC 4649 | 57 | 3.891.16 | 8.7 | 0.03 | 0.53 | 11.33 | 1.173 | |||
| NGC 4649 | 58 | 9.331.76 | 21.0 | 0.20 | 0.32 | |||||
| NGC 4649 | 61 | 3.851.16 | 8.6 | 0.31 | 0.86 | |||||
| NGC 4649 | 62 | 4.411.21 | 9.9 | 1.00 | 1.00 | 9.77 | 1.058 | |||
| NGC 4649 | 63 | 9.511.74 | 21.4 | 0.48 | 0.47 | 11.46 | 1.209 | |||
| NGC 4649 | 65 | 3.751.18 | 8.4 | 0.90 | 0.64 | |||||
| NGC 4649 | 68 | 4.871.28 | 10.9 | 0.28 | 0.44 | |||||
| NGC 4649 | 69 | 38.183.38 | 85.8 | 0.20 | 0.69 | |||||
| NGC 4649 | 70 | 19.652.44 | 44.2 | 0.11 | 0.50 | 8.24 | 1.227 | |||
| NGC 4649 | 71 | 4.211.25 | 9.5 | 0.53 | 0.20 | |||||
| NGC 4649 | 72 | 6.341.52 | 14.3 | 0.29 | 0.38 | |||||
| NGC 4649 | 73 | 3.351.11 | 7.5 | 0.74 | 0.17 | |||||
| NGC 4649 | 74 | 16.572.26 | 37.3 | 0.09 | 0.18 | |||||
| NGC 4649 | 75 | 41.293.53 | 92.8 | 0.12 | 0.44 | |||||
| NGC 4649 | 80 | 10.881.88 | 24.5 | 0.01 | 0.58 | 10.29 | 0.964 | |||
| NGC 4649 | 85 | 17.742.37 | 39.9 | 0.01 | 0.59 | |||||
| NGC 4697 | 53 | 25.752.62 | 26.8 | 0.17 | 0.54 | 7.40 | ||||
| NGC 4697 | 54 | 3.611.10 | 3.7 | 0.47 | 0.48 | 11.23 | ||||
| NGC 4697 | 55 | 2.700.88 | 2.8 | 0.43 | 0.39 | V | 8.16 | |||
| NGC 4697 | 57 | 10.161.64 | 10.6 | 0.04 | 0.34 | |||||
| NGC 4697 | 58 | 4.211.08 | 4.4 | 0.29 | 0.13 | V | ||||
| NGC 4697 | 59 | 3.871.02 | 4.0 | 0.07 | 0.75 | |||||
| NGC 4697 | 60 | 2.620.86 | 2.7 | 0.19 | 0.13 | |||||
| NGC 4697 | 61 | 13.681.89 | 14.2 | 0.50 | 0.62 | V | 7.91 | |||
| NGC 4697 | 62 | 8.561.64 | 8.9 | 0.07 | 0.28 | |||||
| NGC 4697 | 63 | 7.461.51 | 7.7 | 0.44 | 0.26 | |||||
| NGC 4697 | 64 | 17.342.24 | 18.0 | 0.12 | 0.93 | V | 9.37 | |||
| NGC 4697 | 65 | 26.982.68 | 28.0 | 0.18 | 0.37 | |||||
| NGC 4697 | 66 | 7.861.44 | 8.2 | 0.00 | 0.86 | |||||
| NGC 4697 | 67 | 3.671.10 | 3.8 | 0.03 | 0.32 | 6.59 | ||||
| NGC 4697 | 68 | 3.271.02 | 3.4 | 0.23 | 1.00 | |||||
| NGC 4697 | 69 | 23.512.59 | 24.4 | 0.00 | 0.29 | 7.50 |
| Complete Sample | Full Sample | ||||||||||||
|---|---|---|---|---|---|---|---|---|---|---|---|---|---|
| Galaxy | Type | (%) | (%) | () | (%) | (%) | () | ||||||
| NGC 1553 | S0 | 70 | 11 | 2 | 1.00.7 | 11 | 2 | 1.00.7 | |||||
| NGC 4365 | E3 | 325 | 30 | 14 | 1.90.5 | 37 | 18 | 2.00.5 | |||||
| NGC 4649 | E2 | 445 | 36 | 19 | 1.70.4 | 47 | 22 | 2.00.4 | |||||
| NGC 4697 | E6 | 263 | 5 | 4 | 1.60.8 | 16 | 7 | 2.81.1 | |||||