Disk Properties and Density Structure of the Star-Forming Dense Core B335 111Based on observations carried out with the IRAM Plateau de Bure Interferometer. IRAM is supported by INSU/CNRS (France), MPG (Germany) and IGN (Spain).
Abstract
We present subarcsecond resolution dust continuum observations of the protostellar collapse candidate B335 made with the IRAM Plateau de Bure Interferometer at wavelengths of 1.2 and 3.0 mm. These observations probe to AU size scales and reveal a compact source component that we identify with a circumstellar disk. We analyze these data in concert with previous lower resolution interferometer observations and find a best fit density structure for B335 that consists of a power law envelope with index ( AU) together with a disk ( AU) of flux mJy. We estimate a systematic uncertainty in the power law index , where the largest error comes from the assumed form of the dust temperature falloff with radius. This determination of the inner density structure of B335 has a precision unique amongst protostellar cores, and it is consistent with the profile of gravitational free-fall, in accord with basic expectations for the formation of a star. The flux (and implied mass) of the compact component in B335 is typical of the disks around T Tauri stars.
1 Introduction
The dense core in the B335 dark globule is generally recognized as the best protostellar collapse candidate. This dense core is nearby (250 pc, Tomita, Saito & Ohtani 1979), isolated, and nearly spherical. It contains a deeply embedded low luminosity young stellar object ( L⊙) discovered at far-infrared wavelengths by Keene et al. (1983) and detected by IRAS only at m.
Detailed radiative transfer models based on the theory of inside-out collapse (Shu 1977) provide very good fits to spectral line profiles of the dense gas tracers CS and H2CO observed at to resolution (Zhou et al. 1993; Choi et al. 1995), though recent studies have raised doubts about the inside-out collapse interpretation. Observations by Wilner et al. (2000) of the CS(5-4) line at higher angular resolution, (500 AU), show that the high velocity emission arises from the inner part of a bipolar outflow, not from the gravitational acceleration of gas close to the protostar. However, studies of starless cores show that some molecular species, in particular CS, are frozen out onto grains at densities characteristic of the inner regions of B335 (Caselli et al. 2002, Tafalla et al. 2002). If heating does not promptly desorb CS molecules from grain mantles, then this species likely makes a poor probe of the kinematics in the presumed infall zone.
Since the density field is strongly coupled to the velocity field, observations of long wavelength dust emission provide an alternative means to infer the dynamical state of the dense core. The intensity of the dust emission provides an integral along the line-of-sight of the product of the density and dust temperature. By modeling the dust temperature and specific mass opacity, the observed intensities can be used to constrain the density distribution. This approach has been applied extensively using large single-dish telescopes (e.g. Ward-Thompson, Motte & Andre 1999, Motte & Andre 2001, Visser, Richer & Chandler 2001, Shirley et al. 2000). But the central regions of the nearest protostellar cores are generally comparable in size to the beamwidths of single-dish telescopes and remain poorly resolved. The density structure at smaller scales must be probed using interferometers. So far, detailed modeling of millimeter interferometer data in this context has been rare (Keene & Masson 1990, Hogerheijde et al. 1999, Harvey et al. 2003, Looney, Mundy & Welch 2003).
Harvey et al. (2003) recently analyzed observations of dust continuum emission at 1.2 mm and 3.0 mm from B335 on scales from 5000 to 500 AU. A single radial power law in density provided a good description of the data, with best fit power law density index . However, this result is subject to the major systematic uncertainty of the unknown contribution from a central compact source, whose presence would bias the derived density profile to be too steep. Such a compact source might be expected in B335 if the protostar is surrounded by an accretion disk. Here, we present new IRAM PdBI observations that probe directly the subarcsecond millimeter continuum structure of B335. These observations detect a compact source component and provide a measure of the previously uncertain level of point source “contamination” to the envelope emission, thereby allowing the inner density structure of B335 to be constrained with unprecedented precision.
2 Observations
Continuum emission from B335 was observed at 1.2 mm (246.5 GHz) and 3.0 mm (100 GHz) with the six antenna IRAM PdBI in a modified A configuration on 2003 March 05. Table 1 lists the observational parameters. The visibilities span a baseline range from 23 to 400 meters, the longest baselines available. This range overlaps with the earlier D configuration observations described by Harvey et al. (2003), thereby enabling cross calibration. The pointing center and observing frequencies were chosen to be identical to the D configuration observations, to facilitate the joint analysis of the two datasets. The half-power field of view for the PdBI is (5000 AU) at 1.2 mm and (12500 AU) at 3 mm. The absolute flux scale was set using observations of the standard source MWC 349, assumed to be 1.77 Jy at 1.2 mm and 1.03 Jy at 3 mm. The estimated uncertainty in the flux scales is roughly 20%. Frequent observations of nearby calibrators J1751+096 and J1925+211 were used to determine time-dependent complex gains. Continuum visibility records were formed for each 60 s integration of the digital correlator, with 560 MHz bandwidth at 1.2 mm, and 570 MHz bandwidth at 3 mm. The bandpass was measured with observations of the strong source 3C 273. The data were calibrated using the IRAM software package CLIC and comprise a total of 6000 records at each wavelength. In addition to amplitude and phase, each record contains a variance measure, determined from the system temperatures and antenna gains.
3 Results and Analysis
We use the techniques developed by Harvey et al. (2003) to analyze the structure of B335 using the interferometer measurements directly in the visibility domain, without producing images. While this approach is computationally intensive, it recognizes the limitations of standard Fourier inversion and deconvolution techniques, and it avoids many difficulties that may arise from the synthesized beam characteristics.
3.1 Presence of a Compact Component
Figure 1 shows the visibility data at 1.2 mm (diamonds) and 3.0 mm (squares), after binning logarithmically in distance. The 1.2 mm data show a visibility profile that flattens with increasing baseline lengths beyond k. The start of this change in slope is also apparent in the 3.0 mm data. We interpret the flattening in the profiles as the separation between the extended envelope that dominates the flux at short baselines from a compact source component that persists to the longest baselines.
To determine the central position, and to test whether the compact component is resolved, we fit an elliptical Gaussian to the long baseline visibilities, k. The fitted Gaussian is offset from the pointing center by (), giving coordinates for the peak , (J2000) consistent with earlier determinations of the protostar position. The uncertainty in the absolute position is likely considerably worse than the formal errors from this fit, since no extra effort was made to ensure especially accurate astrometry. The fitted Gaussian FWHM is , with position angle , which corresponds to semi-major axis AU and semi-minor axis AU. The formal errors on the fitted size are at the level, and they are at the level of the seeing disk size estimated from Gaussian fits to the phase calibrators.
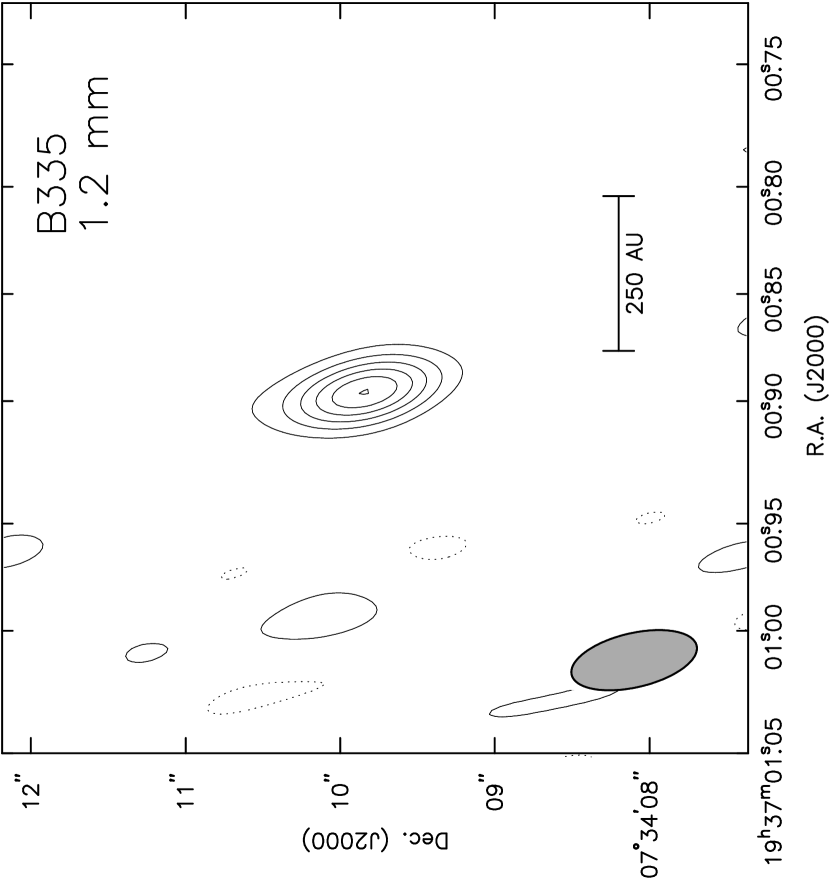
Figure 2 shows an image made from the 1.2 mm long baseline visibilities in the standard way, which highlights the compact source component. We attribute essentially all of this compact flux component to thermal dust emission. Reipurth et al. (2002) detected a subarcsecond scale radio source at 3.6 cm at this position, elongated in the outflow direction, with variable flux mJy. But assuming the free-free emission from this ionized radio jet has a typical flat spectral index, it makes a negligble contribution to the emission at 1.2 mm. The shape of the sythesized beam matches the shape of the fitted Gaussian, but since the fit is to the raw visibility data, the sythesized beam does not directly affect the results, aside from there being inherently more resolution (longer baselines) East-West than North-South. The orientation of the fitted Gaussian is consistent with a source that is elongated perpendicular to the axis of the bipolar outflow seen on larger scales (essentially East-West, e.g. Hirano et al. 1992). We therefore identify the compact component as a circumstellar disk. We caution that the fitted compact source size is only marginally resolved, and that the envelope emission may yet contaminate the signal, even on these subarcsecond size scales. In addition, if the compact component is a disk, then its outer radius is likely larger than the fitted Gaussian FWHM size, perhaps by a factor of up to , because the emission profile of a disk with realistic density and temperature distributions is more centrally peaked than a Gaussian (Mundy et al. 1996, Wilner et al. 1996). This suggests a conservative upper limit of 100 AU for the disk radius.
3.2 Calculation of Model Visibilities
We compare the B335 visibilities from both antenna configurations to theoretical models of protostellar structure by constructing synthetic visibilities, taking account of (1) the dust continuum radiative transfer, and (2) the specifics of the observations, including the exact sampling and primary beam attenuation. In brief, pixel model intensity images (resolution pixel-1 at 1.2 mm, pixel-1 at 3 mm) are calculated using the full Planck function for the emissivity and integrating the radiative transfer equation through the model globule. Each model is normalized to a flux at 1.3 mm of mJy within a circular aperture (top-hat) of radius based on the measurement of Shirley et al. (2000). This normalization effectively provides a measurement at zero-spacing of the interferometer and is essential for determining the envelope structure. Without this information, the model visibility profiles would float freely in normalization and the constraints that can be placed on the density structure are therefore much weaker (see e.g. Looney et al. (2003) where models with and generally cannot be distinguished.) Observations are simulated by performing an FFT, assuming a Gaussian shape for the primary beams (1.2 mm FWHM , 3 mm FWHM ). The sampling is achieved by interpolating the real and imaginary parts of the resulting visibility grid. The center is fixed to match the position of the compact component from the elliptical Gaussian fit to the long baseline 1.2 mm data.
Compact Component.— The compact component of dust emission in B335 evident at long baselines is likely due to a circumstellar disk. Since the size of the compact component from the Gaussian fit () is smaller than the fringe spacing on the longest baseline (), we calculate the contribution of this compact component to the visibilities by modeling it as an unresolved point-like source. We assume the compact component to contribute a flux , for a disk that is optically thin at millimeter wavelengths with a dust opacity index of unity (e.g. Beckwith et al. 1990). If instead the disk were partly optically thick at these wavelengths, then its spectral index might be closer to 2. Experiments with the fitting procedure showed that both the inferred 1.2 mm flux of the compact component and the envelope density distribution are not sensitive to this spectral index assumption, and we adopt the optically thin model. This lack of dependence on the disk spectral index occurs because the flux of the compact component at 3 mm is not tightly constrained due to the lower spatial resolution at this longer wavelength (see Figure 1).
Envelope Density Models.— We fix attention on the spherically symmetric broken power law models for the protostellar envelope density distribution, based on the success of this description in matching the previous lower resolution data. The effect on the inferred density profiles of departures from spherical symmetry caused by the bipolar outflow was investigated by Harvey et al. (2003) and found to be small compared to other sources of systematic uncertainty (e.g. the dust temperature distribution). The density models are of the form:
| (1) |
The fixed outer power law index of , turn-over radius of AU (), and outer radius of pc are based on the near-infrared dust extinction measurements of Harvey et al. (2001). The results are not sensitive to the outer boundary assumption due to the small field of view of the PdBI antennas.
Envelope Dust Temperature.— The models necessarily include assumptions about the dust temperature distribution, in addition to the density field. Based on the study of Shirley et al. (2002), we adopt the following for the temperature:
| (2) |
i.e the temperature falls as a power law, reaching a constant value of K for radii beyond AU. This is a close approximation to the results of detailed calculations of balanced heating and cooling. For B335, an inner breakdown to this behavior is expected within a radius of AU, where the temperature gradient rises sharply due to the envelope becoming optically thick to infrared radiation. This scale is at the resolution limit of the new data, so emission from this warm central region would appear as an unresolved point source in our visibility data. Since the compact component of the flux is constrained by the long baseline data, this possible breakdown in the temperature distribution does not affect the inferred density profile of the envelope (for AU), although it may contaminate the flux that we attribute to a circumstellar disk. To investigate the degree of envelope contamination, we assume that the envelope density distribution extends to the center, and that the temperature increases steeply within a radius of 60 AU (Shirley et al. 2002). In this case the mass of the warm region is only M⊙. To contaminate the compact flux by 50% requires the temperature to increase within this region by K above the assumed distribution, equivalent to an average temperature in the region of K. If the envelope density distribution is disrupted so that it does not extend to the protostar location, then it is even harder for the envelope to contaminate the disk flux.
Envelope Dust Opacity.— We assume that the dust opacity does not change with radius, although this approximation will likely break down in the innermost regions of the envelope where the temperature becomes high enough that the ice mantles evaporate (Ossenkopf & Henning 1994). For the dust opacity at millimeter wavelengths, we assume a power law with index (e.g. Looney, Mundy, & Welch 2000). In the absence of absolute calibration uncertainties, the spectral index would control the relative normalization of the 1.2 mm and 3 mm profiles. In practice, the relative normalization of the 1.2 mm and 3 mm profiles from each of the antenna configuration are consistent with the assumed index, taking account the systematic uncertainties in the calibrations.
3.3 Fitting Model Parameters and Evaluating Fit Quality
We analyze the individual visibility records, and avoid binning the data to prevent loss of information. We maximize the probability distribution of a simultaneous fit to both datasets, by minimizing a modified of the form:
| (3) |
where the are the visibility data points with uncertainty , and the are the data points for a model with power law index . The sum extends over both wavelengths, and over observations from both array configurations. The parameters allow us to include the observational uncertainties, namely the uncertainty in the flux calibration of each dataset (each wavelength from each configuration), and the uncertainty in the Shirley et al. (2000) measurement used in the flux normalization. This is achieved by allowing the model visibilities to be scaled by the constrained parameter , assumed to be a Gaussian random variable with mean and standard deviation . We adopt for the two 1.2 mm datasets, making the assumption of two independent Gaussian distributions contributing to the probability distribution of each scaling factor. While this is not quite accurate (since the normalization is part of both and ), this formulation reduces the number of fitted parameters and provides for realistic values of the scaling factors. These scaling factors essentially provide for the best possible cross-calibration for the observations from the two antenna configurations. For the two 3 mm datasets, we allow the scaling parameters to be free, by adopting , essentially to account for the uncertain dust opacity spectral index.
Since the models are non-linear in the fitting parameters, we analyze the uncertainty in the best-fit model parameters using the Monte Carlo technique known as the bootstrap (Press et al. 1992). In brief, the dataset is resampled times, each time the fitting process is repeated and the best-fit parameters recorded, until the distribution of best-fit parameters is well sampled. The width of the distribution provides an estimate of the uncertainty in the parameters that best fit the original dataset.
The best fit model has envelope density power law index and a point source component of flux mJy. The constrained scaling parameters at 1.2 mm are and . The free scaling parameters at 3 mm are and . The unscaled best-fit model is offset to higher normalization than the D configuration 1.2 mm data, and to lower normalization than the A configuration 1.2 mm data. We interpret these results as most likely due to the uncertainties in the overall flux calibration of the two datasets, low for the former and high for the latter. The magnitudes of the scaling factors are consistent with this interpretation. In this context, the free scalings for the 3 mm datasets are close enough to unity that the data are consistent with an assumed dust opacity spectral index of unity. Figure 1 shows a plot of the various visibility datasets, renormalized by , binned in distance, along with the best fit model, and the two components of the best fit model.
4 Discussion
4.1 Implications for B335 Envelope Structure
We find that the density profile of B335 has power law index within the inner AU. This result is remarkably consistent with the expectation for free-fall collapse. The overall density structure of B335 can be obtained by combining the inner behavior determined in the present study with the steeper outer falloff determined from near-infrared extinction work (Harvey et al. 2001) and low resolution millimeter and submillimeter studies (Shirley et al. 2000, Motte & André 2001). The extinction data showed an average power law index of over the region 3500-25,000 AU, consistent with the index characteristic of a hydrostatic region supported by thermal pressure (the index is not significantly affected by the small overlap with the region in which the index decreases). Joining these two regions together, for the adopted temperature distribution and mass opacity at 1.2 mm, the density distribution of molecular hydrogen is:
| (4) |
The corresponding enclosed mass distribution is:
| (5) |
If one accounts for the asymmetry of the B335 core by modeling the outflow with a bipolar hollow cone, then the normalization of the density distribution away from the outflow must be increased by a small factor, % for a semi-opening angle.
This determination of the inner density structure of B335 has a precision that is unique amongst protostellar cores, and it provides the best evidence yet for the standard picture of isolated star formation, whereby the inner regions of an initially hydrostatic isothermal envelope collapse onto the center in near free-fall conditions (Shu, Adams & Lizano 1987). As noted by Harvey et al. (2003), while the B335 density distribution is qualitatively similar to the density distribution of the inside-out collapse model, the two distributions are quantitatively different in the inner regions. In the inside-out collapse model, the local density gradient within the infall radius is significantly less steep than , ranging from roughly unity to 1.5. Such a shallow density profile is ruled out by the dust emission analysis.
The new long baselines observations reveal the contribution of the central compact source to the total dust emission and thereby remove the previously dominant source of systematic error from the envelope density structure determination (see Harvey et al. 2003). The remaining sources of systematic error, of which the most important is the detailed shape of the temperature distribution, likely contribute a systematic uncertainty of . In the future, high resolution observations of B335 at submillimeter wavelengths may help to mitigate the uncertainties associated with the temperature distribution. Spatially resolved information on the optically thin emission distribution at a third wavelength that is sufficiently short to be outside the Rayleigh-Jeans regime for the majority of the dense core should allow for partly breaking the degeneracy between temperature, density and opacity. Such observations may be obtained with the Submillimeter Array (SMA) on Mauna Kea, which is soon to be commissioned, and eventually the Atacama Large Millimeter Array (ALMA) in Chile, now under construction. It is also clearly desirable to make high resolution spectral line observations of species not subject to depletion and unaffected by the bipolar outflow in order to best probe the dense core dynamics.
4.2 Disk Properties
The fitted flux of mJy from the B335 disk is typical of the (distance corrected) to 300 mJy range of fluxes from disks around the T Tauri stars observed by Beckwith et al. (1990) and Osterloh & Beckwith (1995). The disk flux is at the low end of the range for the disks in the Class 0 sources observed in the Perseus region by Brown et al. (2000) using the CSO-JCMT interferometer at 0.87 mm and by Looney, Mundy, & Welch (2003) using BIMA at 2.7 mm (for ). However, the Perseus sample is highly biased, as the sources were chosen on the basis of their large millimeter fluxes.
The AU FWHM spatial scale of the compact component in B335 at 1.2 mm is similar to the sizes measured for the Perseus Class 0 disks (Brown et al. 2000), though it is not clear how accurately the Gaussian size measurement predicts the actual B335 disk radius. Given that disks result from conservation of angular momentum during the collapse process, a small disk radius and disk flux might be expected in B335 because of its relatively low rotation rate (Frerking, Langer & Wilson 1987, Zhou 1995). In the context of the Terebey, Shu & Cassen (1984) model of inside-out collapse with rotation, the centrifugal radius for B335 is predicted to be only 3 AU, or , far too small to resolve. However, such a small disk could not produce the observed 1.2 mm flux without an unfeasibly high dust temperature of K. The radius of the B335 disk is clearly much larger than predicted by the simple model of inside-out collapse with rotation.
The flux from the disk provides a measure of the disk mass, though the large uncertainty in the normalization of the dust opacity dominates the mass calculation. Assuming cm2 g-1, a simple estimate is , where is the mass weighted mean temperature. Theoretical expectation for a flared, radiatively heated disk, suggest K (Beckwith 1999), though fits to the spectra of the T Tauri disks in Beckwith et al. (1990) give temperatures that are generally lower by a factor of 2 to 3, and disk mass estimates that are higher by the same factor (occupying a range to 0.3 M⊙). For B335, the appropriate mean temperature may be higher than for a disk around a T-Tauri star because of the surrounding envelope with substantial optical depth in the infrared that inhibits cooling (Natta 1993). But since the B335 disk flux is typical of T Tauri stars, it seems likely that the disk mass is not unusually small or large. Given the link between accretion disks and bipolar outflows, perhaps this is not surprising given that B335 exhibits a bipolar outflow that is not at all unusual, with size, momentum and energy typical for a low mass protostar (Goldsmith et al. 1984).
5 Summary
We present new subarcsecond resolution dust continuum observations of the protostellar collapse candidate B335 made with the IRAM PdBI at wavelengths of 1.2 and 3.0 mm. We analyze these data together with previous PdBI observations reported by Harvey et al. (2003) that provide short-baseline information. In summary:
-
1.
The PdBI visibility datasets span baseline ranges from 15 to 400 meters, and the longest baselines marginally resolve a compact component distinct from the highly resolved protostellar envelope. We identify this compact component with a circumstellar disk, although emission from a warm inner region of the envelope may also contribute to this flux. We place a conservative upper limit on the disk radius of AU, given the uncertainties in the details of its temperature and density structure.
-
2.
We analyze the visibility data by comparison with synthetic observations constructed from models with a variety of physical conditions. We simultaneously constrain the envelope density distribution at radii from to AU together with a point-like component to account for the disk. The best fit model has an envelope density power law index within this region, with point source flux mJy (1 ). Systematic uncertainties dominate the random uncertainties for the inferred density structure and contribute an estimated uncertainty of . The dominant source of systematic error is most likely the simple treatment of the dust temperature distribution. Observations at submillimeter wavelengths may help to mitigate the uncertainties associated with the temperature distribution.
-
3.
The density structure of the B335 core indicates an inner region in gravitational free-fall surrounded by an envelope. However, the specific inside-out collapse solution of Shu (1977) does not reproduce the data because of the shallow slope () of the inside-out collapse solution just within the infall radius.
-
4.
The fitted characteristics of the compact source suggest the B335 disk is typical of disks observed around T Tauri stars, with radius AU and mass M K).
References
- (1) Beckwith, S.V.W. 1999, in The Origin of Stars and Planetary Systems, ed. C.J. Lada and N.D. Kylafis (Kluwer Academic Publishers), 579
- (2)
- (3) Beckwith, S.V.W., Sargent, A.J., Chini, R.S. & Güsten, R. 1990, AJ, 99, 924
- (4)
- (5) Brown, D.W., Chandler, C.J., Carlstrom, J.E., Hills, R.E., Lay, O.P., Matthews, B.C., Richer, J.S. & Wilson, C.D. 2000, MNRAS, 319, 154
- (6)
- (7) Caselli, P., Walmsley, C.M., Zucconi, A., Tafalla, M., Dore, L. & Myers, P.C. 2002, ApJ, 565, 331
- (8)
- (9) Choi, M., Evans, N.J.II, Gregerson, E.M., Wang, Y. 1995, ApJ, 448, 742
- (10)
- (11) Frerking, M.A., Langer, W.D. & Wilson, R.W. 1987, ApJ, 313, 320
- (12)
- (13) Goldsmith, P.F., Snell, R.L., Hemeon-Heyer, M. & Langer, W.D. 1984, ApJ, 286, 599
- (14)
- (15) Harvey, D.W.A., Wilner, D.J., Lada, C.J., Myers, P.C., Alves, J.F. & Chen, H. 2001, ApJ, 563, 903
- (16)
- (17) Harvey, D.W.A., Wilner, D.J., Myers, P.C., Tafalla., M., & Mardones, D. 2003, ApJ, 583, 809 (Paper I)
- (18)
- (19) Hirano, N., Kameya, O, Kasuga, T., & Umemoto, T. 1992, ApJ, 390, L85
- (20)
- (21) Hogerheijde, M.R., van Dishoeck, E.F., Salverda, J.M. & Blake, G.A. 1999, ApJ, 513, 350
- (22)
- (23) Keene, J., Davidson, J.A., Harper, D.A., Hildebrand, R.H., Jaffe, D.T., Loewenstein, R.F., Low, F.J. & Pernic, R. 1983, ApJ, 274, 43
- (24)
- (25) Keene, J. & Masson, C.R. 1990, ApJ, 355, 635
- (26)
- (27) Looney, L.W., Mundy, L.G. & Welch, W.J. 2003, astro-ph 0303640
- (28)
- (29) Looney, L.W., Mundy, L.G. & Welch W.J. 2000, ApJ, 529, 477
- (30)
- (31) Motte, F. & André, P. 2001, A&A, 365, 440
- (32)
- (33) Mundy, L.G., Looney, L.W., Erickson, W., Grossman, A., Welch, W.J., Forster, J.R., Wright, M.C.H., Plambeck, R.L., Lugten, J. & Thornton, D.D. 1996, ApJ, 464, 169
- (34)
- (35) Natta, A. 1993, ApJ, 412, 761
- (36)
- (37) Ossenkopf, V. & Henning, T. 1994, A&A, 291, 943
- (38)
- (39) Osterloh, M. & Beckwith, S.V.W. 1995 ApJ, 439, 288
- (40)
- (41) Press, W.H., Teukolsky, S.A., Vetterling, W.T. & Flannery, B.P. 1992, Numerical Recipies in C, p. 691
- (42)
- (43) Mundy, L.G., Looney, L.W. & Welch, W.J. 2000, in Protostars and Planets IV, eds. V. Mannings, A.P. Boss and S.S. Russell, (Tucson: University of Arizona Press), p. 355
- (44)
- (45) Shirley, Y.L., Evans, N.J.II & Rawlings, J.M.C. 2002, ApJ, 575, 337
- (46)
- (47) Reipurth, B., Rodriguez, L.F., Anglada, G. & Bally, J. 2002, AJ, 124, 1045
- (48)
- (49) Shirley, Y.L., Evans, N.J.II, Rawlings, J.M.C. & Gregerson, E.M. 2000, ApJS, 131, 249
- (50)
- (51) Shu, F.H. 1977, ApJ, 214, 488
- (52)
- (53) Shu, F.H., Adams, F.C., & Lizano, S. 1987, ARA&A, 25, 23
- (54)
- (55) Tafalla, M., Myers, P.C., Caselli, P., Walmsley, C.M. & Comito, C. 2002, ApJ, 569, 815
- (56)
- (57) Terebey, S., Shu, F.H. & Cassen, P. 1984, ApJ, 286, 529
- (58)
- (59) Tomita, Y., Saito, T. & Ohtani, H. 1979, PASJ, 31, 407
- (60)
- (61) Visser, A.E., Richer, J.S. & Chandler, C.J. 2001, MNRAS, 323, 257
- (62)
- (63) Ward-Thompson, D., Scott, P.F., Hills, R.E. & Andre, P. 1994, MNRAS, 268, 276
- (64)
- (65) Ward-Thompson, D., Motte, F. & André, P. 1999, MNRAS, 305, 143
- (66)
- (67) Wilner, D.J., Ho, P.T.P. & Rodriguez, L.F. 1996, ApJ, 470, L117
- (68)
- (69) Wilner, D.J., Myers, P.C., Mardones, D. & Tafalla, M. 2000, ApJ, 544, 69
- (70)
- (71) Zhou, S., Evans, N.J.II, Kompe, C. & Walmsley, C.M. 1993, ApJ, 404, 232
- (72)
- (73) Zhou, S. 1995, ApJ, 442, 685
| Parameter | 1.3 mm | 3.0 mm |
|---|---|---|
| Observation date | 2003 Mar. 05 | |
| Configuration | modified A (six antennas) | |
| Baseline range | 23–400 m | |
| Pointing center (J2000) | , | |
| Phase calibrators | J1751+096 & J1925+211 | |
| Bandpass calibrator | 3C 273 | |
| Flux calibrator | MWC 349 | |
| Primary beam FWHM | ||
| Observing frequency | 246.5 GHz | 100.0 GHz |
| RMS Noise | 1.9 mJy | 0.7 mJy |