The spectroscopic signature of hot Jupiters
in FU Orionis objects
Abstract
We show that if FU Orionis objects harbour hot Jupiters embedded in their discs, the resulting non-axisymmetric dissipation profile in the disc would be manifest as time-dependent distortions in the absorption line profiles of these objects. In order to affect the infrared line profiles, planets must lie within au of the central star, whereas only planets within au would influence the optical line profiles. The timescale for modulation of the line profiles is relatively short (months) in each case, so that the effect could not have been discovered from published spectra (which combine data taken in different observing seasons). The detection of hot Jupiters in FU Orionis objects would be in line with the expectations of tidal migration theories (which predict a high incidence of close planets around young stars) and would also lend support to models which link the triggering of rapid rise FU Orionis events to the existence of a close massive planet.
keywords:
accretion, accretion discs — line: profiles — planets and satellites: formation — planetary systems: protoplanetary disks — stars: pre-main sequence — stars: individual (FU Orionis)1 Introduction
Radial velocity surveys show that the frequency of massive planetary companions to late F and G dwarf stars on the main sequence is at least 6 percent. Around 1 percent of surveyed stars possess ‘hot Jupiters’, that is, massive planets within a tenth of an au of their parent star (Butler et al. 2000; Marcy & Butler 2000). Planetary migration theories (Lin & Papaloizou 1986; Lin, Bodenheimer & Richardson 1996) suggest that the abundance of such planets could be considerably higher in pre-main sequence stars, but even the main sequence numbers imply that a significant fraction – though probably not a majority – of pre-main sequence (T Tauri) stars harbour planetary companions at relatively small orbital radii. Directly detecting planets around T Tauri stars is, however, problematic. The rapid rotation of young stars means that searches for planetary transits have to contend with additional variability due to rotational modulation on a timescale of a few days (Aigrain, private communication), whilst the strong veiling of stellar absorption features in Classical T Tauri stars have made it difficult to detect even stellar companions by radial velocity methods (Mathieu 1994).
In this paper, we point out that the subset of accreting pre-main sequence stars known as FU Orionis objects present a novel opportunity for searching for hot Jupiters. FU Orionis objects are believed to be episodes of enhanced accretion on to young stars, during which the emission from the central star is completely swamped by the accretion luminosity (corresponding to accretion rates of ; see Hartmann, Kenyon & Hartigan 1993; Kenyon 1995; Hartmann & Kenyon 1996 for reviews). During the outburst, both the broad band spectral energy distribution and the broad double peaked absorption lines of FU Orionis objects are well fit by the predictions of a steady state Keplerian accretion disc (Hartmann & Kenyon 1985, 1987; Kenyon, Hartmann & Hewett 1988; Popham et al. 1996). In Section 2, we show that the presence of a planet in the inner disc of an FU Orionis object would generate a non-axisymmetric pattern of disc emission, due to a high rate of accretion onto the planet from the disc. In consequence, the resulting line profiles are likely to be asymmetric and time variable, with the extra absorption moving between the red and blue wing of the line as the planet orbits. We present simple models of the predicted line profiles in this case. In Section 3 we discuss which lines provide the best diagnostics of hot Jupiters, and discuss the implications of a detection for planetary migration theory and the origin of FU Orionis outbursts.
2 Non-axisymmetric dissipation and spectral line predictions
The interaction of a planet embedded within a viscous accretion disc has several facets. First, if the planet is sufficiently massive, gravitational torques from the planet will clear a gap (an annular region in which the surface density is greatly reduced as compared to the disc) in the disc (Goldreich & Tremaine 1980; Papaloizou & Lin 1984). Parameterizing the viscosity using the Shakura & Sunyaev (1973) -prescription, , where is the sound speed and the angular velocity, gap opening occurs for a mass ratio given by (Takeuchi, Miyama & Lin 1996),
| (1) |
where is the relative scale height of the disc. In the case of FU Orionis outbursts, detailed time-dependent modeling of the disc suggests that (Bell & Lin 1994), while numerical simulations of angular momentum transport in discs typically find (e.g. Stone et al. 1996). The stellar mass is probably comparable to a Solar mass or somewhat smaller – for FU Orionis itself Hartmann & Kenyon (1987) infer . Using these parameters, the critical value for is around . This estimate suggests that because of the increased disc thickness during FU Orionis events, Jupiter mass planets around Solar mass stars will no longer be able to open a clean gap, and will instead be embedded within disc gas (Clarke & Syer 1996).
Second, irrespective of the presence or absence of a gap, there can be ongoing accretion from the disc onto the planet (Artymowicz & Lubow 1996). The planetary accretion rate can be expressed as a fraction of the disc accretion rate,
| (2) |
where is the accretion rate in the disc at a radius substantially greater than that of the planet. Simulations by Lubow, Seibert & Artymowicz (1999), D’Angelo, Henning & Kley (2002), and Bate et al. (2002) show that the efficiency factor for a planet that is marginally able to open a gap. For larger masses, there is an approximately exponential suppression of the accretion efficiency (Lubow, Seibert & Artymowicz 1999). For lower mass planets also decreases, with a scaling variously measured as from 2D simulations (D’Angelo, Henning & Kley 2002) and as in 3D calculations (Bate et al. 2002). In either event, Jupiter mass planets, embedded within the inner disc of FU Orionis objects, are expected to accrete mass at a significant fraction of the (very high) disc accretion rate.
Finally, the interaction of massive planets with the disc may induce eccentricity in both the disc material and the planetary orbit. Whether this occurs for Jupiter mass planets is currently uncertain (Papaloizou, Nelson & Masset 2001; Goldreich & Sari 2003; Ogilvie & Lubow 2003), and is probably dependent upon details of the angular momentum transport process in protoplanetary discs (e.g. Ogilvie 2001). We will ignore this possibility henceforth.
| Planet mass | |
| Stellar mass | |
| Implied disc thickness (at planet radius) | |
| Effective (at planet radius) |
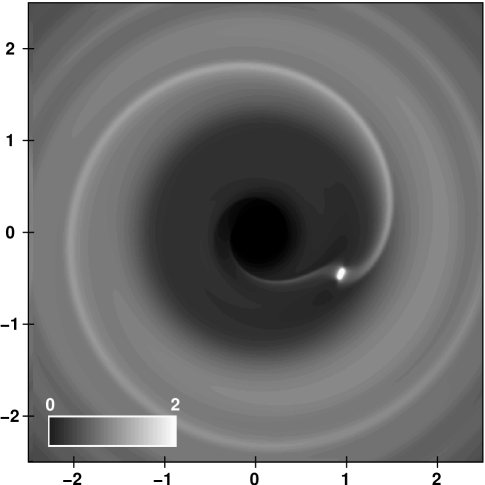
To verify some of these estimates, we have simulated the interaction between the planet and the disc using the ZEUS hydrodynamics code (Stone & Norman 1992). The most important parameters for the disc and planet are summarized in Table 1. The simulation was run at a numerical resolution of grid points in cylindrical co-ordinates, with outflow boundary conditions at the radial edges of the grid. After 120 orbits of the embedded planet, by which time initial transients have died away, the surface density is as shown in Figure 1. As expected based on the arguments given above, the planet (here of mass , where is the mass of Jupiter) is unable to clear a well-defined gap in a disc with relative scale height appropriate to FU Orionis systems, though there is a clear drop in the surface density at the radius where a gap would form in a cooler disc. A stream from the outer disc carries approximately half of the outer disc accretion rate, forming an (unresolved) circumplanetary disc and extending toward the inner boundary of the simulation.
Apart from gas in the (small) circumplanetary disc, the velocity perturbations to the disc flow are negligible. We have therefore modeled the influence of the planet upon the line profiles by assuming that the dominant effect is due to the enhanced dissipation caused by accretion onto the planet. The magnitude of the extra dissipation is,
| (3) |
where is the planetary radius. Since the disc is extremely optically thick, this extra luminosity will be radiated over a hotspot with a radius . The ratio of the effective temperature of the hotspot to the effective temperature of the disc is then,
| (4) |
where is the luminosity of the hotspot area in the absence of the enhancement due to the planet. This unperturbed luminosity is given by the product of the hotspot area (, allowing for both sides of the disc) and the radiative flux generated by a steady-state accretion disc (e.g. Frank, King & Raine 1992). This product yields,
| (5) |
From equations (3), (4) and (5), it follows that,
| (6) |
where is the radius of Jupiter. As noted earlier, a disc aspect ratio of is consistent with detailed modeling of FU Orionis events as thermal disc instabilities (Bell & Lin 1994). The planetary radius is more uncertain. In isolation, giant planets shrink rapidly – a planet contracts below within a few Myr (Burrows et al. 1997). A planet which is still actively accreting will be larger, so for this estimate we take a value of .
For the parameters given in equation (6), we estimate that the dissipation rate per unit area is about a factor of two greater in the vicinity of the planet than at other phases. For optically thick emission, this corresponds to a 20 percent increase in the effective temperature of the disc in the region around the planet. In the case of absorption lines whose equivalent width varies only weakly with temperature (see below) this extra dissipation produces additional line absorption in the velocity channels centred on the instantaneous line of sight velocity of the planet. We note that the resulting local enhancement of the disc temperature does not depend upon the accretion rate through the disc, and (for fixed planet radius) becomes more significant at larger disc radii.


In Figures 2 and 3 we illustrate the distortion of the line profiles resulting from such a non-axisymmetric surface brightness distribution. In each case, we have plotted the instantaneous line profiles when the planet’s velocity is most closely aligned to the observer’s line of sight. Half the line is plotted, the other half of the line being the mirror image of the unperturbed profile shown by the solid histogram. As the planet orbits the central star, the feature in the line profile would migrate back and forth between the red and blue wing of the line on the planet’s orbital period.
The quantity plotted is the rotational broadening function (with arbitrary normalisation) i.e. it is the function with which the intrinsic spectrum would be convolved in the relevant region of the spectrum. In practice, the rotational broadening function in observed spectra of FU Orionis objects is extracted using cross-correlation techniques, which have the twin advantage of providing a weighted average over many lines and at the same time being mainly sensitive to line shape, rather than line depths (see Hartmann et al. 1986). In the construction of Figures 2 and 3 we adopt a simplified model in which the absorption per unit area at each point in the disc is simply proportional to the black body emission flux at that point. (i.e. we neglect variations in the line equivalent width with either temperature or gravity over temperature ranges appropriate to the lines in question). A more sophisticated treatment would involve the summation of lines from appropriate stellar models, although it is unclear whether this is in fact more correct, given that in discs there is likely to be significant deposition of mechanical energy in the atmosphere, which makes comparison with stellar spectra problematical. In any case, Kenyon et al. (1988) noted that in the infrared, the saturated nature of the CO lines makes the equivalent widths rather insensitive to the effective temperature and gravity and a similar argument can be made for the principal lines in the 6170 Å window (see discussion in Hartmann and Kenyon 1987).
The two spectral regions illustrated in Figures 2 and 3 correspond to bands centred on and 6170 A, and, following Hartmann and Kenyon 1987 and Kenyon et al 1988, we have considered contributions to the line profiles in each spectral region from the temperature ranges K and K respectively. For the temperature profile of the unperturbed disc, we have adopted the model of Kenyon et al. (1988) which provided the best fit to the spectral energy distribution and line profiles of V1057 Cygni: the disc temperature follows the classic scaling with radius, with maximum temperature of K at the disc’s inner edge ( au). Such a disc temperature distribution corresponds to an accretion rate of onto a solar mass star. Note that material at the inner edge of the disc is too hot to contribute to the absorption in either of the wavebands shown here and so there is likewise no contribution from any (presumably hotter) boundary layer.
In the absence of the planet, the absorption lines exhibit the double peaked structure familiar from the emission line profiles of cataclysmic variables. We have here scaled the velocities so as to roughly reproduce the line widths in V1057 Cyg, requiring the projected Keplerian velocity at the stellar surface to be km s-1 (Kenyon et al. 1988). The maximum velocity corresponds to the projected velocity at the inner edge of the line producing region, whereas the velocity at the line peak reflects the projected velocity at the location where the line emissivity starts to fall (close to the Wien cut-off of the relevant transition). At lower velocities, the line is produced by a mixture of high velocity material projected at low velocity and by low velocity material absorbing in the Wien region of the spectrum. For the parameters employed here, the regions of the unperturbed disc that contribute to the line absorption lie between au (for the optical lines) and au (for the infrared lines).
We model the presence of the planet as a 20 percent boost in the effective temperature distributed in a region of azimuthal extent and radial half-width centred on the planet at radius , these choices being motivated by the preceding discussion. The effect of the planet is thus manifest in the absorption line profiles as additional absorption at the projected Keplerian velocity of the planet. It is evident from Figures 2 and 3 that the planet produces a distortion to the line profile whenever its associated region of enhanced dissipation overlaps the region of the disc producing the relevant line. The feature becomes less conspicuous, however, at lower velocities (i.e. within the peak of the line profile), since the contribution from the region disturbed by the planet is then diluted by the contribution from higher velocity material projected into this spectral region.

We note that the distortion of the line profile is quite marked. For example, for the planet located at 0.25 au, the extra emission from the vicinity of the planet represents around 22% of the continuum at m, produced in a region of the disc from which there is significant line absorption at this wavelength and in a velocity channel around km/s. Thus the line absorption in this channel is boosted by this factor. The extra emission from around the planet however only boosts the overall continuum level at m by 1.5% so that the line to continuum ratio in this channel is boosted by nearly 20%, as shown in Figure 2. We note that the small contribution of the planet to the over-all continnum level means that such a planet would not produce any detectable effect on the broad band spectral energy distribution of the system.
The features generated by the planet in Figures 2 and 3 are narrow, with velocity widths – comparable to the Keplerian shear across regions of the disc strongly perturbed by the planet – of only a few km/s. As such, they would be hard to resolve in individual spectra, even given the high spectral resolution of a new generation of infrared spectrometers such as NIRSPEC and Phoenix. On the other hand, line monitoring should reveal these features through their regular motion across the line profile. Figure 4 is a grey scale representation of the spectral variations produced at m by a planet orbiting at au, viewed at a spectral resolution of R=75,000. Each horizontal slice is a spectrum from which the mean line profile (over an orbit of the planet) has been subtracted. The planet’s motion is along the line of sight at the bottom of the plot and the feature moves through the line centre (left hand margin) as the planet motion passes through the tangent plane. The characteristic trail produced by the planet is evident despite the inconspicuousness of the planet’s feature in any individual spectrum.
3 The detectability of hot Jupiters in FU Orionis systems
The above crude model suggests that the sort of non-axisymmetric dissipation profile that one would associate with an embedded hot Jupiter would have a conspicuous effect on the line profiles of FU Orionis systems. This immediately raises the question of whether such a distortion should already have been detected in FU Orionis objects analysed to date if they indeed harboured such planets. Two factors however militate against the discovery of such features in existing spectra: firstly the limited spectral resolution (particularly in the infrared, where the spectral resolution of published spectra is comparable with the line width) and secondly, the fact that in order to enhance the signal to noise of the lines analysed, spectra have been co-added from a number of observing runs. We have seen above that the regions of the disc in which embedded planets would be detectable in this way are close in (within au) and hence the associated orbital timescale is short (months). The effect of a feature crossing the line profile from the red to the blue wing would thus be washed out by combining spectra from different observing seasons.
In order to detect an embedded planet through its time-dependent distortion of the line profile, it is of course necessary that the planet be located in the region of the disc producing the line. This restricts the technique to the detection of rather close planets (within au for an effect to be manifest in the infrared lines and within au for a manifestation in optical line spectra). Such orbital radii are well within the range of separations of hot Jupiters (to date and exoplanets respectively have been discovered in each of these separation ranges111See e.g. the compilation at exoplanets.org, though note that many of the planets within 0.1 au have less than a Jupiter mass.). Since the infrared lines are produced in cooler regions of the disc, it follows that the infrared lines provide a good diagnostic of planets over a larger range of radii. On the other hand, since the optical lines originate in a more spatially restricted region of the disc, it is evident that if a planet is present at an appropriate radius, it will be more conspicuous in the optical line profiles, since the distortion produced by the planet is less diluted by absorption by other annuli.
What, then, is the likelihood of there being an appropriate planet in a FU Orionis system? If the incidence of planets in FU Orionis systems follows the statistics of exoplanets around main sequence stars, then we expect that between 2 and 3 percent of systems will harbour a planet within 0.5 au. There would then be little chance of there being an exoplanet in the systems classified as FU Orionis systems to date (Sandell & Weintraub 2001). There are, however, strong theoretical arguments that close planets should have been commoner during the pre-main sequence stage, and that the incidence of such systems on the main sequence represents only the (possibly small) fraction that survived migration without being swallowed by the star (Lin, Bodenheimer & Richardson 1996; Trilling et al. 1998; Armitage et al. 2002; Trilling, Lunine & Benz 2002). Indeed, given the extreme youth of most FU Orionis systems, it is probable that all close planets present in FU Orionis discs are destined to be swallowed, in which case main sequence statistics provide no constraint whatsoever on the possible population. Although it is impossible to assess by what factor the incidence of hot Jupiters is increased in young stars, the sign of the effect should motivate the search advocated here.
Finally, we remark that FU Orionis objects may be prime targets for detecting hot Jupiters if, as suggested by Clarke and Syer (1996), there is a causal link between the two phenomena. Clarke and Syer (1996) argued that the most plausible way of triggering a rapid rise outburst (i.e. one in which the hundredfold increase in luminosity occurs on a timescale of a few months), is if the disc prior to outburst is ‘dammed up’ behind such a planet. In the Clarke and Syer model, the onset of the thermal ionisation instability upstream of the planet causes the dam to burst, enveloping the planet and causing a rapid rise in accretion luminosity. It is notable that the planetary characteristics advocated by Clarke and Syer (a Jupiter mass planet located at au), are just such that they would be detectable through the absorption line diagnostics discussed here. V1057 Cygni and FU Orionis (both of which are of the rapid rise variety and which are well studied spectroscopically) are thus both prime candidates for this sort of investigation.
Acknowledgements
We thank Doug Lin for useful discussions on the possibility of pre-main-sequence hot Jupiters, and Mark McCaughrean and Keith Horne for advice concerning the observability of the effect. We thank the referee for valuable comments that improved the clarity of the paper. PJA acknowledges support from NASA’s Origins Program via grant NAG5-13207, and from the IoA Visitors Grant. CJC acknowledges support from the JILA Visitors programme.
References
- [1] Armitage P.J., Livio M., Lubow S.H., Pringle J.E., 2002, MNRAS, 334, 248
- [2] Artymowicz P., Lubow S.H., 1996, ApJ, 467, L77
- [3] Bate M.R., Lubow S.H., Ogilvie G.I., Miller K.A., 2003, MNRAS, 341, 213
- [4] Bell K.R., Lin D.N.C., 1994, ApJ, 427, 987
- [5] Burrows A. et al., 1997, ApJ, 491, 856
- [6] Butler R.P., Marcy G.W., Vogt S.S., Fischer D.A., 2000, in Planetary Systems in the Universe, eds A.J. Penny, P. Artymowicz, A.-M. Lagrange, and S.S. Russell, IAU Symposium 202, p. 1
- [7] Clarke C.J., Syer D., 1996, MNRAS, 278, L23
- [8] D’Angelo G., Henning T., Kley W., 2002, A&A, 385, 647
- [9] Frank J., King A., Raine D., 1992, Accretion Power in Astrophysics, Cambridge University Press, p. 78
- [10] Goldreich P., Sari R., 2003, ApJ, 585, 1024
- [11] Goldreich P., Tremaine S., 1980, ApJ, 241, 425
- [12] Hartmann L., Hewett R., Stahler S., Mathieu R.D., 1986, ApJ, 309, 275
- [13] Hartmann L., Kenyon S.J., 1985, ApJ, 299, 462
- [14] Hartmann L., Kenyon S.J., 1987, ApJ, 312, 243
- [15] Hartmann L., Kenyon S.J., 1996, ARA&A, 34, 207
- [16] Hartmann L., Kenyon S., Hartigan P., 1993, in Protostars and Planets III, eds E. Levy and J.I. Lunine, University of Arizona Press, p. 497
- [17] Kenyon S.J., 1995, Rev. Mex. Astron. Astrophy. Conf. Series, 1, 237
- [18] Kenyon S.J., Hartmann L., Hewett R., 1988, ApJ, 325, 231
- [19] Lin D.N.C., Bodenheimer P., Richardson D.C., 1996, Nature, 380, 606
- [20] Lin D.N.C., Papaloizou J.C.B., 1986, ApJ, 309, 846
- [21] Lubow S.H., Seibert M., Artymowicz P., 1999, ApJ, 526, 1001
- [22] Marcy G.W., Butler R.P., 2000, PASP, 112, 137
- [23] Mathieu R.D., 1994, ARA&A, 32, 465
- [24] Ogilvie G.I., 2001, MNRAS, 325, 231
- [25] Ogilvie G.I., Lubow S.H., 2003, ApJ, 587. 398
- [26] Papaloizou J.C.B., Lin D.N.C., 1984, ApJ, 285, 818
- [27] Papaloizou J.C.B., Nelson R.P., Masset F., 2001, A&A, 366, 263
- [28] Popham R., Kenyon S., Hartmann L., Narayan R., 1996, ApJ, 473, 422
- [29] Sandell G., Weintraub D.A., 2001, ApJS, 134, 115
- [30] Shakura N.I., Sunyaev R.A., 1973, A&A, 24, 337
- [31] Stone J.M., Hawley J.F., Gammie C.F., Balbus S.A., 1996, ApJ, 463, 656
- [32] Stone J.M., Norman M.L., 1992, ApJS, 80, 753
- [33] Takeuchi T., Miyama S.M., Lin D.N.C., 1996, ApJ, 460, 832
- [34] Trilling D.E., Benz W., Guillot T., Lunine J.I., Hubbard W.B., Burrows A., 1998, ApJ, 500, 428
- [35] Trilling D.E., Lunine J.I., Benz W., 2002, A&A, 394, 241