\xmm and the Pleiades – I: Bright coronal sources and the X-ray emission from intermediate-type stars
Abstract
We present results of X-ray spectral and timing analyses of solar-like (spectral types F5–K8) and intermediate-type (B4–F4) Pleiads observed in a -ks \xmm EPIC exposure, probing X-ray luminosities () up to a factor 10 fainter than previous studies using the ROSAT PSPC. All 8 solar-like members have “quasi-steady” consistent with the known rotation–activity relation, and 4 exhibit flares. Using a hydrodynamic modelling technique we derive loop half-lengths for the two strongest flares, on HII 1032 and HII 1100. Near the beginning of its flare, HII 1100’s lightcurve shows a feature with a profile suggestive of a total occultation of the flaring loop. Eclipse by a substellar companion in a close orbit is possible but would seem an extraordinarily fortuitous event; absorption by a fast-moving cloud of cool material requires at least two orders of magnitude greater than any solar or stellar prominence. An occultation may have been mimicked by the coincidence of two flares, though the first, its decay time shorter than its rise time and suggestive of , would be unusual.
Spectral modelling of the quasi-steady emission shows a rising trend in coronal temperature from F and slowly-rotating G stars through K stars to fast-rotating G stars, and a preference for low coronal metallicity. These features are consistent with those of nearby solar-like stars, although none of the three stars showing “saturated” emission bears the significant component at 2 keV seen in the saturated coronae of AB Dor and 47 Cas. Of 5 intermediate-type stars, 2 are undetected ( ) and 3 show X-ray emission with a spectrum and consistent with origin from an active solar-like companion.
keywords:
X-rays: stars – stars: activity – stars: coronae – stars: early-type – stars: late-type – open clusters and associations: individual: the Pleiades1 Introduction
The Pleiades is the archetypal stellar sample with age Myr and near-solar photospheric metallicity. Relative youth, proximity, compactness and richness make it key to understanding stellar X-ray emission and its evolution. Cluster members cover spectral types from late-B to late-M, enabling the simultaneous study of the different processes driving X-ray emission from stars of different internal structure.
Solar-like stars (spectral types F5–M3) have radiative cores and convective outer envelopes, and X-ray emission is believed to be from hot plasma confined in magnetic loops in the corona, strong magnetic field being generated by a dynamo located at the base of the convection zone ( dynamo: Parker 1975), as on the Sun. Supportive correlations of increasing coronal X-ray and chromospheric line (e.g. H, Ca II H, K) luminosities with increasing convection zone depth and increasing rotation rates have been well-observed (Pallavicini et al. 1981; Noyes et al. 1984; Pizzolato et al. 2003), although the saturation of these “magnetic activity indicators” at high rotation rates, at an X-ray-to-bolometric luminosity ratio of (Vilhu 1984), awaits a full explanation. X-ray luminosities, , may exceed times that of the Sun at the peak of its activity cycle and younger stellar samples show higher mean as rotation rates slow with time through the braking effect of a magnetized stellar wind. The youth of the Pleiades ensures a number of “ultra-fast-rotating” solar-like members (UFRs), showing saturated levels of magnetic activity, of which there are few examples in the nearby field.
The Sun’s X-ray-emitting corona is highly variable and highly-structured. Stellar X-ray emission is also highly variable, exhibiting flares with profiles echoing those seen on the Sun, though reaching peak up to times higher. X-ray telescopes cannot resolve stellar coronae into active regions and individual loops as seen on the Sun, but loop sizes may be inferred from analysis of flare decays (Reale & Micela 1998). Loop lengths a large fraction of, but smaller than, the stellar radius have been derived from flares observed on a small number of nearby solar-like stars (e.g. Maggio et al. 2000; Güdel et al. 2001; Covino et al. 2001). Younger, faster-rotating, samples show flares of higher peak and with higher frequency (Stelzer, Neuhäuser & Hambaryan 2000), hence the Pleiades is a good target for the study of stellar flares and coronal structure.
The temperature structure and composition of some stellar coronae diverge from those of the solar corona. Therein, the bulk of X-ray-emitting plasma is at 1–2 MK (e.g. Orlando, Peres & Reale 2000), though flaring plasma is often as hot as 10 MK (Reale, Peres & Orlando 2001), while faster-rotating stars have more plasma at higher temperatures (e.g. Güdel, Guinan & Skinner 1997), with the most active stars having much plasma at 20 MK (e.g. Mewe et al. 1996). Elemental abundances in the solar corona differ from those in its photosphere (so-called solar abundances), elements with low first ionization potential (FIP), such as Fe, appearing overabundant (Meyer 1985), although variability occurs with location within the corona (McKenzie & Feldman 1992) and during flares (Reames, Meyer & von Rosenvinge 1994). In the coronae of highly-active solar-like stars, however, low-FIP elements appear underabundant (e.g. Singh et al. 1999), and the FIP-dependence of coronal abundances changes according to activity level (Audard & Güdel 2002). The proximity of the Pleiades enables the study of temperature structure and composition in coronae of a number of individual solar-like stars, helping to extend the relatively small sample of coronae in which these physical conditions have been measured.
While solar-like stars have hot coronae and early-type ( B3) stars are thought to generate X-rays via hot shocks within their massive stellar winds, stars of intermediate type (B4–F4) lack both a deep convective envelope and a massive stellar wind and are thus generally considered incapable of strong X-ray emission: any observed is conventionally attributed to a later-type companion with a hot corona (e.g. Golub et al. 1983; Micela et al. 1996; 1999), although in most cases such a companion remains undiscovered. Intermediate-type Pleiads, relatively close and well-studied for binarity, provide a good sample in which to test this assertion.
The X-ray emission from low-mass stars (spectral types M3), which are thought to be fully-convective and hence unable to support an dynamo, is examined in a companion paper (Briggs & Pye 2003).
The core of the Pleiades has been extensively surveyed at X-ray wavelengths by the Einstein (Caillault & Helfand 1985; Micela et al. 1990) and ROSAT (Stauffer et al. 1994; Micela et al. 1996; Stelzer & Neuhäuser 2001; Micela et al. 1999) observatories, and a single field therein has been observed twice by Chandra (Krishnamurthi et al. 2001; Daniel, Linsky & Gagné 2002; henceforth DLG02).
| HII | SpT | RA | Dec | [] | Ref. | Ref. | Bin. | ||||||
|---|---|---|---|---|---|---|---|---|---|---|---|---|---|
| (1) | (2) | (3) | (4) | (5) | (6) | (7) | (8) | (9) | (10) | (11) | (12) | (13) | (14) |
| 1234 | B9.5V | 3 46 59.40 | +24 31 12.4 | 6.82 | 6.67 | 35.15 | 13.3 | 0.23 | 260 | 1 | 0.37 | : | VB |
| 1431 | A0V | 3 47 29.45 | +24 17 18.0 | 6.81 | 6.61 | 35.15 | 13.3 | 0.61 | 40 | 1 | 2.4 | : | SB |
| 1028 | A2V | 3 46 27.10 | +24 15 21.2 | 7.35 | 7.11 | 34.85 | 11.8 | 0.73 | 110 | 1 | 0.78 | : | VB |
| 1384 | A4V | 3 47 23.97 | +24 35 20.0 | 7.66 | 7.12 | 34.70 | 11.3 | 0.83 | 215 | 1 | 0.38 | : | Ph? |
| 1762 | A9V | 3 48 13.50 | +24 19 07.5 | 8.27 | 7.50 | 34.43 | 10.6 | 0.87 | 180 | 1 | 0.43 | : | SB, VB |
| 1309 | F6V | 3 47 09.98 | +24 16 37.9 | 9.46 | 8.53 | 33.97 | 8.7 | 0.70 | 85 | 1 | 0.74 | : | |
| 1514 | G5 | 3 47 40.38 | +24 21 54.6 | 10.48 | 9.32 | 33.59 | 6.8 | 0.65 | 14 | 2 | 3.33 | 4 | |
| 1032 | G8V | 3 46 28.36 | +24 26 04.2 | 11.34 | 9.62 | 33.28 | 5.8 | 0.95 | 37 | 2 | 1.31 | 5 | Ph? |
| 1100 | K3V | 3 46 37.22 | +24 20 38.8 | 12.16 | 10.12 | 33.03 | 5.1 | 0.35 | 5 | 2 | 7.4 | : | VB |
| 1348 | K5 | 3 47 17.99 | +24 23 28.9 | 12.61 | 10.38 | 32.89 | 4.8 | 0.01 | 5 | 2 | 6.9 | : | SB |
| 1110 | K6.5e | 3 46 38.83 | +24 31 15.1 | 13.29 | 11.04 | 32.69 | 4.2 | 0.98 | 6 | 2 | 5.1 | : | |
| 1516 | K | 3 47 40.30 | +24 18 09.3 | 14.02 | 11.14 | 32.47 | 3.7 | 0.75 | 105 | 2 | 0.25 | : | Ph? |
| 1280 | K8 | 3 47 03.52 | +24 09 37.0 | 14.55 | 11.63 | 32.31 | 3.3 | 0.64 | 85 | 3 | 0.30 | 5 |
The ROSAT surveys detected X-ray emission, attributed to the coronae of late-type companions, from a third of intermediate-type stars (Stauffer et al. 1994; Micela et al. 1996). Krishnamurthi et al. (2001) judged the soft, bright X-ray emission of four intermediate-type stars in the Chandra field to be intrinsic to these stars, but their known binarity led DLG02 to implicate solar-like secondaries.
The ROSAT surveys indicated X-rays were emitted by practically all solar-like Pleiads. Gagné, Caillault & Stauffer (1995; henceforth GCS95) analysed the individual spectra of X-ray-bright Pleiads () and the composite spectra of samples subdivided by spectral type (F, G, K, M) and into slow ( ) and fast ( ) rotators. Only among G stars did rotation rate seem to effect significant spectral differences, but there was a rising sequence in temperature from F through slowly-rotating G then K and M to fast-rotating G. GCS95 did not investigate coronal abundances due to the low energy-resolution of the PSPC, but DLG02 found evidence for low Fe-abundance in the coronae of three K-stars.
Flares identified in the ROSAT surveys showed increases of factors 2–40, peak of 29.8–31.2, and decay time-scales of 1–13 ks, and were more frequent on K- and M-stars than on G-stars, which have lower mean (GCS95; Stelzer et al. 2000). GCS95 inferred a loop half-length of (stellar radii), for a large flare on the K-star HII 1516 using a quasi-static cooling loop model, but this model is not self-consistent in its assumptions and overestimates the loop length (Reale 2002), the energy range of the PSPC was insufficient to constrain the peak temperature, and the lightcurve was sparsely sampled.
In comparison to ROSAT, the greater sensitivity, wider energy range, better energy resolution and continuous time coverage of \xmm’s EPIC detectors enable spectral studies at higher resolution of Pleiades members with lower X-ray luminosities, the detection of smaller flares, and better-constrained modelling of large flares. We use the \xmm EPIC cameras to perform spectral and timing analyses of stars of spectral types B–K in a single 15 arcmin-radius field in the core of the Pleiades, with the aims: (a) to estimate temperature structure and metallicity and, through analysis of the decays of large flares, loop size in the coronae of individual solar-like Pleiads and hence compare these properties to those of well-studied coronae of nearby solar-like stars; and (b) to see if X-ray emission from intermediate-type stars is consistent with emission from the coronae of later-type companions. DLG02 addressed similar questions using their 60-ks Chandra study of a neighbouring field. While the better angular resolution of Chandra offered lower background count-rates, our \xmm observation adds to this study by sampling a more-complete range of spectral types, providing more counts per source to enable better-constrained spectral modelling, expanding the sample of well-studied X-ray-detected intermediate-type Pleiads and being able to analyse large flares.
The paper is organized as follows: § 2 describes the membership, optical and physical data on the Pleiades used in this work; § 3 details the X-ray observations and data analysis performed; § 4 reports and discusses our results; § 5 summarizes the work.
2 Pleiades membership and physical parameters
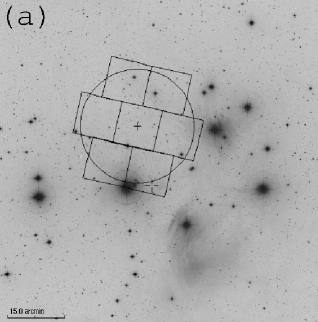
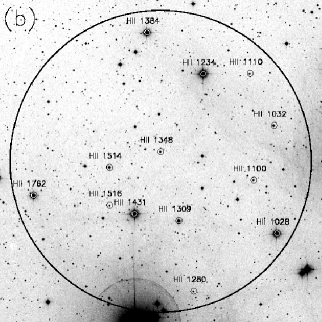
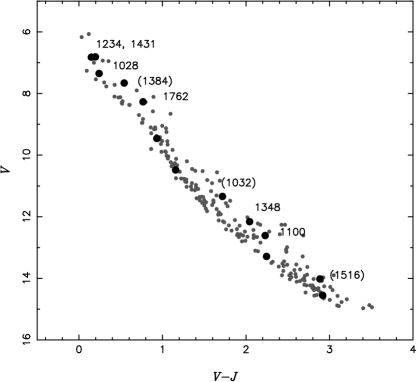
We have drawn a list of solar-like and intermediate-type Pleiades members from the catalogue of Belikov et al. (1998), whose survey used optical () photometry, complete to , and proper-motion measurements, with a baseline of 23 or 30 y, to determine membership. Henceforth we use the terms “Pleiads” or “members” to refer to stars included in this catalogue. The \xmm EPIC field of view (FOV), its position within the Pleiades shown in Fig. 1a, contains 13 such members, whose individual positions in an optical image of the field are marked in Fig. 1b. There are examples of each spectral type within the range of interest: 1 B-, 4 A-, 1 F-, 2 G-, and 5 K-stars. These members are identified throughout the paper using HII numbers (table 2 of Hertzsprung 1947). Positional, photometric, rotational, binarity and membership data (where available) have been culled from the literature and are listed in Table 1. The sample includes one G-type and two K-type UFRs. We have further used a colour-magnitude diagram (Fig. 2) to highlight suspected photometric binaries. We adopt a distance to the Pleiades of 127 pc, , (e.g. Stello & Nissen et al. 2001) as used in previous X-ray surveys. Extinction, , and reddening, , to the cluster are fairly uniform across the EPIC field (Stauffer 1984), and imply a hydrogen column density of cm-2 using the relation of Paresce (1984). The metallicity of the cluster is near-solar (e.g. King et al. 2000). We have inferred bolometric luminosities and stellar radii (the latter estimated through the Stefan-Boltzmann law) by interpolation, using , of the Girardi et al. (2000) models for stars with solar metallicity and age 100 Myr.
3 X-ray observations and data analysis
Observation 0094780101 was a Guaranteed Time pointing (PI: M. Watson) centred on the brown dwarf Teide 1 (J2000: 47 18.0, 22 31), performed on 1st Sep 2000, in orbit 134. An exposure time of 50 ks was scheduled but only 40.6 ks was achieved in the EPIC pn (Strüder et al. 2001) and 33.0 ks in each of the two EPIC MOS (Turner et al. 2001) detectors. The Thick filter was used in each of the three telescopes.
The data were processed using the Science Analysis System (SAS) v5.2111http://xmm.vilspa.esa.es/.. We filtered each eventlist to exclude ‘bad’ events (using the #XMMEA_EM and #XMMEA_EP filters for MOS and pn respectively), uncalibrated event patterns (PATTERN for MOS; PATTERN for pn), and visually-identified “hot” pixels. Several short background flares occurred but had no significant effect on the analysis of bright sources so affected periods were only excluded in the estimation of upper limits for undetected sources.
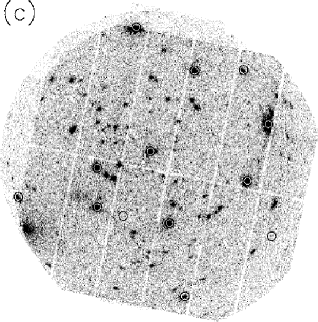
Fig. 1c shows a mosaic of images from all three EPIC cameras in the energy range 0.3–4.5 keV. All 8 solar-like stars (F–K), and 3 of the 5 intermediate-type stars (B–A) were clear by-eye detections. We henceforth refer to these 11 stars collectively as “X-ray-bright Pleiads”. The SAS source-detection software was run on images from the individual cameras, finding the best-fitting X-ray position to be within 3.5 arcsec of the optical position (USNO-A2.0: Monet et al. 1998) for each X-ray-bright Pleiad, and finding the remaining two intermediate-type Pleiads, HII 1028 and 1431, to be undetected at a maximum likelihood threshold of . Upper limits (at the 95 per cent confidence level) to their X-ray luminosities were estimated from the counts in the 0.3–4.5 keV band within 16 arcsec of the optical position (using the “classical” prescription of Kraft, Burrows & Nousek (1991) and the algebraic approximations to the Poissonian upper limit derived by Gehrels (1986)) by correcting for enclosed energy and effective exposure time, and assuming a 0.8 keV mekal source spectrum and distance of 127 pc.
We performed spectral and timing analyses of the X-ray-bright Pleiads using primarily data from the pn, as its higher sensitivity and longer exposure time collected typically a factor 3–4 more counts per source than a single MOS. MOS data were used where they provided source counts and were not affected by CCD edges (HII 1384, 1762). For each X-ray-bright Pleiad, we extracted a spectrum and lightcurve from a circular region centred on the best-fitting X-ray source position. The radius of this circle, , ranged from 30 to 60 arcsec and was constrained by two concerns: (a) contamination by neighbouring sources; (b) retention of a good signal-to-noise ratio. The former provided the stronger constraint in most cases. In each case, a background spectrum and lightcurve were also extracted from a surrounding annulus, with inner radius and area times the source extraction area after areas contaminated by other sources had been removed. The number of background counts, , expected to fall within each source extraction region was estimated from background maps produced by the source detection prodecure and each background product was scaled to contribute counts to its associated source product. Analysis of the source products is described below.
3.1 Time series analysis
Source and background lightcurves were extracted (from regions described above) in the 0.3–4.5 keV band and binned to ensure an average of net source counts per bin, to enable good approximation of the error on the total counts in each bin, , as . Background-subtracted source lightcurves are displayed in Fig. 3.
| HII | Ins | r | []pk | (90%) | ||
|---|---|---|---|---|---|---|
| (1) | (2) | (3) | (4) | (5) | (6) | (7) |
| 1234 | pn | 50 | 1000 | 0.00 | ||
| 1384 | pn | 60 | 500 | 0.04 | ||
| M1 | 60 | 500 | 0.41 | |||
| M2 | 60 | 500 | 0.14 | |||
| M1+2 | 60 | 250 | 0.37 | |||
| 1762 | M1 | 50 | 2000 | 0.57 | ||
| 1309 | pn | 50 | 500 | 0.63 | ||
| 1514 | pn | 40 | 1000 | 0.17 | ||
| 1032 | pn | 60 | 250 | 0.00 | 30.8 | 2.0 (1.7–2.3) |
| 1100 | pn | 50 | 500 | 0.00 | 30.3 | 2.9 (2.6–3.3) |
| 1348 | pn | 30 | 1000 | 0.07 | ||
| 1110 | pn | 60 | 2500 | 0.04 | ||
| 1516 | pn | 30 | 1000 | 0.00 | 29.7 | 2.6 (1.2–6.8) |
| 1280 | pn | 40 | 2000 | 0.00 | 29.6 | 2.7 (1.5–4.7) |
We visually identified flare-like behaviour, defined as an isolated event of heightened emission peaking at factor above the mean “quasi-steady” level outside that event. The decay time-scale of each flare was estimated by fitting an exponential decay to the lightcurve, fixing the time of peak emission to the bin containing the peak number of counts. The peak and quasi-steady count-rates and the -folding decay time-scale were fitted as free parameters. General variability was assessed by applying a test against constancy to the background-subtracted source lightcurve. While the test is flawed in that its result depends on the binning of data, we feel it is more robust than the Kolmogorov–Smirnov (K–S) test, which is applied to unbinned timing data but is not strictly applicable in the presence of significant varying background, which is the case here. Flare parameters and results of the test are given in Table 2.


| HII | Ins | (90%) | (90%) | [] | ratio (90%) | (90%) | [] | [] | / () | |
|---|---|---|---|---|---|---|---|---|---|---|
| (1) | (2) | (3) | (4) | (5) | (6) | (7) | (8) | (9) | (10) | (11) |
| 1234 | pn | 1051 | 0.37 (0.31–0.50) | 1.08 (0.98–1.31) | 52.18 | 1.49 (1.08–2.06) | 0.26 (0.17–0.41) | 29.53 | 39/ 49 (0.86) | |
| 1384 | pn | 1908 | 0.50 (0.37–0.60) | 1.02 (0.91–1.18) | – | 0.84 (0.41–1.27) | 0.26 (0.20–0.36) | – | – | 79/ 79 (0.49) |
| M1 | 1443 | 0.54 (0.45–0.63) | 1.01 (0.88–1.27) | 52.93 | 0.80 (0.30–1.22) | 0.26 (0.19–0.37) | 30.17 | 42/ 50 (0.77) | ||
| M2 | 1493 | 0.61 (0.49–0.66) | 1.26 (0.94–1.94) | 53.15 | 0.43 (0.18–1.02) | 0.18 (0.13–0.26) | 30.21 | 42/ 53 (0.87) | ||
| M1,2 | 2936 | 0.53 (0.49–0.58) | 1.01 (0.95–1.35) | 52.99 | 0.88 (0.42–1.06) | 0.22 (0.17–0.27) | 30.20 | 90/107 (0.88) | ||
| 1762 | M1 | 485 | 0.64 (0.61–0.68) | 52.19 | 1.00 | 29.63 | 14/ 20 (0.82) | |||
| 1309 | pn | 1982 | 0.56 (0.54–0.59) | 52.26 | 0.54 (0.38–0.79) | 29.48 | 77/ 86 (0.74) | |||
| 1514 | pn | 1347 | 0.56 (0.53–0.59) | 52.29 | 0.29 (0.23–0.47) | 29.31 | 71/ 60 (0.15) | |||
| 1032 | pn | 3674 | 0.62 (0.58–0.67) | 1.23 (1.08–1.35) | 52.72 | 1.48 (1.10–1.93) | 0.33 (0.26–0.42) | 30.14 | 149/145 (0.40) | |
| 1100 | pn | 906 | 0.37 (0.30–0.47) | 0.93 (0.83–1.09) | 52.35 | 1.11 (0.80–1.80) | 0.20 (0.13–0.50) | 29.55 | 37/ 41 (0.64) | |
| 1348 | pn | 942 | 0.34 (0.27–0.45) | 0.94 (0.77–1.09) | 52.03 | 0.78 (0.52–1.38) | 0.18 (0.10–0.32) | 29.12 | 35/ 43 (0.79) | |
| 1110 | pn | 322 | 0.34 (0.28–0.42) | 1.02 (0.79–1.29) | 51.36 | 0.94 (0.58–1.47) | 1.00 | 29.00 | 17/ 18 (0.53) | |
| 1516 | pn | 1036 | 0.32 (0.25–0.40) | 0.92 (0.78–1.04) | 52.14 | 1.19 (0.87–2.44) | 0.22 (0.13–0.36) | 29.36 | 56/ 48 (0.20) | |
| 1280 | pn | 432 | 0.32 (0.27–0.37) | 1.32 (1.06–1.74) | 51.56 | 1.39 (0.96–1.98) | 1.00 | 29.22 | 17/ 22 (0.76) |
3.2 Spectral analysis
In the extraction of spectra of variable sources, periods affected by clear flares (e.g. HII 1516) or non-flare-like high emission (e.g. HII 1234) were excluded to enable analysis of “quasi-steady” emission, i.e. not strongly biased by a single transient event. Where sufficient counts were available, spectra from these periods were analysed separately. For each spectrum, an ancilliary response file (ARF) was generated to account for bad pixels and chip gaps, the spatial variations of effective area and quantum efficiency, vignetting, and losses due to the finite source extraction area. Finally, each source spectrum was grouped to a minimum of 20 counts per bin. All data bins containing fewer than 20 counts, and all data outside the range 0.3–4.5 keV, were ignored in spectral analysis. The latest (as of October 2002) pn and MOS redistribution matrices were used, with the ARFs, to model the instrumental responses.
The X-ray emission of a stellar corona is due to hot, optically thin plasma, and the spectrum is expected to be a superposition of the spectra of many individual loops of hot plasma at different temperatures. Hence, the form of the differential emission measure (DEM) as a function of temperature may be rather complex. Additionally, elemental abundances in coronae may differ from solar abundances. However, the relatively low energy resolution ( eV) provided by EPIC, and signal-to-noise typical of bright coronae at the distance of the Pleiades, require us to approximate the DEM to one (1-T) or two (2-T) discrete temperature components, and estimate abundances using a metallicity parameter, , in which the abundances of individual metals are fixed to the ratios observed in the solar photosphere but the total abundance of metals relative to that of H may be fixed to the solar value (), or fitted freely (). The mekal plasma emission code was used, and the absorbing column density was fixed to the nominal value for the Pleiades (see § 2) of cm-2, as exclusion of data below 0.3 keV prevents constraint of at such low values.
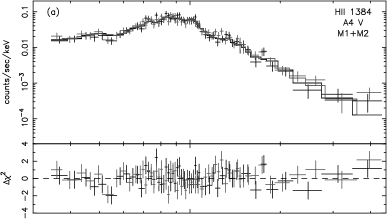
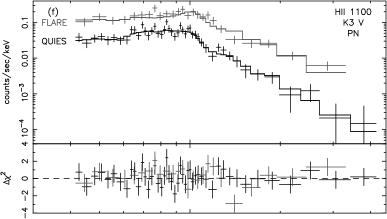
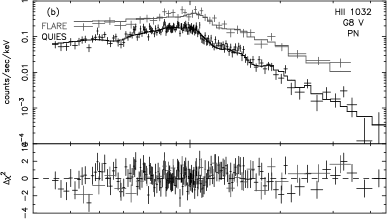
A model was considered to provide an acceptable fit to the data if a test gave a null hypothesis probability of . The addition or freeing of extra parameters (i.e. temperature component, or elemental abundance) was considered to produce a significantly improved fit if an F-test indicated the probability of an equal or larger improvement in occurring by chance was . The best-fitting models are displayed in Fig. 4, with parameters, and 90 per cent confidence intervals, listed in Table 3.


4 Results and Discussion
4.1 Quasi-steady emission from solar-like stars
4.1.1 K-type stars
The five K stars exhibited quasi-steady and values consistent with those expected (using empirical relations found by Pizzolato et al. 2003) from their rotation periods and spectral types: in particular those of the binary HII 1100 were consistent with twin K3 components (Bouvier et al. 1997), each rotating with period d, and the UFRs HII 1516 and 1280 showed saturated-level emission, although it should be noted that HII 1348 (Queloz et al. 1998) and possibly 1516 (Fig. 2) are also binary, with uncharacterized companions.
The quasi-steady spectra of the five K-stars were remarkably similar: clearly flatter than those of the earlier-type stars HII 1514 and 1309 (see Fig. 4); requiring 2-T and/or models for acceptable fits, with and keV (Table 3), in fair agreement with the temperatures of 0.28 and 1.10 keV that best-fitted a composite ROSAT PSPC spectrum of a sample of Pleiades K-stars (GCS95). The two spectral components have approximately equal emission measures, and although that of the hotter component is the lower for the two slowly-rotating stars, HII 1348 and 1110, it is not significantly so. Fits to the better-quality spectra ( net source counts; HII 1100, 1348 and 1516 – c.f. counts for HII 1110 and 1280) were significantly improved by allowing non-solar metallicity in the 2-T model, with . DLG02 also found evidence for low Fe abundances in the spectra of two K-stars in the Chandra sample, and sub-solar coronal metal abundances appear to be a consistent feature of nearby active K-stars (AB Dor: Mewe et al. 1996; “Speedy” Mic: Singh et al. 1999; LQ Hya: Covino et al. 2001).
4.1.2 HII 1032 (G8 V)
HII 1032 exhibited saturated-level X-ray emission, and , consistent with its rotation period of 1.33 d. The quasi-steady spectrum required a 2-T model with and keV with a ratio of hotter:cooler emission measures of and metallicity . A ROSAT PSPC spectrum of HII 1032 was best-fitted using temperatures of 0.4 and 1.2 keV, with fixed solar metallicity (GCS95). Comparable best-fitting temperatures were found for a composite PSPC spectrum of fast-rotating G-type Pleiads, and an individual spectrum of the fast-rotating G-star HII 320 (GCS95; Fig. 5). In mass and saturated-level X-ray emission, HII 1032 resembles the nearby, faster-rotating ( d) K0–1 star AB Dor, but while the quasi-steady spectrum of AB Dor also shows a component at 0.6 keV, it has a prominent hot component at 1.9 keV absent on HII 1032 (Mewe et al. 1996; Maggio et al. 2000; Güdel et al. 2001). The sample of well-studied solar-like UFRs is too small for the effect of saturation on coronal properties such as temperature, to be well-investigated so additions to this sample are important to our understanding of activity saturation. While no companion to HII 1032 has been reported (e.g. Bouvier et al. 1997), Fig. 2 suggests photometric binarity, so its X-ray emission may arise from the unsaturated coronae of two or more active stars.
4.1.3 HII 1514 (G5 V)
HII 1514 showed , consistent with its rotation period of 3.33 d. Its spectrum was acceptably-fitted with a 1-T model with keV and . A second temperature was not constrained, but a significant component at keV could not be discounted. Hotter temperatures best-fitted both a composite ROSAT PSPC spectrum of slowly-rotating G stars (, keV), and individual spectra of two reportedly slow-rotating G-stars, HII 739 and 761 (GCS95), though the of these stars ( ) indicates fast rotation akin to the nearby solar-analogue EK Dra (Güdel et al. 1997). The slower-rotating ( d), nearby G1 stars UMa and Ori do show similar and temperatures to HII 1514.

4.1.4 HII 1309 (F6 V)
HII 1309 gave and a relatively soft X-ray spectrum, akin to that of HII 1514, acceptably-fitted with a 1-T, model with keV, although low metallicity, offered significant improvement. As for HII 1514, a significant cool ( keV) component could not be ruled out. Similar temperatures (, : mean 0.54 keV) and (28.5–29.5: mean 29.2) were found for a sample of field F-stars (Panzera et al. 1999), although a composite spectrum of F-type Pleiads required a hotter temperature of keV (GCS95). HII 1309’s rotation period of d may suggest saturated-level activity. In late-F stars, saturation appears to set in at lower () and perhaps shorter rotation periods than in G-stars (Pizzolato et al. 2003).
4.1.5 Overview
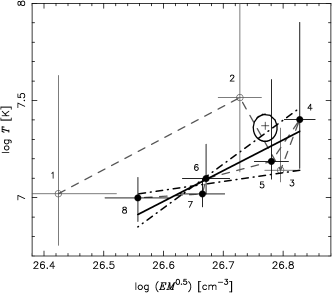
A rising sequence in coronal temperature (, in keV) was observed from the F- and slow-rotating G-stars (, 0.55), through the K-stars (0.3, 1.0) to the fast-rotating G-star (0.6, 1.3), confirming an analysis of composite ROSAT PSPC spectra of Pleiads (GCS95), which showed the same trend, albeit with slightly different values, and largely in agreement with spectral analyses of field F-stars, using ROSAT (Panzera et al. 1999), and nearby solar analogues, using ROSAT and ASCA (Güdel et al. 1997; 1998), although none of our Pleiades sample has a significant component as hot as 2 keV as do 47 Cas and AB Dor (see Fig. 5).
We also found a requirement or significant preference for sub-photospheric metallicities in the quasi-steady spectra of all solar-like Pleiads providing source counts: for K-stars, for G-stars and for the F-star. The fitted metallicity, , is typically driven by the abundance of Fe, which has strong emission lines in the EPIC energy range. High-resolution X-ray spectroscopy of nearby solar-like stars has found coronal elemental abundances to depend on FIP in a manner that changes with or coronal temperature (Audard & Güdel 2002). In highly-active stars, such as AB Dor, low-FIP elements such as Fe appear underabundant, while in intermediate-activity stars, such as UMa or Ori, there is no FIP bias, and in low-activity stars, such as the Sun, low-FIP elements appear overabundant (Meyer 1985). The low values of we find in the coronae of the active G- and K-type Pleiads HII 1032, 1100 and 1516 appear to fit into this framework, but the similarly-low of the intermediate-activity HII 1514 does not. Coronal abundances are entangled with emission measure distribution in spectra of this quality, and are much better-studied with instruments which can resolve individual lines and measure relative abundances of different elements, not just a global metallicity parameter. Overall our results indicate that the temperature structure and abundances in the quasi-steady coronae of solar-like Pleiads conform to expectations from well-studied nearby active stars.
4.2 Variability and flaring on solar-like stars
All five K stars exhibited variability at the 90 per cent confidence level – only in HII 1348 was the lightcurve consistent with constant emission with probability – and HII 1100, 1516 and 1280 displayed flare-like events (Figs. 3f, h, i). All three flares had decay time-scales, , of ks. The HII 1100 flare outshone the rest of its corona five times over, while the peak of the flares on HII 1516 and 1280 just exceeded those of their respective quasi-steady coronae. The lightcurve of HII 1100 shows a striking dip near the onset of the large flare that is discussed further in § 4.2.2. HII 1032 exhibited a flare (Fig. 3b), with peak a factor higher than the quasi-steady , and ks, while the lightcurves of HII 1309 and 1514 displayed no formal variability (Figs. 3d & 3e). The four flaring stars had higher quasi-steady values than the four non-flaring stars (see Table 3). The results follow the observed trend for more variability, and more-frequent and larger flares in the coronae of more-active stars (Stelzer et al. 2000).
4.2.1 Loop modelling from flare decays
The solar corona is highly structured with hot, X-ray-emitting plasma largely confined to magnetic loops which may span up to a third of the solar diameter (e.g. Reale et al. 1997). Although stellar coronae are not spatially resolved by present instrumentation, it has been shown that the sizes of magnetic loops involved in flares may be inferred from analysis of the flare decay (van den Oord & Mewe 1989; Serio et al. 1991). Such techniques have typically neglected the presence of sustained heating in the decay and yielded loop half-lengths in stellar flares (e.g. GCS95). Reale et al. (1997) have performed detailed hydrodynamic modelling of the decay of flaring loops to develop an empirical method that diagnoses and accounts for continued heating in the estimation of loop sizes. The technique has been successfully tested on resolved solar flares and applied to stellar flares using a number of different X-ray detectors (including EPIC pn), yielding (e.g. Reale & Micela 1998; Favata & Schmitt 1999; Maggio et al. 2000; Güdel et al. 2001). The presence of sustained heating is diagnosed through the evolution of temperature, , and density, , in the flare decay, specifically the shallower the slope, , in the – diagram, the slower the decay time-scale of the flare heating rate (maximum for no continued heating; EPIC pn). For stellar flares can rarely be directly measured so the emission measure, , is used to obtain from a – diagram. is then inferred from , the lightcurve decay time, , and the maximum temperature in the loop at flare peak, , as in equations (4) and (5) in Favata et al. (2000), where , , for EPIC pn (Reale, priv. comm.).
The flares on HII 1032 and 1100 allow us to apply a modified version of the hydrodynamic technique to estimate the size of loop involved. For each flare, a spectrum of the flare “peak” (displayed in grey in Figs. 4b and 4f) was extracted and fitted with a single mekal component with fixed to the best-fitting quasi-steady value, in addition to the best-fitting quasi-steady model (from Table 3). The fitted temperatures (with 1- confidence intervals) and emission measures of the plasma at flare peak were 23.5 (20–27) MK and cm-3 for HII 1032, and 15.4 (14–17) MK and cm-3 for HII 1100, from which we derived respective values of 39.2 (32–46) and 24.3 (22–27) MK using the relation (Reale, priv. comm.):
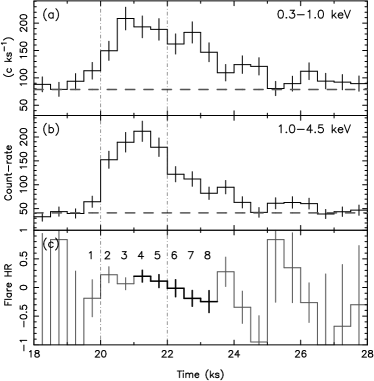
We constructed a – diagram by estimating the flare temperature from a hardness ratio ( where and are the count-rates above the mean quasi-steady count-rate in the 0.3–1.0 and 1.0–4.5 keV bands respectively), and then the emission measure for that temperature from the total count-rate . Conversions were calculated using the pn response appropriate for the particular star (§ 3.2) and 1-T mekal emission models with fixed to the best-fitting quasi-steady value. The count-rates were not sufficient to constrain well: = 1.6 (0.45–2.3); = 1.0 (). Although in the HII 1032 flare is consistent with the absence of sustained heating, its presence cannot be ruled out, and it is apparently required in the case of HII 1100. If , the observed decay is controlled by the heating decay time-scale, not the thermodynamic time-scale, and is hence independent of , which can be constrained only by an upper limit: this is the case for HII 1100. To estimate the lower and upper bounds of a 1- confidence interval for we have first calculated the lower and upper bounds for the quantity using the 1- uncertainties on and , secondly added in quadrature a 20 per cent uncertainty that derives from consistency checks on solar flares, and finally used the lower and upper bounds of to obtain upper and lower bounds respectively to . We thus estimate (0.4–2.6) cm (0.07–0.45) and () cm () . Assuming a loop aspect ratio of 0.2, the mean electron densities in the loop at flare peak, , were (2.7–45) and () cm-3. The corresponding pressures, , calculated from the equation of state, were (2.5–60) and () dyne cm-2, requiring magnetic field strengths, , of (250–1200) and () G for confinement. These values are fairly typical of a variety of larger flares on the nearby young K-type stars AB Dor ( in the range 2.5– cm: Ortolani et al. 1998; Maggio et al. 2000; Güdel et al. 2001), and LQ Hya ( cm: Covino et al. 2001) that have been analysed using the hydrodynamic method.
We caution that TRACE images of large solar flares reveal structure far more complex than single loops (e.g. review by Aschwanden, Poland & Rabin 2001), and so stellar flares, often times more powerful than the strongest solar flares, may not be well-modelled as single loops.
4.2.2 An eclipse of the flare on HII 1100?
The lightcurve of HII 1100 displays a striking dip at 24–25.5 ks after the start of the pn exposure when the count-rate drops sharply from c ks-1 to the quasi-steady rate of c ks-1 in s, remains at this value for s, and then rises sharply to c ks-1 in s (Fig. 3f). The feature is not of instrumental origin as it is reproduced in the MOS lightcurves, the background on that CCD shows no similar feature and no periods of data-loss at this time were recorded.
The profile of the dip is suggestive of a total eclipse of a slow-rising flare, and the most interesting possibility is that this is caused by an object orbiting the flaring star. Approximating the flare geometry to the simplest case of a uniform circular source, and assuming a near-central eclipse, the ratio of radii of eclipsing object, , and flare, , is:
where is the orbital velocity of the eclipsing object. Substituting for using Kepler’s 3rd Law, the product of the circular orbital distance, , and is:
where and are measured in cm and . The loop half-length, cm, inferred from the flare decay suggests cm, and, unacceptably, cm, , although the geometry of the loop and its inclination may cause , and a smaller loop size was allowed by the flare-decay analysis. A Jupiter-sized object ( cm) must orbit at a distance of AU to cause the eclipse, and would imply a flare-loop half-length of cm, the flare decay hence being controlled by the heating decay time-scale, independent of the loop size. A number of such “hot Jupiters” have been detected around nearby solar-like stars (e.g. 51 Peg b: Mayor & Queloz 1995; Boö b: Butler et al. 1997). Although HII 1100 is a binary system, the projected separation of the near-twin components of 100 AU (Bouvier et al. 1997) is too large to affect the orbit of such a planet. The existence of such a planet could be demonstrated by optical observations. Its transit across the stellar disc should eclipse a fraction of the disc area, causing a dimming of 0.02 mag. Given the above orbit, this dimming should last ks and occur every d. The gravitational influence of the planet should also cause a small periodic radial velocity perturbation of , although HII 1100’s apparent magnitude of makes such measurements extremely difficult. If a planet were to be confirmed, this would be the first planet detected by its eclipse of an X-ray flare, the first planet discovered in the Pleiades, and only the second planet discovered by a transit method. However, one must conclude that even if such a planet was to exist, its total eclipse of a flaring loop would be a highly fortuitous event.
An alternative possibility is that the flare was obscured by cool material passing across the line of sight, as proposed by Haisch et al. (1983) to explain the observation by Einstein of a temporarily increased for a time interval during a flare on the dMe star Proxima Centauri. If we model the flare plasma using the best-fitting spectral model of the flare peak (§ 4.2.1), an absorbing column of cm2 is required to absorb per cent of the 0.3–4.5 keV photons, as is observed. This is two orders of magnitude greater than has been seen in solar prominences, the Proxima Centauri event, or cool clouds in the atmosphere of AB Dor that have been inferred from transient H absorption profiles (Collier Cameron et al. 1990). While the size of the AB Dor clouds (area cm2) is comparable to that required by our eclipse profile, their velocities, held to the rotation of the star at around the corotation radius, –300 , are not analogous to the velocity of 150–500 required of our obscuring cloud, as is only 5 for HII 1100. While such high velocities are fairly common in erupting prominences on the Sun (e.g. Gopalswamy et al. 2003), and the bulk kinetic energy of the cloud is around the same order of magnitude as (0.05–5 times) the total energy, erg, radiated by the flare with which it is presumably associated, it would be puzzling if such a flare, which is a routine twice-a-day occurance on AB Dor, was associated with such an extraordinarily denser cloud.
A third explanation is that the large flare, with an impulsive, short rise-time, is shortly preceeded by a smaller flare (albeit, with peak , still larger than the flares exhibited by HII 1516 and 1280) with a shorter decay time than rise time. Evidence for a further flare-like event occurring during the flare decay, at ks (see Fig. 3f) supports the idea of multiple flaring within a complex active region. If we apply the hydrodynamic model with MK, the fast decay, s, indicates a loop structure, cm , smaller than that of the larger flare that followed, though similar to that inferred from a flare with peak , observed on a component of the dMe binary YY Gem (Stelzer et al. 2002). Flares with a longer rise than decay time do not form a well-recognized class on the Sun, but they have been occasionally observed on other stars (e.g. the dMe star EQ Peg: Pallavicini, Tagliaferri & Stella 1990; several examples in the Pleiades and Hyades noted by Stelzer et al. 2000). The coincidence of two flares – the first unusual, the second impulsive – in such a way as to mimic an eclipse forms a somewhat ad hoc explanation of the feature, but none of the available hypotheses presents a convincing explanation on the grounds of probability and/or precedent. A planetary eclipse is the most interesting possibility and the only one that may be confirmed or refuted by further observations.
| HII | SpTA | Bin. | Ref. | SpTB | X-ray Obs | SpT(X) | ||||||
|---|---|---|---|---|---|---|---|---|---|---|---|---|
| (1) | (2) | (3) | (4) | (5) | (6) | (7) | (8) | (9) | (10) | (11) | (12) | (13) |
| 1309 | F6 V | 85 | 1.21 | \xmm | 0.56 | 29.4 | F | |||||
| 1122 | F4 V | 28 | SB2 | 2 | 1.22 | 0.51 | K/M | Chandra | – | 0.45 | 29.1 | F |
| 1338 | F3 V | 10 | SB2 | 2 | 1.22 | 1.22 | F | Chandra | – | – | 28.7 | F |
| 1762 | A9 V | 180 | SB2, VB | 2, 3 | 1.36 | 0.86 | G/K | \xmm | 0.64 | 29.6 | G | |
| 1284 | A9 V | 100 | SB1 | 2 | 1.45 | 0.86 | G/K | Chandra | – | – | 27.6 | K |
| 956 | A7 V | 150 | SB?, VB | 2, 4 | 1.37 | 1.18 | F | Chandra | – | 0.57 | 29.3 | F |
| 1362 | A7 V | 1.52 | Chandra | – | – | |||||||
| 1384 | A4 V | 215 | 1.61 | \xmm | 0.53 | 1.01 | 30.1 | G | ||||
| 1028 | A2 V | 110 | VB | 3 | 1.86 | 1.45 | A | \xmm | – | – | ||
| 1431 | A0 V | 40 | SB2 | 1 | 1.97 | 0.68 | K | \xmm | – | – | ||
| 1375 | A0 V | 160 | SB1 | 2 | 2.11 | 1.74 | A | Chandra | – | – | ||
| 1234 | B9.5 V | 260 | VB | 3 | 2.11 | 1.33 | A/F | \xmm | 0.37 | 1.08 | 29.4 | K |
| 980 | B6 IV | 275 | VB | 5 | 2.53 | ? | ? | Chandra | – | 0.56 | 29.6 | G |
4.3 Emission from intermediate-type stars?
Intermediate-type stars (B4–F4) are believed to lack both the massive stellar wind and deep convective envelope intrinsic to the X-ray generation mechanism of early-type and solar-like stars respectively. Indeed, most X-ray surveys of A-type stars in the field and in open clusters have found a paucity of detections (e.g. Schmitt et al. 1985; Micela et al. 1990; Schmitt et al. 1990). The of detected stars appears to be uncorrelated with stellar properties influential in the emission mechanisms of early-type or solar-like stars, such as , or rotation (Simon, Drake & Kim 1995; Panzera et al. 1999). However, chromospheric emission has been reported to show a correlation with rotation rate for stars with spectral types as early as A9 (Schrijver 1993), and emission lines of C III and O VI in Eri indicate material at temperatures in excess of 0.3 MK is possible in the atmosperes of stars as early as A4 (Simon et al. 2002). In the Hyades, a sharp fall in chromospheric emission is observed to occur at spectral type F5, which coincides with a sharp fall in rotation velocity (Böhm-Vitense et al. 2002). It is possible that dynamo-driven coronal X-ray emisson extends to spectral types some subclasses earlier than F5. 95 percent of all F-type stars within 13 pc of the Sun were detected by ROSAT (Schmitt 1997), although only an F2 subgiant and an unresolved pair of F0 V stars were earlier than F5. Aqu (Altair) and Cep were the only assuredly-single A-stars in the solar neighbourhood to be detected; both are fast-rotating, A7 stars with very cool, low-luminosity, coronae ( , keV, : Simon et al. 1995). However, detected intermediate-type stars have usually had hotter temperatures and of factors up to higher; similar to the most active solar-like stars. Hence, such detections have been conventionally attributed to coronal emission from late-type companions (e.g. Golub et al. 1983; Caillault & Zoonematkermani 1989; Caillault, Gagné & Stauffer 1994; Micela et al. 1996). In some cases further investigation has uncovered an active late-type companion (Güdel et al. 1998; Simon & Ayres 2000) but often no further evidence for an appropriate partner exists, and in ROSAT HRI studies of resolved late-B + late-type (Lindroos) binary systems, the B-type component was found to be the brighter X-ray source in many cases (Berghöfer & Schmitt 1994). However, one cannot rule out the existence of further late-type companions closer still to the primary, and hardness ratios of these X-ray-bright B-type stars are consistent with those of late-type coronae (Huélamo et al. 2000).
Three of the five intermediate-type stars in our observation were detected. We consider available optical and binarity information for these stars, in addition to our own X-ray spectral and timing data (Table 4), to test for consistency with a late-type companion. Where a companion is known, we have inferred an approximate spectral type from the estimated masses of Raboud & Mermilliod (1998).
4.3.1 HII 1762 (A9 V)
HII 1762 was close to the edge of the EPIC FOV and so only observed by MOS1. Its lightcurve showed no significant variability. Its X-ray spectrum was best-fitted by a 1-T model with keV and : both somewhat higher than found for HII 1514 and 1309. HII 1762 has a known spectroscopic and visually-separated companion of estimated spectral type G–K: a G-star more active than HII 1514 is a viable source of the X-ray-emission.
4.3.2 HII 1384 (A4 V)
HII 1384 is one of the brightest X-ray sources in the Pleiades with reported in Einstein, ROSAT and \xmm observations. A flare with peak of 30.5 and decay time of ks was noted by Stelzer et al. (2000).
HII 1384 fell on the very edge of a pn CCD, which may have caused the variability not observed in the MOS lightcurves. Analyses of spectra from the pn, and from MOS1, and simultaneous fitting of the two MOS spectra were in good agreement, but the MOS2 spectrum required a hotter second component. A model was required to give an acceptable fit and the addition of a second component gave significant improvement. The spectral parametrization: , keV, with , and , is similar to that of coronae on fast-rotating G-stars (Fig. 5), although no companion to HII 1384 has been found. Radial velocity variations of reported by Abt et al. (1965) have been doubted (Simon et al. 1995; Raboud & Mermilliod 1998), and more recent studies, albeit based on just two measurements each, found no evidence for variations indicative of a close companion (Liu et al. 1991; Morse, Mathieu & Levine 1991). Speckle interferometry revealed no companion at angular separations of 0.035–1 arcsec unless it is mag. fainter than the primary (Mason et al. 1993), so a late-G star could have escaped detection. Fig. 2 does suggest photometric binarity. The apparently-extraordinary X-ray emission of HII 1384 could be explained by a highly-active G-type companion, just like those discovered to accompany 47 Cas (Güdel et al. 1998) and the Hyad 71 Tau (Simon & Ayres 2000), two F0 stars with apparent of . A dedicated radial-velocity study of the star could test this hypothesis.
4.3.3 HII 1028 (A2 V)
HII 1028 showed no X-ray emission above a threshold of 27.6. A visual companion, estimated to be a late-A star, is also not expected to be a strong X-ray emitter.
4.3.4 HII 1431 (A0 V)
HII 1431 also showed no X-ray emission above a threshold of 27.6. This is somewhat surprising as it has a spectroscopic companion estimated to be a K-star whose X-ray emission would have to be among the faintest 5 per cent for K-stars in the Pleiades according to the luminosity functions of Stauffer et al. (1994) and Stelzer & Neuhäuser (2001).
4.3.5 HII 1234 (B9.5 V)
HII 1234 showed a strong increase in X-ray output of factor toward the end of the observation (Fig. 3g). The quasi-steady spectrum required a second component or for an acceptable fit, and significant improvement was found using a 2-T model. The of 29.5 and spectral parametrization: , keV, with and , resemble those for an active K-star (Fig. 5). Spectral parametrization of the higher emission state was poorly-constrained but indicated higher temperatures ( and 2 keV), similar abundances and . HII 1234 has a visual companion also of intermediate-type and not expected to be a strong X-ray source. The X-ray emission would be better-explained by a hidden K-type companion in the system.
4.3.6 The combined Chandra and \xmm sample
X-ray emission from the detected intermediate-type stars in the \xmm observation appears consistent with coronal emission from companions of spectral types F, G or K. The inclusion of intermediate-type Pleiads in the Chandra field analysed by DLG02 more than doubles the sample size (Table 4). Our interpretation of the results from the combined sample is that the soft X-ray emission from the three F-type stars is probably dominated by coronal emission from the primaries (or the F-type companion in HII 1338), while the strong, soft X-ray emission of the A and B stars HII 956, 980 and 1762 is not intrinsic (as proposed by Krishnamurthi et al. 2001), but due to F-, or moderately-active G-type companions, which are probably identical with companions already noted in the literature. Conversely, the companions of HII 1431 and 1284 are unusually weak X-ray-emitters if they are truly K-type stars. The strong, harder emissions of HII 1234 and 1384 are plausibly due to highly-active K- and G-type companions respectively, but neither have yet been discovered. Dedicated radial velocity and interferometric studies are required to confirm the presence of such companions, in tandem with a wider \xmm and/or Chandra X-ray spectroscopic survey of intermediate-type Pleiads to increase the sample size. If it can be firmly demonstrated that X-ray emission from intermediate-type stars is solely due to companions, X-ray studies may become an effective method of not only surveying the binarity status of stars in this mass range, but also constraining the spectral types of companions.
5 Summary
We have performed detailed spectral and timing analyses of a sample of 13 intermediate-type and solar-like Pleiads, contained in a 40-ks \xmm EPIC observation of the core of the cluster, that enabled the study of individual members with X-ray luminosities an order of magnitude lower than achieved using ROSAT. All solar-like members (1 F-, 2 G- and 5 K-stars) had and consistent with a rotation–activity connection: three ultra-fast rotators (UFRs) emitted at a saturated level. Variable emission was observed from the K-stars and fast-rotating G-star, and the four with highest quasi-steady values exhibited flares. Hydrodynamic modelling of the flares on HII 1032 and 1100 led us to infer loop structures of half lengths . The lightcurve of HII 1100 showed a dip feature that could be due to an eclipse by a “hot Jupiter”-like planet, absorption by a cool prominence with cm-2 moving across the line of sight at several hundred , or the coincidence of two flares, the first with an unusual decay, faster than its rise, indicating a small loop, . None of these explanations is satisfactory in likelihood or precedent, but the existence of a planet may be tested by optical photometric monitoring of the star for transits with depth of mag, followed by a spectroscopic search for radial velocity variations, though the star is faint (). Spectral modelling of the quasi-steady X-ray emission using two-temperature models: (a) confirmed the temperature sequence with spectral type (in order of rising temperature: F, slowly-rotating G, K, fast-rotating G) deduced from composite spectra of Pleiades samples using the lower-resolution ROSAT PSPC, and (b) indicated sub-solar metallicities. The results show that solar-like Pleiads conform to expectations from well-studied active solar-like stars, although none of the three UFRs had the hot, 2 keV component seen in the saturated coronae of the nearby stars AB Dor and 47 Cas. Three of the five intermediate-type Pleiads showed strong X-ray emission consistent with coronal emission from a solar-like companion. For such systems, the X-ray spectrum gives useful insight into the spectral type of the companion.
Acknowledgments
KRB and JPP acknowledge the financial support of the UK Particle Physics and Astronomy Research Council (PPARC). The authors would like to thank F. Reale for guidance in applying hydrodynamic flare decay modelling, M. Güdel for helpful discussions, J. Linsky for suggesting absorption as a possible origin of the ‘eclipse’, A. Collier Cameron, M. Audard and B. Stelzer for useful input, and the anonymous referee whose comments helped to greatly improve the clarity of the paper. This work uses data obtained by \xmm, an ESA science mission with instruments and contributions directly funded by ESA Member States and the USA (NASA), and made use of archival material from the SIMBAD and VIZIER systems at CDS, Strasbourg, NASA’s Astrophysics Data System, and the Leicester Database and Archive Service (LEDAS).
References
- [1] Abt, H. A., Barnes, R. C., Biggs, E. S. and Osmer, P. S., 1965, ApJ, 142, 1604
- [2] Aschwanden, M. J., Poland, A. I., Rabin, D. M., 2001, ARAA, 39, 175
- [3] Audard, M., Güdel, M., 2002, New Visions of the X-ray Universe in the XMM-Newton and Chandra Era, ESA SP-488, Ed. F. Jansen, in press
- [4] Belikov, A. N., Hirte, S., Meusinger, H., Piskunov, A. E., Schilbach, E., 1998, A&A, 332, 575
- [5] Berghöfer T. W., Schmitt J. H. M. M., 1994, A&A 292, L5
- [6] Böhm-Vitense, E., Robinson, R., Carpenter, K., Mena-Werth, J., 2002, ApJ, 569, 941
- [7] Briggs, K. R., Pye, J. P., 2003, ASR, in press
- [8] Bouvier, J., Rigaut, F., Nadeau, D., 1997, A&A, 323, 139
- [9] Butler, R. P., Marcy, G. W., Williams, E., Hauser, H., Shirts, P., 1997, ApJ, 474, L115
- [10] Caillault, J.-P., Helfand, D. J., 1985, ApJ, 289, 279
- [11] Caillault, J.-P., Zoonematkermani S., 1989, ApJ, 338, L57
- [12] Caillault, J.-P., Gagné, M., Stauffer, J. R., 1994, ApJ, 432, 386
- [13] Collier Cameron, A., Duncan, D. K., Ehrenfreund, P., Foing, B. H., Kuntz, K. D., Penston, M. V., Robinson, R. D., & Soderblom, D. R. 1990, MNRAS, 247, 415
- [14] Covino, S., Panzera, M. R., Tagliaferri, G., Pallavicini, R., 2001, A&A, 371, 973
- [15] Cutri, R. M., et al., 2000, Explanatory Supplement to the 2MASS Second Incremental Data Release (Pasadena: Caltech)
- [16] Daniel, K. J., Linsky, J. L., Gagné, M., 2002, ApJ, 578, 486 (DLG02)
- [17] Dommanget, J., Nys, O., 2000, A&A, 363, 991
- [18] Favata, F. & Schmitt, J. H. M. M. 1999, A&A, 350, 900
- [19] Favata, F., Reale, F., Micela, G., Sciortino, S., Maggio, A., & Matsumoto, H. 2000, A&A, 353, 987
- [20] Gagné, M., Caillault, J., Stauffer, J. R., 1995, ApJ, 450, 217 (GCS95)
- [21] Gehrels, N., 1986, ApJ, 303, 336
- [22] Girardi, L., Bressan, A., Bertelli, G., Chiosi, C., 2000, A&AS, 141, 371
- [23] Golub, L., Harnden, F. R., Maxson, C. W., Vaiana, G. S., Snow, T. P., Rosner, R., Cash, W. C., 1983, ApJ, 271, 264
- [24] Gopalswamy, N., Shimojo, M., Lu, W., Yashiro, S., Shibasaki, K., & Howard, R. A. 2003, ApJ, 586, 562
- [25] Güdel, M., Guinan, E. F., Skinner, S. L., 1997, ApJ, 483, 947
- [26] Güdel, M., Guinan, E. F., Etzel, P. B., Mewe, R., Kaastra, J. S., Skinner, S. L., 1998, Tenth Workshop on Cool Stars, Stellar Systems, and the Sun., Eds. R. Donahue, J. A. Bookbinder (San Francisco: Astronomical Society of the Pacific), 1247
- [27] Güdel, M., Audard, M., Briggs, K., Haberl, F., Magee, H., Maggio, A., Mewe, R., Pallavicini, R., Pye, J., 2001, A&A, 365, L336
- [28] Haisch, B. M., Linsky, J. L., Bornmann, P. L., Stencel, R. E., Antiochos, S. K., Golub, L., & Vaiana, G. S. 1983, ApJ, 267, 280
- [29] Hertzsprung, E., 1947, Annalen van de Sterrewacht te Leiden, 19, 1
- [30] Høg, E., Fabricius, C., Makarov, V. V., Urban, S., Corbin, T., Wycoff, G., Bastian, U., Schwekendiek, P., Wicenec, A., 2000, A&A, 355, L27
- [31] Huélamo, N., Neuhäuser, R., Stelzer, B., Supper, R., Zinnecker, H. 2000, A&A, 359, 227
- [32] King, J. R., Soderblom, D. R., Fischer, D. and Jones, B. F., 2000, ApJ, 533, 944
- [33] Kraft, R. P., Burrows, D. N., Nousek, J. A., 1991, ApJ, 374, 344
- [34] Krishnamurthi, A., et al., 1998, ApJ, 493, 914
- [35] Krishnamurthi, A., Reynolds, C. S., Linsky, J. L., Martín, E., Gagné, M., 2001, AJ, 121, 337
- [36] Liu, T., Janes, K. A., Bania, T. M., 1991, ApJ, 377, 141
- [37] McKenzie, D. L. & Feldman, U., 1992, ApJ, 389, 764
- [38] Maggio, A., Pallavicini, R., Reale, F., Tagliaferri, G., 2000, A&A, 356, 627
- [39] Marilli, E., Catalano, S., Frasca, A., 1997, Memorie della Societa Astronomica Italiana, 68, 895
- [40] Mason, B. D., Hartkopf, W. I., McAlister, H. A., Sowell, J. R., 1993, AJ, 106, 637
- [41] Mayor, M., Queloz, D., 1995, Nature, 378, 355
- [42] Mewe, R., Kaastra, J. S., White, S. M. and Pallavicini, R., 1996, 315, 170
- [43] Meyer, J.-P., 1985, ApJS, 57, 173
- [44] Micela, G., Sciortino, S., Vaiana, G. S., Harnden, F. R., Rosner, R., Schmitt, J. H. M. M., 1990, ApJ, 348, 557
- [45] Micela, G., Sciortino, S., Kashyap, V., Harnden, F. R., Rosner, R., 1996, ApJ, 102, 75
- [46] Micela, G., Sciortino, S., Harnden, F. R., Kashyap, V., Rosner, R., Prosser, C. F., Damiani, F., Stauffer, J., Caillault, J.-P., 1999, A&A, 341, 751
- [47] Monet, D., et al., 1998, USNO-A V2.0, A Catalog ofA. Donahue and J. A. Bookbinder Astrometric Standards, U.S. Naval Observatory Flagstaff Station (USNOFS) and Universities Space Research Association (USRA) stationed at USNOFS
- [48] Morse, J. A., Mathieu, R. D., Levine, S. E., 1991, 101, 1495
- [49] Noyes, R. W., Weiss, N. O., Vaughan, A. H., 1984, ApJ, 287, 769
- [50] Orlando, S., Peres, G., Reale, F., 2000, ApJ, 528, 524
- [51] Ortolani, A., Pallavicini, R., Maggio, A., Reale, F., White, S. M., 1998, in Donahue, A. and Bookbinder, J. A., eds., ASP Conf. Ser. 154: Cool Stars, Stellar Systems, and the Sun, 10, 1532
- [52] Pallavicini, R., Golub, L., Rosner, R., Vaiana, G. S., Ayres, T., Linsky, J. L., 1981, ApJ, 248, 279
- [53] Pallavicini, R., Tagliaferri, G., & Stella, L. 1990, A&A, 228, 403
- [54] Panzera, M. R., Tagliaferri, G., Pasinetti, L., Antonello, E., 1999, A&A, 348, 161
- [55] Paresce, F. 1984, AJ, 89, 1022
- [56] Parker, E. N., 1975, ApJ, 198, 205
- [57] Pizzolato, N., Maggio, A., Micela, G., Sciortino, S., Ventura, P., 2003, A&A, 397, 147
- [58] Queloz, D., Allain, S., Mermilliod, J.-C., Bouvier, J., Mayor, M., 1998, A&A, 335, 183
- [59] Raboud, D., Mermilliod, J.-C., 1998, A&A, 329, 101
- [60] Reale, F., 2002, in Favata, F., Drake, J., eds., ASP Conf. Ser. 277: Stellar Coronae in the Chandra and XMM-Newton Era. ASP, San Francisco, 103
- [61] Reale, F. & Micela, G., 1998, A&A, 334, 1028
- [62] Reale, F., Betta, R., Peres, G., Serio, S., McTiernan, J., 1997, A&A, 325, 782
- [63] Reale, F., Peres, G., Orlando, S., 2001, ApJ, 557, 906
- [64] Reames, D. V., Meyer, J. P., von Rosenvinge, T. T., 1994, ApJS, 90, 649
- [65] Schmitt, J. H. M. M., 1997, A&A, 318, 215
- [66] Schmitt, J. H. M. M., Golub, L., Harnden, F. R., Jr., Maxson, C. W., Rosner, R., Vaiana, G., 1985, ApJ, 290, 30
- [67] Schmitt, J. H. M. M., Micela, G., Sciortino, S., Vaiana, G. S., Harnden, F. R., Rosner, R., 1990, ApJ, 351, 492
- [68] Schrijver, C. J., 1993, A&A, 269, 446
- [69] Serio, S., Reale, F., Jakimiec, J., Sylwester, B., Sylwester, J., 1991, A&A, 241, 197
- [70] Simon, T., Ayres, T. R., 2000, ApJ, 539, 325
- [71] Simon, T., Drake, S. A., Kim, P. D., 1995, PASP, 107, 1034
- [72] Simon, T., Ayres, T. R., Redfield, S., & Linsky, J. L. 2002, ApJ, 579, 800
- [73] Singh, K. P., Drake, S. A., Gotthelf, E. V., White, N. E., 1999, ApJ, 512, 874
- [74] Soderblom, D. R., Stauffer, J. R., Hudon, J. D., Jones, B. F., 1993, ApJS, 85, 315
- [75] Stauffer, J. R., 1984, ApJ, 280, 202
- [76] Stauffer, J. R., Caillault, J.-P., Gagné, M., Prosser, C. F., Hartmann, L. W., 1994, ApJS, 91, 625
- [77] Stello, D., Nissen, P. E., 2001, A&A, 374, 105
- [78] Stelzer, B., Neuhäuser, R., 2001, A&A, 377, 538
- [79] Stelzer, B., Neuhäuser, R., Hambaryan, V., 2000, A&A, 356, 949
- [80] Stelzer, B. et al., 2002, A&A, 392, 585
- [81] Strüder, L. et al., 2001, A&A, 365, L18
- [82] Terndrup, D. M., Stauffer, J. R., Pinsonneault, M. H., Sills, A., Yuan, Y., Jones, B. F., Fischer, D., Krishnamurthi, A., 2000, AJ, 119, 1303
- [83] Turner, M. J. L. et al., 2001, A&A, 365, L27
- [84] van den Oord, G. H. J., Mewe, R., 1989, A&A, 213, 245
- [85] Vilhu, O., 1984, A&A, 133, 117