Abstract
In this review I highlight the role played by spectrophotometric models in the study of galaxy evolution in distant clusters. I summarize the main achievements of the modeling of k+a spectra, the derivation of the star formation rate in emission-line galaxies, and the stellar ages of red cluster galaxies. The current knowledge of the dependence of the star formation histories on the galaxy morphology and luminosity is also presented.
Chapter 0 Modeling Stellar Populations in
Cluster Galaxies
1 Introduction
The goal of any spectrophotometric modeling is to reconstruct the star formation history of galaxies, to learn what has been the star formation rate (SFR) at each epoch and, as a consequence, the enrichment history of metals and the evolution of the galactic luminosity and mass. In this review I focus on galaxies in mostly distant clusters (), and present the main results obtained using spectrophotometric modeling as a tool to interpret the data.
Quite a few of the spectrophotometric models available today have the ability to include the three main components that produce the spectral energy distribution of a galaxy: (1) the stellar contribution; (2) the emission lines and emission continuum from gas ionized by young massive stars, and (3) the extinction due to dust. Nowadays it is common to include stellar populations of different metallicities, and models can have sufficient wavelength resolution ( Å or better) to study stellar absorption features in detail.
In this context it is useful to think of three types of spectra: those with emission lines and, among those without emission lines, k+a and passive spectra. For each one of these types of spectra there is a stellar time scale associated: yr for emission-line spectra (the lifetime of the massive stars able to ionize the gas); between and yr for k+a spectra (the period during which stars with strong Balmer lines dominate the integrated spectrum of a stellar system); and yr for passive spectra. Each one of these spectral types is described and discussed below.
Whenever my own work will be mentioned in the following, credit should be given to my collaborators of the MORPHS group (H. Butcher, W. Couch, A. Dressler, R. Ellis, A. Oemler, R. Sharples, I. Smail) for distant cluster work, and of the Coma collaboration (T. Bridges, D. Carter, B. Mobasher, Y. Komiyama, S. Okamura, N. Kashikawa, et al.) for results concerning the Coma cluster.


2 k+a Spectra
Historically, k+a spectra (originally named “E+A’s”, also known as -strong galaxies, etc.) were the first type of spectra to be noticed and modeled in distant cluster studies. They are spectra with no emission lines and strong Balmer lines in absorption [EW Å]. A strong-lined example of a k+a galaxy is shown in Figure 1 and contrasted with a passive spectrum.
The second paper that appeared presenting spectra of distant cluster galaxies already pointed out what is still the current interpretation of (the strongest) k+a spectra, that they “indicate a large burst of star formation years before the light left the galaxy” (Dressler & Gunn 1983). A large number of successive papers have discussed k+a spectra in distant clusters (e.g., Henry & Lavery 1987; Fabricant, McClintock, & Bautz 1991; Fabricant, Bautz, & McClintock 1994; Dressler & Gunn 1992; Belloni et al. 1995; Belloni & Roeser 1996; Fisher et al. 1998; Couch et al. 1998; Balogh et al. 1999; Dressler et al. 1999; Poggianti et al. 1999; Bartholomew et al. 2001; Ellingson et al. 2001; Tran et al. 2003); those that have performed spectrophotometric modeling to interpret them include Dressler & Gunn (1983), Couch & Sharples (1987), Newberry, Boroson, & Kirshner (1990), Charlot & Silk (1994), Jablonka & Alloin (1995), Abraham et al. (1996), Barger et al. (1996), Poggianti & Barbaro (1996, 1997), Morris et al. (1998), Bekki, Shioya, & Couch (2001), Shioya, Bekki, & Couch (2001), and Shioya et al. (2002). The main conclusions of k+a modeling can be summarized as follows:
-
1.
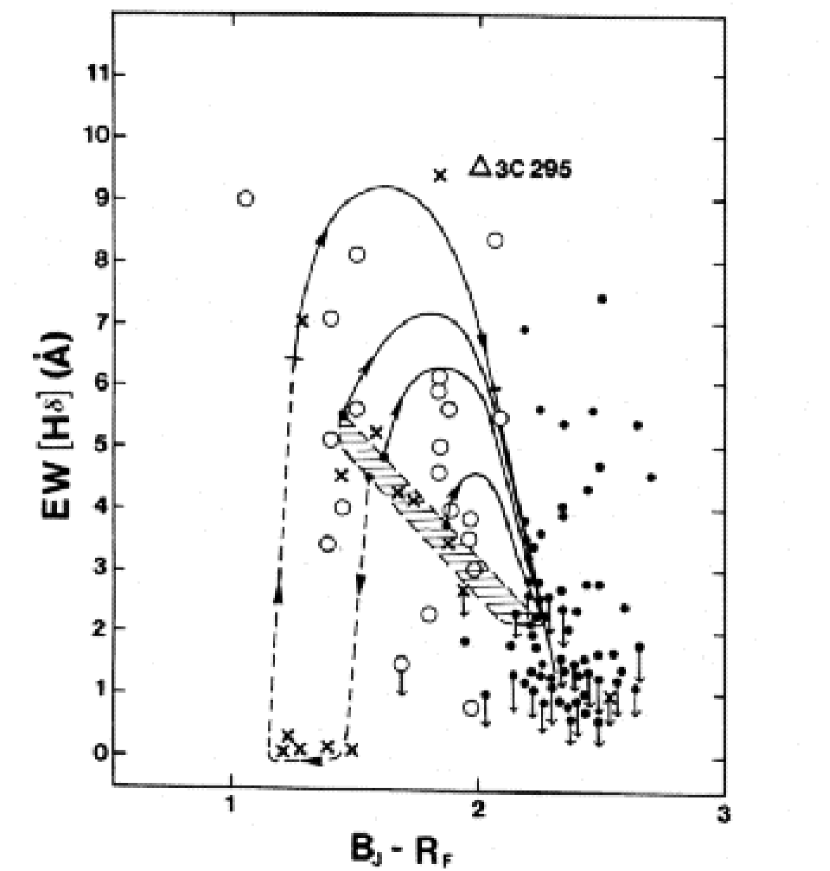
In k+a galaxies, star formation stopped typically between and yr before the epoch at which the galaxy is observed. The evolution of the equivalent width of versus color is shown in Figure 2. This diagram reproduces a plot from the influential paper of Couch & Sharples (1987). Soon after the moment when star formation is interrupted, the galaxy moves in this diagram toward higher EW() and progressively redder colors, reaching a maximum in EW() after yr. Then, the strength of the line starts to decline until the locus occupied by typical ellipticals is reached, in the right bottom corner of the plot.
-
2.
Spectra with very strong EW() (above 5 Å) require a starburst prior to the truncation of the star formation, with high galactic mass fractions involved in the burst (10%–20% or higher). k+a spectra with a moderate line, on the other hand, may be post-starburst galaxies in a late stage of evolution, but may also be reproduced by simply interrupting “normal” star formation activity. The 5 Å limit mentioned above should only be considered indicative: given the strong dependence of the EW value on the method adopted to measure it, the strength of the lines should always be measured in the same way on data and models.
-
3.
A combination of EW() and color, such as that shown in Figure 2, can help in roughly estimating the time elapsed since the halting of star formation. A more sophisticated method to age date the starburst using Balmer-line indices can be found in Leonardi & Rose (1996).
-
4.
A slowly declining SFR, with a time scale comparable to, or longer than, that of the k+a phase (1 Gyr or longer), is not able to produce a k+a spectrum, which is more easily obtained if the star formation is halted quickly. The reason for such behavior is that while the SFR is slowly declining emission lines are still present in the galaxy spectrum, thus the galaxy will not be classified as a k+a. When finally the star formation terminates, the contribution of A-type stars to the integrated spectrum is low, due to the low average level of star formation during the previous Gyr.
A great advantage of the k+a spectral classification is the fact that, in principle, it requires a single measurement (the line), though this must be of sufficiently high signal-to-noise ratio and must be coupled with a complete inspection of the spectrum to verify the absence of any emission line. Analysis of the other higher-order lines of the Balmer series usually greatly helps in confirming the strength of . Moreover, modeling of k+a spectra is relatively simple: the age-metallicity degeneracy that affects the interpretation of passive spectra is not an issue here, because the effect in the strength of the Balmer lines is so large that only age can be the cause for it. The strong Balmer lines arise in A- to F-type stars, which are stars of solar masses on the main sequence, hence in a well known and easily modeled evolutionary phase.
The importance of k+a modeling depends obviously on the importance of the k+a phenomenon in cluster galaxy data. Many works (see list above) have found distant clusters to host a significant number of k+a galaxies. If k+a spectra occur proportionally more in distant clusters than in the field at similar redshifts (as found, e.g., by Dressler et al. 1999; but see Balogh et al. 1999 for a different view), then they provide strong evidence that star formation is rapidly quenched in clusters, and they could be used as tracers both of the star formation history of galaxies infalling into clusters and of the infall history itself. The strongest k+a spectra are a solid signature of a recent starburst; whether this burst was or was not induced by the cluster environment is still an open issue and a subject of ongoing investigation.
Finally, it is not a mere intellectual exercise to note that if a galaxy formed all of its stars on a short time scale, as ellipticals are expected to do in a monolithic-collapse scenario of galaxy formation, then there must have been a phase/epoch when it displayed a spectacular k+a spectrum of an almost pure single stellar population dominated by A stars. In an , km s-1 Mpc-1 cosmology, a galaxy forming all stars within 0.5 Gyr between and would appear as a k+a until . If it stopped forming stars at , it would still be recognizable as a k+a at . The k+a phase of massive ellipticals might be within reach, and possibly we have begun observing it (van Dokkum & Stanford 2003).
3 Emission-line Spectra and Dust
The luminosities of some emission lines in an integrated spectrum can be used to infer the current SFR in a galaxy because, as schematically described below for , the luminosity of the line is proportional to the number of ionizing photons. In a star-forming galaxy the number of ionizing photons is proportional to the number of massive young stars and, for a given stellar initial mass function, to the total current SFR:
| (1) |
In distant galaxy studies, the [O ii] 3727 line is often used instead of because the latter is redshifted out of the optical window. Spectrophotometric models are used to determine the proportionality coefficient between and , and they provide the standard relations between the SFR and the luminosity of the lines (Kennicutt 1992, 1998):
| (2) |
| (3) |
where the line luminosity is in and is the extinction correction factor at . A major uncertainty in these estimates is, therefore, the extinction by dust.
Modeling has focused on starburst and dusty galaxies, while little theoretical work has been done on galaxies forming stars in a continuous, regular fashion, which are another sizable component present in distant clusters. In the following I will not treat the quiescent star-forming galaxies, but will summarize the modeling results for starburst and dusty galaxies.
Several lines of evidence suggest that dust can play an important role in some distant cluster galaxies. In the optical, spectra with weak to moderate [O ii] emission and unusually strong, higher-order Balmer lines were noted to represent a nonnegligible fraction of both cluster and field spectra (Dressler et al. 1999). It was realized that in the local Universe such spectra are rare among normal spirals, while they are common in infrared-luminous starburst galaxies, which are known to have large dust extinction (Poggianti et al. 1999; Poggianti & Wu 2000; see also Liu & Kennicutt 1995). Hence, regardless of the weakness of their emission lines, these galaxies were suggested to be in a starburst phase in which the dust extinction works selectively: the youngest stellar generations are more affected by dust obscuration than older stellar populations, which have had time to free themselves or drift away from their dust cocoons.
Models with selective extinction are empirically motivated by observations of star-forming regions in nearby galaxies, and they explain why different values of are usually measured within the same spectrum when using different spectral features, for example why the extinction measured from the emission lines is usually stronger than that measured from the continuum. Selective extinction is consistent with the fact that in the nearby Universe galaxies with the highest current SFR are generally not those with the strongest emission lines, which tend to be low-mass, very late-type galaxies of moderate total SFR.
Quantitative modeling of these dusty spectra have been done by Shioya & Bekki (2000), Shioya et al. 2001, Bekki et al. (2001), and Poggianti, Bressan, & Franceschini (2001c). While a dust-screen model, with any extinction law, preserves the equivalent width of the lines (because it affects both the line and the underlying continuum by a proportional amount), an age-selective extinction can produce this peculiar spectral combination with weak emission lines (originating in regions with highly extincted, young massive stars) and exceptionally strong, higher-order Balmer absorption lines (from exposed intermediate-age stars).
While a spectrum with moderate emission and unusually strong Balmer lines in absorption is therefore a good candidate for a starburst galaxy, it has been shown that this modeling is highly degenerate, that this peculiar type of spectra does not guarantee SFRs above a certain limit, and that the total SFR remains unknown without dust-free SFR estimators such as far-infrared or radio continuum fluxes. Radio continuum observations of a cluster at , for example, surprisingly have detected some of the strongest (i.e. youngest) k+a galaxies in the cluster (Smail et al. 1999), suggesting that star formation might still be ongoing and be totally obscured at [O ii] by dust in some of the k+a’s (see also the detection in some k+a’s by Balogh & Morris 2000 and Miller & Owen 2002). Mid-infrared 15 m data obtained with ISOCAM have been used to estimate the far-infrared flux and, therefore, the SFR in distant clusters (Duc et al. 2002). As described in Duc et al. (2003), ISOCAM observations of a cluster at have yielded an unexpectedly high number of cluster members that are luminous infrared galaxies with exceptionally high SFRs.
4 Passive Galaxies and Evolutionary Links
A large fraction of galaxies in clusters up to have passive (non-k+a, non-emission-line) spectra. The evolutionary histories of the passive galaxies are the subject of other reviews and contributed talks in these proceedings (see Franx 2003 and Treu 2003); thus, I will limit the following discussion to a description of the most fundamental contributions given to this area of research by spectrophotometric models.
The ages of the stellar populations in luminous, early-type galaxies in clusters are known to be old. Solid evidence for this comes from the analysis and evolution of the red color-magnitude (CM) sequence in clusters, whose slope, scatter, and zeropoint indicate a passive evolution of stars formed at (Bower, Lucey, & Ellis 1992; Aragón-Salamanca, Ellis, & Sharples 1993; Rakos & Schombert 1995; Stanford, Eisenhardt, & Dickinson 1995, 1998; Stanford et al. 1997; Schade et al. 1996; Ellis et al. 1997; Schade, Barrientos, & Lopez-Cruz 1997; Barger et al. 1998; Gladders et al. 1998; Kodama et al. 1998; van Dokkum et al. 1998, 1999, 2000; De Propris et al. 1999; Terlevich et al. 1999; Terlevich, Caldwell, & Bower 2001; van Dokkum & Franx 2001; Vazdekis et al. 2001). Studies of the fundamental plane, mass-to-light ratios, and the magnesium-velocity dispersion relation agree with these findings (Bender, Ziegler, & Bruzual 1996; van Dokkum & Franx 1996; Kelson et al. 1997, 2000, 2001; Ziegler & Bender 1997; Bender et al. 1998; van Dokkum et al. 1998; Ziegler et al. 2001), though they are necessarily limited to the brightest subset of galaxies.

How can these results be reconciled with the presence of numerous blue galaxies in distant clusters (the Butcher-Oemler effect), given that these blue, star-forming galaxies have largely “disappeared” (i.e. become red) by ? This has been investigated by works that have modeled the evolution of galaxy colors and magnitudes (Bower, Kodama, & Terlevich 1998; Smail et al. 1998; Kodama & Bower 2001). Figure 3 presents the results of Kodama & Bower (2001), who have shown that by evolving the observed CM diagram of intermediate-redshift clusters it is possible to obtain a diagram at that is mostly composed of red galaxies, similar to the observed CM diagram of the Coma cluster. Moreover, it is now clear that the CM red sequence of clusters is comprised not only of early-type galaxies, but also contains morphologically classified spirals (Poggianti et al. 1999; Couch et al. 2001; Terlevich et al. 2001; Balogh et al. 2002; Goto et al. 2003a, b).
These results imply that the CM sequence today is composed of a varied population of galaxies with different star formation histories. As shown by several works, including the one by Kodama & Bower (2001), although the principal driver of the CM sequence is the correlation between galaxy luminosity and metallicity, there is still room for a relatively recent epoch of star formation activity in a significant fraction of the (today) red galaxies. When contrasting this with the homogeneity and old ages of red sequence galaxies derived from CM and fundamental plane studies, it is important to take into account two aspects: the morphological transformations in clusters and the evolution of the galaxy luminosities.
1 Morphological Evolution
The morphological mix of galaxies in clusters at various redshifts strongly suggests that a significant fraction of the spirals in distant clusters have evolved into the S0s or, more generally, the early-type galaxies that dominate clusters today (Dressler et al. 1997; Fasano et al. 2000; van Dokkum et al. 2000; Lubin, Oke, & Postman 2002; see Dressler 2003). This morphological evolution is likely to lead to a “progenitor bias”: in distant clusters we would be observing as early-type galaxies only the “oldest” subset of the present-day early-types, those that were already assembled and stopped forming stars at high redshift (van Dokkum & Franx 1996, 2001; Stanford et al. 1998).

The signature of relatively recent star formation activity in some of the early-type galaxies in clusters has been searched for in several ways. Recently, significant differences between the ages of the stellar populations of ellipticals and a fraction of the S0 galaxies have been detected, supporting the scenario of spirals evolving into S0s (Kuntschner & Davies 1998; van Dokkum et al. 1998; Terlevich et al. 1999; Poggianti et al. 2001b; Smail et al. 2001; Thomas 2002). Many of these works derive luminosity-weighted ages and metallicities by comparing a metallicity-sensitive and an age-sensitive spectral index with a grid of spectrophotometric models. Similarly, an age-sensitive and a metallicity-sensitive color index can be used, as shown in Figure 4 (Smail et al. 2001). The plot shows the color-color diagram of galaxies in Abell 2218 at , where a group of faint S0 galaxies is seen to lie at younger luminosity-weighted ages (lower color) than all the ellipticals and the rest of the S0s. The possibility of a spiral-to-S0 transformation has been quantitatively investigated in terms of galaxy numbers and morphologies by Kodama & Smail (2001) and from the spectrophotometric point of view by Bicker, Fritz-v. Alvensleben, & Fricke (2002), providing interesting constraints on the possible evolutionary paths.
However, not all studies find differences between S0s and ellipticals. Ellis et al. (1997), Jørgensen (1999, and references therein), Jones, Smail, & Couch (2000), and Ziegler et al. (2001) do not detect a significant morphological dependence of the stellar population ages and metallicities in early-type cluster galaxies. It is important to stress that the presence of recent star formation in S0s has never been detected in the brightest S0s but becomes a prominent effect when probing fainter down the luminosity function. For example, Coma S0s with recent star formation are fainter than , as expected given the luminosities of their possible spiral progenitors at intermediate redshift (Poggianti et al. 2001b). When studying the dependence of the stellar population properties on the morphological type of galaxies, it is therefore important to simultaneously disentangle the dependence on the galaxy luminosity and to consider the effects of luminosity evolution. This is further discussed in the following section.
2 Luminosity Evolution

There are two aspects of the evolution of galaxy luminosities that are important to stress. The first aspect, already mentioned above, is the fading. As discussed in §1.2, the interruption of star formation seems to be a phenomenon involving a significant fraction of the cluster galaxies. As a consequence, galaxies not only become redder but also fainter: this evolution in luminosity is obviously stronger than the evolution occurring both in the case of passive evolution of an old population and in the case of a galaxy continuously forming stars with no large variation in SFR until . Kodama & Bower (2001) computed the expected fraction of previously blue galaxies as a function of the present-day absolute magnitude, as shown in Figure 5, starting from the CM diagram of three intermediate-redshift clusters and computing the luminosity evolution using models with truncated star formation. The figure shows how the fraction of present-day red galaxies that were blue at higher redshift increases progressively as one goes fainter. The relevance of the fading and the evolution as a function of galaxy luminosity are discussed also in many other works (Postman, Lubin, & Oke 1998; Smail et al. 1998, 2001; van Dokkum et al. 1998; Terlevich et al. 1999; Ferreras & Silk 2000; Poggianti et al. 2001b; Shioya et al. 2002; Merluzzi et al. 2003; Tran et al. 2003).
Related to this, there is a second interesting point related to luminosity, known as the “downsizing effect”: the fact that, as one goes to lower redshifts, the maximum luminosity/mass of galaxies with significant star formation activity seems to be progressively decreasing, possibly both in clusters (Bower et al. 1999) and in the field (Cowie et al. 1996).
An attempt to derive the distribution of luminosity-weighted ages as a function of galaxy luminosity over a range of almost 7 magnitudes has been done for Coma in a new magnitude limited spectroscopic survey (Poggianti et al. 2001a). In this study spectrophotometric models were also used to derive luminosity-weighted ages for spectra without emission lines (the great majority in Coma) from index-index diagrams. These ages give a rough estimate of the time elapsed since the latest star formation activity stopped. This time has been transformed into a cosmological epoch (i.e. redshift) adopting an , km s-1 Mpc-1 cosmology. About half of all non-emission-line galaxies of any magnitude in Coma show no detectable star formation activity during the last 9 Gyr, i.e. since . The other half do show signs of some star formation below this redshift and, interestingly, display a trend of epoch of latest star formation with galaxy magnitude: recent () star formation is detected in 25%–30% of the dwarf galaxies, while only in 5%–10% of the giant galaxies. In contrast, 30%–40% of the giants reveal some star formation at intermediate redshifts (), compared to 15%–20% for the dwarfs.
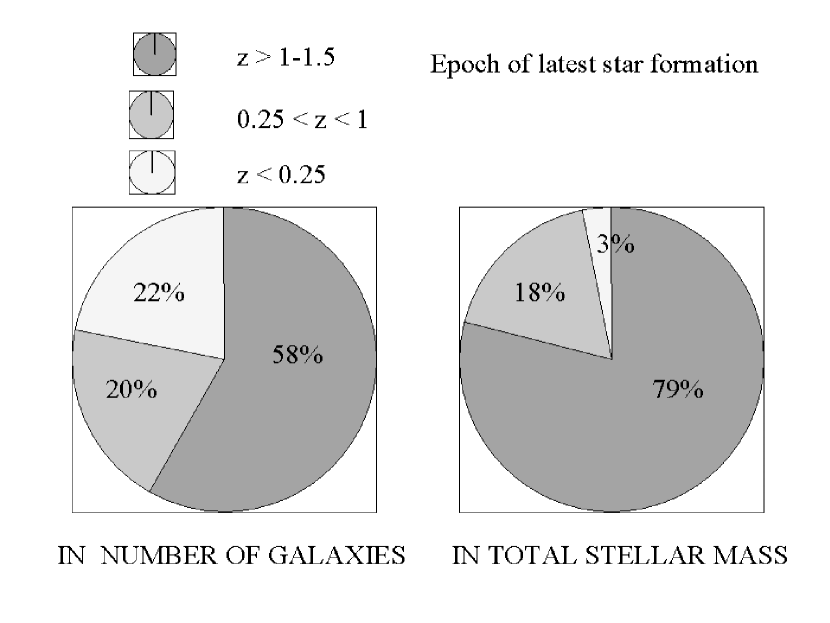
Overall, including all galaxies with between and mag, the fraction of galaxies with signs of star formation at the various epochs is presented in Figure 6 (left). Going a step forward, one can try to quantify the stellar mass involved, transforming the observed luminosities into a mass by adopting the mass-to-light ratio of a single stellar population with an age equal to the luminosity-weighted age derived from the spectral indices. As shown in the right panel of Figure 6, galaxies with some star formation below account for only about 20% of the mass, and those with some star formation at for only 3% of the mass, being mostly low-mass dwarf galaxies. Note that this is not the mass fraction formed at each epoch, but it is the total mass in those galaxies that had some (unquantified) star formation. An example of an attempt to estimate the total mass fraction formed at each redshift using population synthesis models of cluster galaxy colors and magnitudes can be found in Merluzzi et al. (2003), who find, for quiescent, non-starbursting star formation histories, that about 20% of the mass was formed below redshift 1.
Other evidence of a downsizing effect comes from k+a galaxies in clusters at low redshift. A number of works have investigated the presence of Balmer-strong absorption-line galaxies in nearby clusters, especially in Coma (Caldwell et al. 1993, 1996; Caldwell & Rose 1997, 1998; Caldwell, Rose, & Dendy 1999; Castander et al. 2001; Rose et al. 2001). Some of these works have highlighted the tendency of these Balmer-strong galaxies to be intrinsically fainter than the k+a galaxies observed at high redshift. In our Coma survey (Mobasher et al. 2001; Poggianti et al. 2001a) we have found no luminous k+a galaxy down to a magnitude-limit comparable to the MORPHS limit at , while there are strong and frequent cases among faint Coma galaxies at mag. At these magnitudes 10% to 15% of the cluster galaxies are k+a’s, and many of these dwarf spectra are exceptionally strong, post-starburst galaxies (Poggianti et al. 2003).
5 Summary
In this contribution I have summarized the main achievements of spectrophotometric modeling of galaxy evolution in distant clusters. Five main points have been mentioned:
-
1.
k+a spectra unequivocally indicate post-star-forming or post-starburst galaxies, depending on the strength of the Balmer lines.
-
2.
A galaxy with weak to moderate emission lines and strong Balmer lines in absorption is a good candidate for an ongoing starburst, or a galaxy currently forming stars at a vigorous rate.
-
3.
There are observed differences in the stellar population ages between ellipticals and S0 galaxies that are consistent with a significant fraction of the latter having evolved from star-forming spirals at intermediate redshifts. This result is not universal, though, and probing sufficiently faint magnitudes seems to be crucial for detecting any difference, at least at low redshift.
-
4.
The CM sequence in clusters today appears to be a mixed bag. The slope is dominated by metallicity, but there is room for relatively recent star formation in a significant fraction of the galaxies. The bright end of the CM sequence seems to be populated by homogeneously old galaxies, while more and more remnants of galaxies with star formation at intermediate redshifts () can be found as one goes fainter along the sequence.
-
5.
Related to the previous point, a “downsizing effect” is observed in clusters, probably in parallel to a similar effect in the field: toward lower redshifts, the maximum luminosity/mass of galaxies with significant star formation activity progressively decreases. The downsizing effect could be responsible of the fact that k+a cluster spectra appear to occur in luminous galaxies at and in faint (mostly dwarf) galaxies at .
In the next few years the efforts of spectrophotometric modeling will likely concentrate on modeling at higher redshifts than it has been done so far, in order to aid the interpretation of the large photometric and spectroscopic data sets that are being acquired in clusters at . We can expect further progress also at low redshift, where the model improvements, especially regarding the metal abundance ratios, coupled with the new large surveys of nearby clusters and groups, are expected to reveal detailed characteristics of cluster galaxies that can be helpful in constraining their formation histories. As more and better data are obtained, the most important contribution of the modeling will be the endeavor to reach a quantitative general picture that can simultaneously account for the observations at all redshifts.
Acknowledgments. The author wishes to thank the organizers for a very pleasant and interesting Symposium, A. Oemler for reviewing this paper and suggesting numerous improvements to the text, and L. Ho for careful and patient copy-editing.
References
- [1] Abraham, R. G., et al. 1996, ApJ, 471, 694
- [2] Aragón-Salamanca, A., Ellis, R. S., & Sharples, R. M. 1991, MNRAS, 248, 128
- [3] Balogh, M. L., Bower, R. G., Smail, I., Ziegler, B. L., Davies, R. L., Gaztelu, A., & Fritz, A. 2002, MNRAS, 337, 256
- [4] Balogh, M. L.,& Morris, S. L. 2000, MNRAS, 318, 703
- [5] Balogh, M. L., Morris, S. L., Yee, H. K. C., Carlberg, R. G., & Ellingson, E. 1999, ApJ, 527, 54
- [6] Barger, A. J., et al. 1998, ApJ, 501, 522
- [7] Barger, A. J., Aragón-Salamanca, A., Ellis, R. S., Couch, W. J., Smail, I., & Sharples, R. M. 1996, MNRAS, 279, 1
- [8] Bartholomew, L. J., Rose, J. A., Gaba, A. E., & Caldwell, N. 2001, AJ, 122, 2913
- [9] Bekki, K., Shioya, Y., & Couch, W. J. 2001, ApJ, 547, L17
- [10] Belloni, P. Bruzual A., G., Thimm, G. J., & Roeser, H.-J. 1995, A&A, 297, 61
- [11] Belloni, P., & Roeser, H.-J. 1996, A&AS, 118, 65
- [12] Bender, R., Saglia, R. P., Ziegler, B., Belloni, P., Greggio, L., Hopp, U., & Bruzual A., G. 1998, ApJ, 493, 529
- [13] Bender, R., Ziegler, B., & Bruzual A., G. 1996, ApJ, 463, L51
- [14] Bicker, J., Fritze-v. Alvensleben, U., & Fricke, K. J. 2002, A&A, 387, 412
- [15] Bower, R. G., Kodama, T., & Terlevich, A. 1998, MNRAS, 299, 1193
- [16] Bower, R. G., Lucey, J. R., & Ellis, R. S. 1992, MNRAS, 254, 601
- [17] Bower, R. G., Terlevich, A., Kodama, T., & Caldwell, N. 1999, in The Formation History of Early-Type Galaxies, ed. P. Carral & J. Cepa (San Francisco: ASP), 211
- [18] Caldwell, N., & Rose, J. A. 1997, AJ, 113, 492
- [19] ——. 1998, AJ, 115, 1423
- [20] Caldwell, N., Rose, J. A., & Dendy, K. 1999, AJ, 117, 140
- [21] Caldwell, N., Rose, J. A., Franx, M., & Leonardi, A. J. 1996, AJ, 111, 78
- [22] Caldwell, N., Rose, J. A., Sharples, R. M., Ellis, R. S., & Bower, R. G. 1993, AJ, 106, 473
- [23] Castander, F. J., et al. 2001, AJ, 121, 2331
- [24] Charlot, S., & Silk, J. 1994, ApJ, 432, 453
- [25] Couch, W. J., Balogh, M. L., Bower, R. G., Smail, I., Glazebrook, K., & Taylor, M. 2001, ApJ, 549, 820
- [26] Couch, W. J., Barger, A. J., Smail, I., Ellis, R. S., & Sharples, R. M. 1998, ApJ, 497, 188
- [27] Couch, W. J., & Sharples, R. M. 1987, MNRAS, 229, 423
- [28] Cowie, L. L., Songalia, A., Hu, E. M., & Cohen, J. G. 1996, AJ, 112, 839
- [29] De Propris, R., Stanford, S. A., Eisenhardt, P. R., Dickinson, M., & Elston, R. 1999, AJ, 118, 719
- [30] Dressler, A., et al. 1997, ApJ, 490, 577
- [31] Dressler, A. 2003, in Carnegie Observatories Astrophysics Series, Vol. 3: Clusters of Galaxies: Probes of Cosmological Structure and Galaxy Evolution, ed. J. S. Mulchaey, A. Dressler, & A. Oemler (Cambridge: Cambridge Univ. Press), in press
- [32] Dressler, A., & Gunn, J. E. 1983, ApJ, 270, 7
- [33] ——. 1992, ApJS, 78, 1
- [34] Dressler, A., Smail, I., Poggianti, B. M., Butcher, H., Couch, W. J., Ellis, R. S., & Oemler, A. 1999, ApJS, 122, 51
- [35] Duc, P.-A., et al. 2002, A&A, 382, 60
- [36] ——. 2003, in Carnegie Observatories Astrophysics Series, Vol. 3: Clusters of Galaxies: Probes of Cosmological Structure and Galaxy Evolution, ed. J. S. Mulchaey, A. Dressler, & A. Oemler (Pasadena: Carnegie Observatories, http://www.ociw.edu/ociw/symposia/series/symposium3/proceedings.html)
- [37] Ellingson, E., Lin, H., Yee, H. K. C., & Carlberg, R. G. 2001, ApJ, 547, 609
- [38] Ellis, R. S., Smail, I., Dressler, A., Couch, W. J., Oemler, A., Jr., Butcher, H., & Sharples, R. M. 1997, ApJ, 483, 582
- [39] Fabricant, D. G., Bautz, M. W., & McClintock, J. E., 1994, AJ, 107, 8
- [40] Fabricant, D. G., McClintock, J. E., & Bautz, M. W., 1991, ApJ, 381, 33
- [41] Fasano, G., Poggianti, B. M., Couch, W. J., Bettoni, D., Kjærgaard, P., & Moles, M. 2000, ApJ, 542, 673
- [42] Ferreras, I., & Silk, J. 2000, ApJ, 541, L37
- [43] Fisher, D., Fabricant, D., Franx, M., & van Dokkum, P. 1998, ApJ, 498, 195
- [44] Franx, M. 2003, in Carnegie Observatories Astrophysics Series, Vol. 3: Clusters of Galaxies: Probes of Cosmological Structure and Galaxy Evolution, ed. J. S. Mulchaey, A. Dressler, & A. Oemler (Cambridge: Cambridge Univ. Press), in press
- [45] Gladders, M. D., Lopez-Cruz, O., Yee, H. K. C., & Kodama, T. 1998, ApJ, 501, 571
- [46] Goto, T., et al. 2003a, PASJ, 55, 757
- [47] ——. 2003b, in Carnegie Observatories Astrophysics Series, Vol. 3: Clusters of Galaxies: Probes of Cosmological Structure and Galaxy Evolution, ed. J. S. Mulchaey, A. Dressler, & A. Oemler (Pasadena: Carnegie Observatories, http://www.ociw.edu/ociw/symposia/series/symposium3/proceedings.html)
- [48] Henry, J. P, & Lavery, R. J. 1987, ApJ, 323, 473
- [49] Jablonka, P., & Alloin, D. 1995, A&A, 298, 361
- [50] Jones, L., Smail, I., & Couch, W. J. 2000, ApJ, 528, 118
- [51] Jørgensen, I. 1999, MNRAS, 306, 607
- [52] Kelson, D. D., Illingworth, G. D., Franx, M., & van Dokkum, P. G. 2001, ApJ, 552, L17
- [53] Kelson, D. D., Illingworth, G. D., van Dokkum, P. G., & Franx, M. 2000, ApJ, 531, 184
- [54] Kelson, D. D., van Dokkum, P. G., Franx, M., Illingworth, G. D., & Fabricant, D. 1997, ApJ, 478, L13
- [55] Kennicutt, R. C. 1992, ApJ, 388, 310
- [56] ——. 1998, ARA&A, 36, 189
- [57] Kodama, T., Arimoto, N., Barger, A. J. & Aragón-Salamanca, A. 1998, A&A, 334, 99
- [58] Kodama, T., & Bower, R. G. 2001, MNRAS, 321, 18
- [59] Kodama, T., & Smail, I. 2001, MNRAS, 326, 637
- [60] Kuntschner, H., & Davies, R. L. 1998, MNRAS, 295, L29
- [61] Leonardi, A. J., & Rose, J. A. 1996, AJ, 111, 182
- [62] Liu, C. T., & Kennicutt, R. C. 1995, ApJ, 450, 547
- [63] Lubin, L. M., Oke, J. B., & Postman, M. 2002, AJ, 124, 1905
- [64] Merluzzi, P., La Barbera, F., Massarotti, M., Busarello, G., & Capaccioli, M. 2003, ApJ, 589, 147
- [65] Miller, N. A, & Owen, F. N. 2002, AJ, 124, 2453
- [66] Mobasher, B., et al. 2001, ApJS, 137, 279
- [67] Morris, S. L., Hutchings, J. B., Carlberg, R. G., Yee, H. K. C., Ellingson, E., Balogh, M. L., Abraham, R. G., & Smecker-Hane, T. A. 1998, ApJ, 507, 84
- [68] Newberry, M. V., Boroson, T. A., & Kirshner, R. P. 1990, ApJ, 350, 585
- [69] Poggianti, B. M., & Wu, H. 2000, ApJ, 529, 157
- [70] Poggianti, B. M., et al. 2001a, ApJ, 562, 689
- [71] ——. 2001b, ApJ, 563, 118
- [72] ——. 2003, in preparation (astro-ph/0208181)
- [73] Poggianti, B. M., & Barbaro, G. 1996, A&A, 314, 379
- [74] ——. 1997, A&A, 325, 1025
- [75] Poggianti, B. M., Bressan, A., & Franceschini, A. 2001c, ApJ, 550, 195
- [76] Poggianti, B. M., Smail, I., Dressler, A., Couch, W. J., Barger, A. J., Butcher, H., Ellis, R. S., & Oemler, A. 1999, ApJ, 518, 576
- [77] Poggianti, B. M., & Wu, H. 2000, ApJ, 529, 157
- [78] Postman, M., Lubin, L. M., & Oke, J. B. 1998, AJ, 116, 560
- [79] Rakos, K. D., & Schombert, J. M. 1995, ApJ, 439, 47
- [80] Rose, J. A., Gaba, A. E., Caldwell, N., & Chaboyer, B. 2001, AJ, 121, 793
- [81] Schade, D., Barrientos, L. F., & Lopez-Cruz, O. 1997, ApJ, 477, L17
- [82] Schade, D., Carlberg, R. G., Yee, H. K. C., Lopez-Cruz, O., & Ellingson, E. 1996, ApJ, 464, L63
- [83] Shioya, Y., & Bekki, K. 2000, ApJ, 539, L29
- [84] Shioya, Y., Bekki, K., & Couch, W. J. 2001, ApJ, 558, 42
- [85] Shioya, Y., Bekki, K., Couch, W. J., & De Propris, R. 2002, ApJ, 565, 223
- [86] Smail, I., Edge, A. C., Ellis, R. S., Blandford, R. D. 1998, MNRAS, 293, 124
- [87] Smail, I., Kuntschner, H., Kodama, T., Smith, G. P., Packham, C., Fruchter, A. S., & Hook, R. N. 2001, MNRAS, 323, 839
- [88] Smail, I., Morrison, G., Gray, M. E., Owen, F. N., Ivison, R. J., Kneib, J.-P., & Ellis, R. S. 1999, ApJ, 525, 609
- [89] Stanford, S. A., Eisenhardt, P. R. M., & Dickinson, M. 1995, ApJ, 450, 512
- [90] ——. 1998, ApJ, 492, 461
- [91] Stanford, S. A., Elston, R., Eisenhardt, P. R., Spinrad, H., Stern, D., & Dey, A. 1997, AJ, 114, 2232
- [92] Terlevich, A. I., Caldwell, N., & Bower, R. G. 2001, MNRAS, 326, 1547
- [93] Terlevich, A. I., Kuntschner, H., Bower, R. G., Caldwell, N., & Sharples, R. M. 1999, MNRAS, 310, 445
- [94] Thomas, T. 2002, Ph.D. Thesis, Univ. Leiden
- [95] Tran, K., Franx, M., Kelson, D. D., Illingworth, G. D., van Dokkum, P. G., & Kelson, D. D. 2003, in Carnegie Observatories Astrophysics Series, Vol. 3: Clusters of Galaxies: Probes of Cosmological Structure and Galaxy Evolution, ed. J. S. Mulchaey, A. Dressler, & A. Oemler (Pasadena: Carnegie Observatories, http://www.ociw.edu/ociw/symposia/series/symposium3/proceedings.html)
- [96] Treu, M. 2003, in Carnegie Observatories Astrophysics Series, Vol. 3: Clusters of Galaxies: Probes of Cosmological Structure and Galaxy Evolution, ed. J. S. Mulchaey, A. Dressler, & A. Oemler (Cambridge: Cambridge Univ. Press), in press
- [97] van Dokkum, P. G., & Franx, M. 1996, MNRAS, 281, 985
- [98] ——. 2001, ApJ, 553, 90
- [99] van Dokkum, P. G., Franx, M., Fabricant, D., Illingworth, G. D., & Kelson, D. D. 2000, ApJ, 541, 95
- [100] van Dokkum, P. G., Franx, M., Fabricant, D., Kelson, D. D., & Illingworth, G. D. 1999, ApJ, 520, L95
- [101] van Dokkum, P. G., Franx, M., Kelson, D. D., Illingworth, G. D., Fisher, D., & Fabricant, D. 1998, ApJ, 500, 714
- [102] van Dokkum, P. G., & Stanford, S. A. 2003, 585, 78
- [103] van Dokkum, P. G., Stanford, S. A., Holden, B. P., Eisenhardt, P. R., Dickinson, M., & Elston, R. 2001, ApJ, 552, L101
- [104] Vazdekis, A., Kuntschner, H., Davies, R. L., Arimoto, N., Nakamura, O., & Peletier, R. F. 2001, ApJ, 551, L127
- [105] Ziegler, B., & Bender, R. 1997, MNRAS, 291, 527
- [106] Ziegler, B. L., Bower, R. G., Smail, I., Davies, R. L., & Lee, D. 2001, MNRAS, 325, 1571