A Possible Shock Wave in the Intergalactic Medium of the Cluster of Galaxies A754
Abstract
The cluster of galaxies A754 undergoes a merger of several large structural units. X-ray observations show a nonequilibrium state of the central part of the cluster, in which a cloud of cold plasma 500 kpc in size was identified amid the hotter cluster gas. The X-ray image of A754 exhibits a brightness discontinuity, which can be interpreted as a shock wave in front of a moving cloud of dense gas.The shock parameters are determined from the jump in intergalactic gas density using the ROSAT image. The estimated Mach number is at a 68% confidence level.
2003297425[428]
Accepted for publication in Astron.Lett.
1 INTRODUCTION
Clusters of galaxies are the largest gravitationally bound objects in the Universe. Mergers of clusters result in the release of potential energy into the intergalactic medium at a level of erg, mainly in the form of heating by shock waves. Therefore, observations of shock waves in the intergalactic medium are particularly interesting because they provide information for studying the physical processes that accompany the cluster formation.
In this paper we study A754, a rich cluster of galaxies at z = 0.0541 in the stage of violent formation. ASCA observations of this cluster clearly indicate that the central part of the cluster is in a nonequilibrium state and hot and cold regions are identifiable in it (Henriksen and Markevitch 1996).The pattern probably represents the motion of a cold dense cloud through a hotter ambient gas. Structures of this kind were observed by the Chandra satellite in several clusters (Markevitch et al. 2000; Vikhlinin et al. 2001; Mazzota et al. 2001).The merging parts of the clusters are generally expected to move at a supersonic speed, which leads to the formation of shock waves.
The ROSAT X-ray image of A754 exhibits a surface brightness discontinuity, which can be interpreted as a shock wave in front of a moving cloud of dense gas. The amplitude of the surface brightness discontinuity makes it possible to determine the jump in gas density at the shock front and, hence, the Mach number , where is the shock velocity and is the speed of sound in the medium. Unfortunately, the ROSAT energy range (0.5-2.5 keV) does not allow us to determine the gas temperature at the shock boundary; i.e., we cannot independently verify the interpretation of the brightness discontinuity as a shock wave using the temperature jump.
We quote the physical length scales assuming km s-1 Mpc-1. The derive shock velocity and Mach number are independent of .
2 DATA ANALYSIS
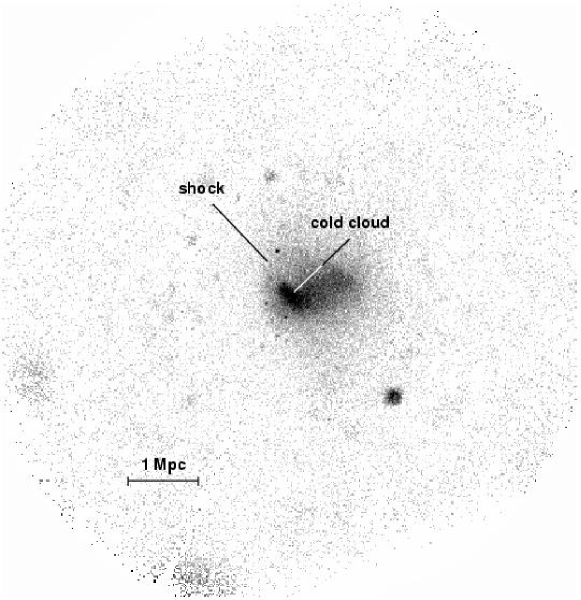
The ROSAT image of the cluster of galaxies A754 is shown in Figure 1. The region of cold gas appears as a bright cloud at the image center. The shape and location of a brightness discontinuity to the left from the center are consistent with those of a shock in front of a cloud of cold gas moving at a supersonic speed.
Quantitative information about the gas density distribution can be obtained by analyzing the surface brightness profile. The shape of the front of the putative shock is well described by a circle with a radius of 775 kpc. We use the center of this circle as the reference point for radial distances. The surface brightness profile was extracted in a sector with respect to the front symmetry axis111The sector opening angle was determined by the size of the brightness discontinuity region; the brightness profile for the outer part of the shock was obtained in a wider sector () to improve statistics.. The profile was measured in concentric rings of equal logarithmic width; the ratio of the inner and outer ring radii was 1.01. We verified that varying the reference point changed the measured jump in gas density only slightly.
Measuring the gas density distribution at large radii requires careful background subtraction and corrections for the telescope vignetting. We used S. Snowden’s software (Snowden et al. 1994) for the data reduction. The software allows one to eliminate the periods of an anomalously high background of particles and scattered solar X-ray emission. In addition, the exposure maps are computed and all of the known background components are fitted and subtracted from the image. The final result is the image in a given energy range that contains only the cluster radiation, point-like X-ray sources, and the cosmic X-ray background. An optimal ratio of the cluster surface brightness to the background level is achieved by using data above 0.7 keV.
When measuring the X-ray brightness profile, we eliminated all of the detectable point-like sources and all the extended sources unrelated to the main cluster emission. The cluster makes a significant contribution to the total brightness even at large distances from the center (). Therefore, it is hard to identify a region that could be used to directly determine the background level. Instead, we derived the background level by fitting the brightness profile at large distances with the model consisting of a -model (Cavaliere and Fusco-Femiano 1976) representing the cluster emission and a constant component representing background:
| (1) |
where is the surface brightness, is the background intensity, and is the core radius.
3 FITTING THE BRIGHTNESS PROFILE
The main parameter of the shock motion is the Mach number, .The Mach number can be expressed in a standard way (Landau and Lifshitz 1988) in terms of the jump in any of the gas parameters (density, pressure, temperature) at the shock front. The most easily measurable quantity is the density jump, because the gas density is related to the emissivity by a simple relation: . Consequently, the problem reduces to deprojecting the brightness discontinuity.
The brightness profile can be best deprojected by fitting the data by some analytic dependence. Since the outer part of the cluster is most likely to have not yet been perturbed by the shock, we can assume that the gas density profile is described by the standard -model. Inside the shock front, we will be concerned with a narrow range of radii in which the density profile can be assumed, to sufficient accuracy, to be a power-law function of radius. Thus, we have the following model of the plasma emissivity:
| (2) |
where R is the front position, is the post-shock emissivity, and is the central emissivity for the model. The core radius was fixed at a typical value of 250 kpc (Jones and Forman 1984).
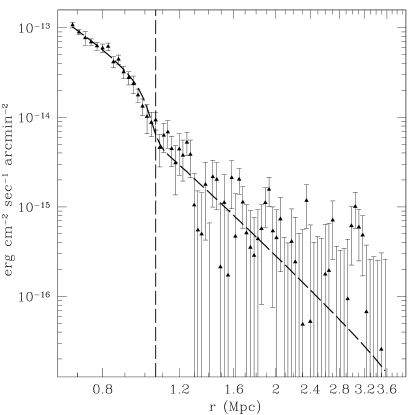
The model emissivity profile was numerically integrated along the line of sight and folded with the angular resolution of the telescope (). Note that the normalization of the model in equation (2) can be expressed in terms of the pre-shock emissivity, . To determine the parameters of the above model, we minimized the value for four parameters (). Figure 2 shows the derived model of the gas emissivity distribution (b) and the surface brightness profile (a).

4 RESULTS
The emissivity jump obtained by fitting the brightness profile is trivially transformed to the density jump ():
| (3) |
where the uncertainties are at a 68% confidence level for one interesting parameter. From the ratio, we find the Mach number of the shock with respect to the ambient gas:
| (4) |
where is the adiabatic index for monatomic gas. From (4), we obtain at a 68% 1 = 1.71+0.45 -0.24 confidence level 68% (see Fig.3).


The derived value of corresponds to the gas temperature jump . In principle, measuring such a temperature discontinuity would be an independent test of the validity of the interpretation of the observed structure as a shock wave. Unfortunately, the available Chandra and XMM observations of A754 do not allow us to determine the gas temperature outside the shock because of the low signal-to-noise ratio. Inside the shock, the temperature is measured reliably, keV (Markevitch et al. 2003) from Chandra data.
A useful quantity is the shock velocity relative to the gas on the inner side of the discontinuity:
| (5) |
The measured value of allows us to determine the speed of sound and, hence, the absolute shock velocity: km s-1, km .
The derived Mach number of a likely shock in A754 is close to the theoretically expected values for merging clusters: (Sarazin 2002). Comparison with other clusters is hard because observations of merger shocks in clusters are is still rare. In two other best-studied cases, (1E0657-56–Markevitch et al. 2002, Cyg A–Markevitch et al. 1999), high Mach numbers are also inferred. However, in A3667 one observes a merger with (Vikhlinin et al. 2001). Clearly, detailed studies of a larger sample of merging clusters would be valuable.
5 ACKNOWLEDGMENTS
This work was supported by the Russian Basic Research Foundation (grants 00-02-1724 and 00-15-96699), and by the “Young Scientist” and “Nonstationary Astronomical Phenomena” programs of the Russian Academy of Sciences.
References
- [1] A.Cavaliere and R.Fusco-Femiano, Astron.Astrophys. 49, 137 (1976).
- [2] M.Henriksen and M.Markevitch, Astrophys.J.466, L79 (1996).
- [3] J.P.Henry and U.G.Briel, Astrophys.J.443, L9 (1995).
- [4] C.Jones and W.Forman, Astrophys.J. , 276, 38 (1984).
- [5] L.D.Landau and E.M.Lifshitz, Hydrodynamics (Nauka, Moscow, 1988).
- [6] M.Markevitch, A.H.Gonzalez, L.David, et. al., Astrophys.J.567, L27 (2002).
- [7] M.Markevitch, P.Mazzota, A.Vikhlinin, et. al., As- trophys.J.(2003, in press).
- [8] M.Markevitch, T.J.Ponman, P.E.J.Nulsen, et. al., Astrophys.J.541, 542 (2000).
- [9] C.Sarazin, Astrophys.Space Sci.272, 1 (2002).
- [10] S.L.Snowden, D.McCammon, D.N.Burrows, et. al., Astrophys.J.424, 714 (1994).
- [11] A.Vikhlinin and M.Markevitch, Pis’ma Astron.Zh. 28, 563 (2002) [Astron.Lett.28, 495 (2002)].