Magnetic Field Morphology of Orion-IRc2
from 86 GHz SiO Maser Polarization Images
Abstract
In an attempt to probe the magnetic field morphology near the massive young star Orion-IRc2, we mapped the linear polarization of its J=2–1 SiO masers, in both the v=0 and v=1 vibrational levels, with resolution. The intense v=1 masers are confined to a narrow zone 40 AU from the star. Their polarization position angles vary significantly on time scales of years. For the v=1 masers the stimulated emission rate is likely to exceed the Zeeman splitting due to any plausible magnetic field; in this case the maser polarization need not correlate with the field direction. The much weaker v=0 masers in the ground vibrational level lie 100–700 AU from IRc2, in what appears to be a flared disk. Their fractional polarizations are as high as 50%. The polarization position angles vary little across the line profile or the emission region, and appear to be stable in time. The position angle, P.A. = 80°, we measure for the J=2–1 masers differs by 70° from that measured for the J=1–0 SiO transition, possibly because of Faraday rotation in the foreground, Orion A, H II region. A rotation measure rad m-2 is required to bring the J=2–1 and J=1–0 position angles into concordance. The intrinsic polarization position angle for both transitions is then 57°, parallel to the plane of the putative disk. Probably the magnetic field threads the disk poloidally. There is little evidence for a pinched or twisted field near the star.
1 Introduction
As an interstellar cloud collapses to form a star, the magnetic field lines threading the cloud are expected to be dragged along with the infalling gas, producing an hourglass-shaped field pattern centered on the star (e.g., Galli & Shu 1993). In many theoretical models the field is then wound up by rotation in a circumstellar disk, producing a toroidal field component which collimates the outflow from the star into two oppositely directed lobes; the outflow carries away angular momentum, allowing further accretion onto the star (Uchida & Shibata, 1985; Pudritz & Norman, 1986; Newman, Newman, & Lovelace, 1992).
So far the observational evidence for pinched or twisted fields near young stars is scant, although there are possible detections toward W3 (Greaves, Murray, & Holland, 1994), Mon R2 (Greaves, Holland, & Murray, 1995), and a number of other cloud cores (Greaves & Holland, 1998). These observations used the linearly polarized emission from circumstellar dust to probe the magnetic field morphology. Spinning dust grains tend to align their long axes perpendicular to the magnetic field, so thermal emission from the grains is polarized perpendicular to the field.
Toward the Orion molecular cloud, Schleuning (1998) found evidence for a large scale hourglass distortion of the magnetic field from dust polarization observations at 100 and 350 m. The pinched region has a radius of 0.5 pc (200″) and is centered 0.1 pc southwest of the Kleinmann-Low nebula, a site of high mass star formation. On smaller scales, within the Orion-KL complex, Chrysostomou, et al. (1994) found evidence for a twisted field within roughly 1500 AU (3″) of the star IRc2, based on imaging polarimetry of the 2 m S(1) line of H2. The line emission, assumed unpolarized, originates from shock-excited H2 in the bipolar outflow from IRc2. Absorption by aligned grains in front of the outflow produces the polarization. Aitken et al. (1997) also found evidence for a twisted field near IRc2 from 1.5″ resolution polarization maps at 12.5 m and 17 m. Spectropolarimetry of the 8–13 and 16–22 m bands was used to separate the effects of absorption and emission, which lead to polarizations parallel and perpendicular to the magnetic field, respectively. Rao, et al. (1998) obtained 4″ resolution interferometric maps of Orion-KL at wavelengths of 1.3 and 3.5 mm, where the dust emission is certainly optically thin. These maps showed an abrupt 90° change in the polarization angle southeast of IRc2, in agreement with the infrared data. But because the region of anomalous polarization was suspiciously coincident with the redshifted lobe of the bipolar outflow from IRc2, Rao et al. suggested that dust grains in this zone might be aligned by a wind from the star, rather than by the usual Davis-Greenstein mechanism. If the grains are mechanically aligned then thermal emission can be polarized parallel to the magnetic field, so there is no need to conclude that the field is kinked.
Unfortunately, polarized dust emission from IRc2 may not be a reliable probe of the magnetic field near the central star because of confusion by dust emission from the surrounding molecular cloud. The stellar position is coincident with radio source ‘I’ (Menten & Reid, 1995). The IRc2 infrared peak is offset 1″ northwest of source I, while the millimeter-wavelength peak is offset 1″ southeast of source I, toward the ‘hot core’ clump. The radio spectrum of source I itself from 8 GHz to 86 GHz is consistent with free-free emission from ionized gas in a circumstellar shell; there is no evidence for excess flux at 86 GHz which would be the signature of circumstellar dust (Plambeck et al., 1995).
By contrast, SiO masers do unambiguously originate in gas very close to source I. Intense masers in the v=1 vibrational level are confined to a zone approximately 40 AU from the star (Plambeck, Wright, & Carlstrom, 1990; Menten & Reid, 1995; Greenhill et al., 1998; Doeleman, Lonsdale, & Pelkey, 1999), while weaker masers in the ground vibrational state are found 100–700 AU from the star, in an elongated, bowtie-shaped region (Wright et al., 1995; Chandler & de Pree, 1995). Both the v=1 and v=0 masers are linearly polarized (Barvainis, 1984; Tsuboi et al., 1996). Since the maser polarization direction is expected, under many circumstances, to be parallel or perpendicular to the magnetic field direction (Goldreich, Keeley, & Kwan, 1973), SiO masers may provide the best probe of the magnetic field morphology within 700 AU of source I. Indeed, from early measurements showing a symmetric rotation of the polarization angle across the double-peaked v=1 maser spectrum, Barvainis (1984) concluded that the magnetic field direction rotated with azimuth in a disk around the star.
Here we discuss polarization measurements of both the v=0 and v=1 SiO masers toward Orion-IRc2 obtained with 0.5″ angular resolution, 250 AU at the distance of Orion. We find that the polarization of the v=1 maser is time variable, casting doubt upon its usefulness as a probe of the magnetic field. However, the v=0 maser polarization appears to be a good probe of the field morphology. It provides little evidence for pinched or twisted fields near the star.
2 Observations
Observations were made between 1996 June and 2001 March with the BIMA array.111Operated by the Berkeley-Illinois-Maryland Association with support from the National Science Foundation. Orion-KL was observed using the A, B, and C antenna configurations, providing antenna separations from 6.3 m to 1.8 km. The correlator was configured to allow simultaneous observations of the J=2–1 SiO transitions in both the v=1 and v=0 vibrational states, at frequencies of 86.243 and 86.847 GHz. The velocity resolution was 0.34 km s-1. Single sideband system temperatures, scaled to outside the atmosphere, ranged from 170 K to 350 K. The data were calibrated and analysed using the MIRIAD software package (Sault, Teuben, & Wright, 1995).
The receivers are sensitive to a single linear polarization, but are equipped with movable quarter wave plates to observe right or left circular polarization. As described by Rao, et al. (1998), each receiver was switched between LCP and RCP with a Walsh function pattern in order to sample all possible crosscorrelations (RR, RL, LR, LL) on each baseline as rapidly as possible. The integration time for each observation was 11.5 seconds. The data were self-calibrated on the strongest v=1 maser feature, using the LL and RR crosscorrelations, then averaged in 5 minute blocks to produce quasi-simultaneous dual polarization observations.
The quarter wave plates are designed for a frequency of 89 GHz, where they have a leakage to the unwanted polarization of around 1%. At 86 GHz the leakage is about 3%. We calibrate the leakage by observing a point source over a wide range of hour angle. For altitude-azimuth antennas the phase of a linearly polarized source rotates with the parallactic angle, whereas the leakage terms are constant. We used observations of 3c273, 3c279, and the SiO v=1 maser itself to calibrate the leakage. The measured polarizations of both the v=1 and v=0 masers are quite insensitive to the leakage correction: for the weakly polarized v=1 line, the source is unresolved and the leakage averages out over the wide range of parallactic angles observed, while for the v=0 line the source polarization is much larger than the leakage.
Images were made for a range of weightings of the uv-data. With uniform weighting the synthesised beam is FWHM. For the final images we used robust weighting, deconvolved using the CLEAN algorithm, and convolved with a circular FWHM Gaussian beam.
3 Results
3.1 The v=1 Masers
Figure 1 summarizes the observational results for the v=1 masers over a 3.5 year period. For each of 6 epochs, we plot the total intensity, fractional polarization, and polarization position angle across the double-peaked spectrum. All 3 quantities vary on time scales of years. The fractional polarization usually is less than 10%, and tends to be anticorrelated with maser intensity – that is, the strongest maser features typically have the lowest fractional polarization. The weak maser feature near VLSR 7 km s-1 which appeared in 1999 has an anomalously high fractional polarization of 30%. The polarization position angles vary considerably across the line profiles, although a crude median value is P.A. 80°, shown by the dashed line in Figure 1. Often the position angle “kinks” at the peak of a maser feature. The symmetric pattern of polarization position angles seen in the 1996 August data is similar in character to that measured by Barvainis & Predmore (1985) in 1981 June.
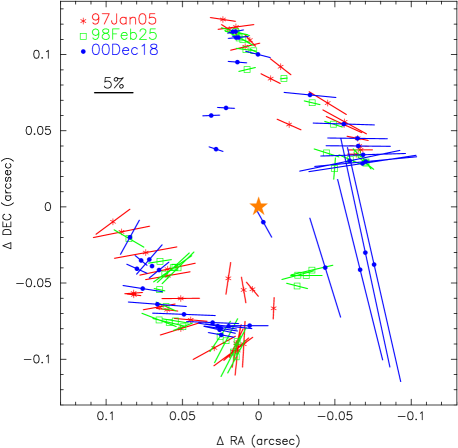
The v=1 masers are unresolved in 0.5″ resolution images. Nevertheless, the high signal to noise ratio of the maps, in excess of 5000:1 on the strongest maser features, allows us to fit the centroid of the maser position in each velocity channel to an accuracy of ″. The centroids are arranged in an 0.15″ diameter ring with a stable, systematic velocity pattern (Plambeck, Wright, & Carlstrom, 1990; Wright et al., 1995; Baudry, Herpin, & Lucas, 1998). In Figure 2, the polarization vectors for individual 1 km s-1 velocity channels are plotted on the corresponding centroid positions for 3 different epochs. Variations in the polarization angle do not appear to correlate with movements of spots. Below we argue that the polarization angles of the v=1 masers may be determined by the maser beaming direction, rather than the magnetic field, accounting for the time variability.
Plambeck, Wright, & Carlstrom (1990) were able to fit the v=1 maser spectrum and centroid positions with a model of maser emission from a rotating, expanding disk. Higher resolution, VLBA observations (Greenhill et al., 1998; Doeleman, Lonsdale, & Pelkey, 1999) show, however, that the strongest maser features are clustered into four groups, plausibly in the walls of the bipolar outflow from source I. Although Doeleman et al. emphasize the differences between the disk and outflow models, the distinctions are in part semantic – the disk modeled by Plambeck et al. had a sharp inner radius of 40 AU and a thickness of 40 AU, and the maser pump rate and SiO density were fitted to obtain particularly strong maser emission from the inner walls of this cylinder, not so different from the outflow model. Nevertheless, it is clear that the velocity field hypothesized by Plambeck et al. is an oversimplification.
3.2 The v=0 Masers
The bulk of the v=0 J=2–1 SiO emission from the Orion-KL core is thermal. Much of it originates from high velocity gas in the bipolar outflow from IRc2 (Wright et al., 1983). With arcsecond angular resolution, most of this extended emission is resolved out, revealing a bright “bowtie” centered on source I. The peak brightness temperatures in the bowtie are K, almost certainly indicating maser emission (Wright et al., 1995). Figure 3 compares total intensity and polarized spectra of Orion-IRc2 generated from high and low resolution maps. The polarized flux densities integrated over and boxes are nearly identical, indicating that most of the polarized emission originates from the masers.
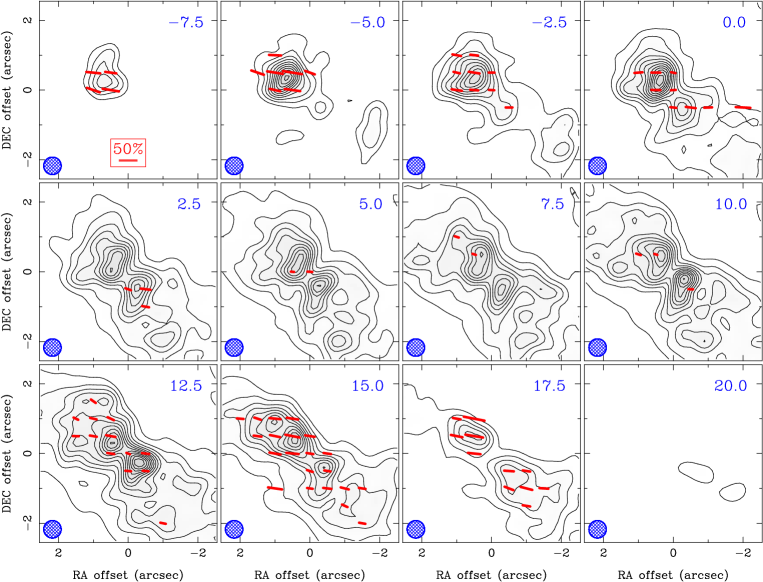
SiO channel maps with resolution are shown in Figure 4. The r.m.s. noise in the and Stokes intensity maps is 0.05 Jy/beam. Polarization vectors are overlaid wherever the linearly polarized flux is detected with or greater significance; hence the polarization position angles shown are uncertain by °. Apart from a slight twist of the polarization vectors at the northern edge of the VLSR 12.5 km s-1 map, there are no obvious systematic changes in polarization angle with velocity or position. The polarization direction, P.A. 80°, is offset by 30° from the long axis of the bowtie. The fractional polarization is as high as 50% in the channels near the upper and lower edges of the line profile, near VLSR and km s-1.
The SiO linewidths in the bowtie are too large for this gas to be gravitationally bound to source I. The “shell” H2O masers in Orion-IRc2 overlie the inner regions of the bowtie. Proper motion measurements show that these masers are moving outward from source I at 20 km s-1, perpendicular to the axis of the high velocity outflow (Greenhill et al., 1998). Probably the v=0 SiO masers and H2O masers are part of a low velocity outflow which is pushing into, or around, dense gas in the equatorial plane of the star, plausibly the remnants of the “pseudodisk” which formed in the intial collapse of the cloud (Galli & Shu, 1993).
4 Discussion
4.1 Maser Polarization Mechanisms
It is remarkable that a magnetic field with a strength of a few milligauss can affect an SiO maser in any observable way, given that the Zeeman splitting induced by the field is orders of magnitude smaller than the maser linewidth . For SiO, Hz/milligauss (Nedoluha & Watson, 1990), while individual J=2–1 maser features have linewidths of order 0.5 km s-1, or Hz. Nevertheless, polarization arises because of the selection rules which govern dipole transitions between energy levels. Radiation polarized parallel to the field cannot change the component of molecular angular momentum along the field direction, hence ; conversely, for radiation polarized perpendicular to the field (Townes & Schawlow, 1975). These rules cause the maser gain to differ for polarizations parallel and perpendicular to the magnetic field.
A simple example given by Goldreich, Keeley, & Kwan (1973) illustrates this mechanism. Consider a maser in the J=1–0 transition. In the presence of a magnetic field, the J=1 state is split into 3 sublevels (). If a maser beam propagates at right angles to the field, radiation polarized parallel to the field induces transitions only from the state to the state, while radiation polarized perpendicular to the field induces transitions from both the and states to the state. If the pumping rates into the 3 upper sublevels are equal, and if the maser is saturated – that is, every excitation to the upper state leads to the emission of a maser photon – then two photons polarized perpendicular to the field are emitted for every one photon polarized parallel to the field. Hence the net fractional linear polarization is 1/3, perpendicular to the field.
In the more general situation where the maser propagates at angle with respect to the field, radiation polarized parallel to the projected field direction couples to all 3 magnetic sublevels, while that polarized perpendicular to the field couples only to the sublevels. Hence, as decreases from toward 0, the gain of the parallel component increases while the gain of the perpendicular component decreases. In the limit , where is the stimulated emission rate and is the decay rate from collisions or spontaneous emission, Goldreich, Keeley, & Kwan (1973) show that the net linear polarization for a J=1–0 maser is perpendicular to the projected field for ° (), and parallel to the projected field for °.
Western & Watson (1984) found that these same asymptotic limits applied to the J=2–1 rotational transition. In addition, they considered the case where the magnetic sublevels were pumped unequally, which can easily occur if the vibrational energy levels are excited by an anisotropic radiation field, for example by infrared photons from a nearby star. Small differences in the absolute populations of these sublevels correspond to large fractional differences in the population inversion, and hence the maser gain. Therefore, anisotropic pumping tends to enhance the fractional polarization, and also changes the angle at which the polarization flips from perpendicular to parallel. Nonetheless, as long as and , the net linear polarization is either parallel or perpendicular to the projected field direction.
Unhappily, the requirement is likely to be violated for intense masers, for which the stimulated emission rate becomes large. As increases, the “good” quantum axis shifts from the magnetic field direction to the propagation direction of the maser beam. Calculations by Nedoluha & Watson (1990) show that the position angle of the linear polarization is neither parallel nor perpendicular to the projected magnetic field in this case, over a broad range of maser intensities. For example, Figure 3 of Nedoluha & Watson shows that the polarization position angle for a J=2–1 SiO maser propagating at 15° to the magnetic field direction shifts from 20° for , to 80° for . As the maser intensity increases and exceeds , the calculations also show that the fractional polarization decreases.
4.2 The v=1 Masers
The v=1 SiO masers near IRc2 are sufficiently intense that the stimulated emission rate almost certainly is larger than the Zeeman splitting . The brighter J=1–0 maser spots in the VLBA map of Doeleman, Lonsdale, & Pelkey (1999) have flux densities of 1 Jy in an 0.2 milliarcsecond beam, corresponding to brightness temperatures of K. To estimate the stimulated emission rate for an SiO molecule near the surface of such a maser, one must guess the solid angle into which the maser radiation is beamed. Taking steradians,
| (1) |
where is the Einstein B coefficient for the transition, is the radiation energy density in ergs cm-3 Hz-1, esu-cm is the dipole moment for SiO, and is the maser’s specific intensity. For comparison, the spontaneous radiative decay rate from the v=1 to the v=0 vibrational level is 5 s-1 (Hedelund & Lambert, 1972) and the SiO–H2 collision rate in 1000 K gas with density cm-3 is 1 s-1, using the total rate coefficient cm3 s-1 ( K) given by Bieniek & Green (1983). Since , the maser is saturated.
In order to fulfill the requirement , magnetic fields 300 mG would be required. For a 300 mG field the magnetic pressure is 25 times greater than the thermal pressure , which seems unlikely. Thus, we reach the unwelcome conclusion that the polarization direction of the v=1 masers is a poor indicator of the magnetic field direction near IRc2. The model calculations of Nedoluha & Watson (1990) show that the polarization position angle is a function of , and hence of the maser flux density. Thus, one can understand both (1) the variations in polarization angle which occur across the maser line profile, and (2) the changes in polarization direction which occur on time scales of years as the maser intensities change. For the models also suggest that the most intense masers will have the lowest fractional polarization, as observed.
An observational result of note is the maser feature with 30% fractional polarization which appeared at VLSR km s-1 in 1999 June. Such high fractional polarization is difficult to achieve unless the masers are anisotropically pumped by infrared radiation from the central star (Western & Watson, 1984). Anisotropic pumping also can change the critical angle at which the polarization becomes parallel or perpendicular to the field, perhaps explaining the anomalous position angle observed for this feature. Anisotropic pumping can produce strongly polarized masers even in the absence of a magnetic field (Western & Watson, 1983); this mechanism is thought to explain the tangential polarization pattern seen the VLBA maps of SiO masers around evolved stars (Desmurs, et al., 2000).
4.3 The v=0 Masers
In contrast to the situation for the v=1 masers, the SiO masers in the ground vibrational state almost certainly do fulfill the requirement that and , hence their polarization angles should be perpendicular or parallel to the magnetic field.
The v=0 maser emission region is extended with respect to our synthesised beam, with peak brightness temperatures of about K. To compute an upper limit for the stimulated emission rate, we assume that the masers radiate isotropically, so the radiation energy density . Then s-1. The spontaneous radiative rate s-1 is relatively slow, so the decay rate from the J=2 level is set by the SiO-H2 collision rate. Modeling by Zeng, Lou, & Sun (1987) predicts that v=0 SiO masers originate in gas with density cm-3. If the gas kinetic temperature is 300 K, the rate coefficient given by Bieniek & Green (1983) implies a collision rate of s-1. For a 1 mG field the Zeeman frequency s-1. Since , the v=0 masers should be excellent tracers of the magnetic field direction. Reassuringly, the position angle of the SiO v=0 polarization appears to be stable with time. The maps in Figure 4 were made from data taken in 2000 December and 2001 February; the position angle is the same, P.A. 80°, in lower quality images from 1996, 1997, and 1999. We note that this is close to the median position angle of the v=1 masers.
One glaring discrepancy complicates the analysis: from observations made in 1994, Tsuboi et al. (1996) measured polarization position angles P.A. 150° for the J=1–0 masers in the v=0, 1, and 2 vibrational levels. As shown in Figure 5, these position angles differ by roughly 70° from the values we measure for the J=2–1 line. Given that the position angle we measured for the v=0 J=2–1 line was stable for 4 years, we doubt that this discrepancy can be attributed to time variability. It’s also unlikely that the 39″ beam used for the J=1–0 measurements picked up a halo of emission polarized almost perpendicular to the core, since we find that virtually all of the polarized J=2–1 flux originates in the central region. This leaves two possibilities: either (1) the J=2–1 and J=1–0 masers have intrinsically different polarizations; or (2) the intrinsic polarizations are identical, but the observed position angles are twisted by Faraday rotation. Possibility (1) is hard to rule out. However, in the grid of theoretical calculations done by Nedoluha & Watson (1990) there appear to be no cases where the the J=2–1 and J=1–0 polarization position angles differ by more than 20°. And, if the J=2–1 position angle we measure is parallel or perpendicular to the magnetic field, then the field is aligned neither with the bipolar outflow from IRc2 (P.A.145°, as defined by the VLBA observations of the SiO masers), nor with the axis of the v=0 disk (P.A. 50°).
4.4 Faraday rotation
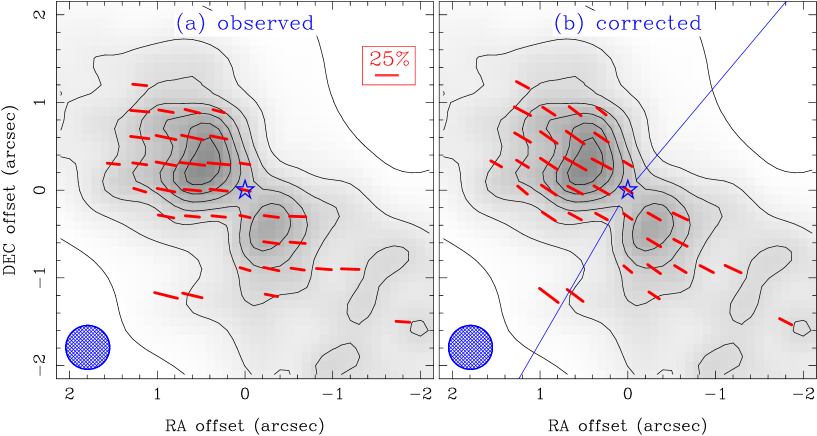
We now explore the possibility that Faraday rotation causes the discrepancy between the J=2–1 and J=1–0 polarization position angles. Faraday rotation occurs when linearly polarized emission propagates through an ionized plasma with a magnetic field component along the line of sight. The plane of polarization is rotated by , where the rotation measure is given by rad m-2. Here is the electron density in cm-3, is the component of the magnetic field along the line of sight in gauss; and is in parsecs. If the propagation vector is along the magnetic field direction, then the plane of polarization rotates in a clockwise direction, following the right hand rule. The minimum rotation measure which can bring the J=1–0 and J=2–1 position angles into agreement is rad m-2, which rotates the J=2–1 (3.5 mm) position angle by 23°, and the J=1–0 (7 mm) position angle by 92°.
Because the Faraday rotation must be reasonably uniform across the 3″ maser emission region, we presume that it occurs in the foreground Orion A H II region (M42), not in ionized gas local to IRc2 – e.g., on the surface of a circumstellar disk. What is the plausible rotation measure through Orion A? We estimate the electron column density from the work of Wilson & Jäger (1987), who modeled the H II region as a series of 9 concentric cylindrical slabs in order to fit radio continuum and recombination line data. The line of sight to IRc2 passes through slabs 3–9, for which the model column density cm-3 pc. We take the line of sight component of the magnetic field from the work of Troland, Heiles, & Goss (1989), who measured the 21 cm Zeeman effect in the sheet of neutral absorbing gas in front of Orion A. The inferred field is reasonably uniform, with no reversals of direction; the value toward IRc2 is approximately G. The negative sign indicates that the field lines point toward us. Then the rotation measure is positive, meaning that the observed position angle increases with wavelength (Heiles, 1987), which is what we are hoping to find. If the magnetic field is the same inside the H II region, then rad m-2, within 20% of the value which brings the position angles into concordance.
The estimated rotation measure is comparable with the the upper limit rad m-2 deduced by Rao, et al. (1998) from the agreement of the polarization position angles for dust emission at wavelengths of 1.3 mm and 3.5 mm. We note that the majority of these dust polarization detections were made west and north of IRc2, farther from the center of the H II region.
4.5 Magnetic Field Direction
Suppose we accept the hypothesis that Faraday rotation has twisted the J=2–1 position angle by °. As shown in Figure 6, this means that the intrinsic polarization angle is 57°, roughly parallel with the plane of the SiO “disk,” and perpendicular to the axis of the high velocity outflow from source I. The inclination angle of the disk is uncertain, but the 3:1 axial ratio of both the SiO and H2O maser distributions suggest that its axis is tilted by ° from the plane of the sky, that is, that the disk is seen nearly edge-on.
The magnetic field can be parallel or perpendicular to the SiO polarization vectors – but which is more likely? If the maser radiation travels more or less parallel to the magnetic field, then it should be polarized parallel to the projected field direction. Thus, our measurements are consistent with a magnetic field in the plane of the disk, as long as the field is oriented roughly along the line of sight. Obviously, such a field cannot be azimuthally symmetric (e.g., ring-shaped or spiral) around IRc2. If it were, the field would become perpendicular to the line of sight in the outer parts of the bowtie, and the polarization direction would flip by 90°.
Our data are more easily reconciled with a field that is everywhere perpendicular to the plane of the disk. In this case the maser radiation propagates at an angle of 70° to the field, so the polarization should be perpendicular to the field. Then the field, at P.A. 145°, is parallel to the axis of the high velocity outflow and to the large scale Orion field mapped by far infrared observations (Schleuning, 1998). The infrared measurements of Chrysostomou, et al. (1994) and Aitken et al. (1997) give a similar magnetic field direction toward source I, along the SE edge of the IRc2 infrared peak. Our data provide no convincing evidence that the field has been pinched or twisted within AU of source I. The twist seen in the infrared data occurs on slightly larger scales.
5 Conclusions
We attempted to infer the magnetic field morphology toward Orion-IRc2 from polarization measurements of the v=0 and v=1 J=2–1 SiO masers associated with this star. The polarization vectors are expected to be perpendicular or parallel to the projected magnetic field direction provided that the Zeeman splitting and , where and are the stimulated emission and decay rates from the maser’s upper rotational level.
We find that the polarization position angles of the v=1 masers vary on time scales of years. These intense masers, which originate only 40 AU from the star, probably are not suitable indicators of the magnetic field direction because the stimulated emission rate exceeds the Zeeman splitting. Typically their fractional polarization is a few percent, although in 1999 a weak feature with 30% polarization appeared.
The v=0 masers are much weaker and should be good probes of the magnetic field direction. These masers originate 100–700 AU from the star in an elongated, bowtie shaped region, possibly along the top and bottom surfaces of an underlying flared disk. Maps of the v=0 emission with 0.5″ (250 AU) angular resolution show that, contrary to our expectations: (1) the polarization vectors within 700 AU of the star are straight, with no evidence of a twist or hourglass morphology; (2) the measured polarization position angle of 80° is neither parallel nor perpendicular to the high velocity outflow from IRc2; and (3) the J=2–1 polarization position angle differs by 70° from the J=1–0 position angle previously measured by Tsuboi et al. (1996).
The discrepancy between the J=2–1 and J=1–0 position angles may be attributable to Faraday rotation by plasma in the foreground Orion A H II region. A rather high, but not implausible, rotation measure rad m-2 is required to bring the two position angles into agreement. Then the intrinsic polarization direction is parallel to the plane of the disk and perpendicular to the axis of the high velocity outflow from source I. Probably the polarization vectors are perpendicular to the field in this case, so the field threads the disk poloidally, parallel to the outflow and to the large scale magnetic field in Orion. The absence of a discernable pinch or twist in the field near IRc2 may indicate that as the molecular cloud collapsed the gas density in the pseudodisk exceeded cm-3, at which point the magnetic field decouples from the infalling gas (Nakano & Umebayashi, 1986). Alternatively, the outflow or subsequent evolution of the disk has erased all traces of the pinched field.
The high fractional polarizations observed for the v=0 masers – up to 50% in our J=2–1 data and up to 80% in the J=1–0 observations of Tsuboi et al. (1996) – suggest that anisotropic excitation by infrared photons play an essential role in pumping these masers.
References
- Aitken et al. (1997) Aitken, D. K., Smith, C. H., Moore, T. J. T., Roche, P. F., Fujiyoshi, T., & Wright, C. M. 1997, MNRAS, 286, 85
- Barvainis (1984) Barvainis, R. 1984, ApJ, 279, 358
- Barvainis & Predmore (1985) Barvainis, R., & Predmore, C. R. 1985, ApJ, 288, 694
- Baudry, Herpin, & Lucas (1998) Baudry, A., Herpin, F., & Lucas, R. 1998, A&A, 335, 654
- Bieniek & Green (1983) Bieniek, R. J. & Green, S. 1983, ApJ, 265, L29
- Chandler & de Pree (1995) Chandler, C. J. & de Pree, C. G. 1995, ApJ, 455, L67
- Chrysostomou, et al. (1994) Chrysostomou, A., Hough, J. H., Burton, M. G., & Tamura, M. 1994, MNRAS, 268, 325
- Desmurs, et al. (2000) Desmurs, J. F., Bujarrabal, V., Colomer, F., & Alcolea, J. 2000, A&A, 360, 189
- Doeleman, Lonsdale, & Pelkey (1999) Doeleman, S. S., Lonsdale, C. J., & Pelkey, S. 1999, ApJ, 510, L55
- Galli & Shu (1993) Galli, D. & Shu, F. H. 1993, ApJ, 417, 243
- Goldreich, Keeley, & Kwan (1973) Goldreich, P., Keeley, D. A., & Kwan, J. Y. 1973, ApJ, 179, 111
- Greaves & Holland (1998) Greaves, J. S. & Holland, W. S. 1998, A&A, 333, L23
- Greaves, Holland, & Murray (1995) Greaves, J. S., Holland, W. S., & Murray, A. G. 1995, A&A, 297, L49
- Greaves, Murray, & Holland (1994) Greaves, J. S., Murray, A. G., & Holland, W. S. 1994, A&A, 284, L19
- Greenhill et al. (1998) Greenhill, L. J., Gwinn, C. R., Schwartz, C., Moran, J. M., & Diamond, P. J. 1998, Nature, 396, 650
- Hedelund & Lambert (1972) Hedelund, J. & Lambert, D. L. 1972, Astrophys. Lett., 11, 71
- Heiles (1987) Heiles, C. 1987, ASSL Vol. 134: Interstellar Processes, 171
- Menten & Reid (1995) Menten, K. M. & Reid, M. J. 1995, ApJ, 445, L157
- Nakano & Umebayashi (1986) Nakano, T. & Umebayashi, T. 1986, MNRAS, 221, 319
- Nedoluha & Watson (1990) Nedoluha, G. E. & Watson, W. D. 1990, ApJ, 354, 660
- Newman, Newman, & Lovelace (1992) Newman, W. I., Newman, A. L., & Lovelace, R. V. E. 1992, ApJ, 392, 622
- Plambeck et al. (1995) Plambeck, R. L., Wright, M. C. H., Mundy, L. G. & Looney, L. W. 1995, ApJ, 455, 189
- Plambeck, Wright, & Carlstrom (1990) Plambeck, R. L. Wright, M. C. H. & Carlstrom, J. E. 1990, ApJ, 348, L65
- Pudritz & Norman (1986) Pudritz, R. E. & Norman, C. A. 1986, ApJ, 301, 571
- Rao, et al. (1998) Rao, R., Crutcher, R. M., Plambeck, R. L., & Wright, M. C. H. 1998, ApJ, 502, L75
- Sault, Teuben, & Wright (1995) Sault, R. J., Teuben, P. J., & Wright, M. C. H. 1995, ASP Conf. Ser. 77: Astronomical Data Analysis Software and Systems IV, 4, 433
- Schleuning (1998) Schleuning, D. A. 1998, ApJ, 493, 811
- Townes & Schawlow (1975) Townes, C.H., & Schawlow, A.L. 1975, Microwave Spectroscopy (New York: Dover), p. 287
- Troland, Heiles, & Goss (1989) Troland, T. H., Heiles, C., & Goss, W. M. 1989, ApJ, 337, 342
- Tsuboi et al. (1996) Tsuboi, M., Ohta, E., Kasuga, T., Murata, Y., & Handa, T. 1996, ApJ, 461, L107
- Uchida & Shibata (1985) Uchida, Y. & Shibata, K. 1985, PASJ, 37, 515
- Western & Watson (1983) Western, L. R. & Watson, W. D. 1983, ApJ, 275, 195
- Western & Watson (1984) Western, L. R. & Watson, W. D. 1984, ApJ, 285, 158
- Wilson & Jäger (1987) Wilson, T. L. & Jäger, B. 1987, A&A, 184, 291
- Wright et al. (1983) Wright, M. C. H., Plambeck, R. L., Vogel, S. N., Ho, P. T. P., & Welch, W. J. 1983, ApJ, 267, L41
- Wright et al. (1995) Wright, M. C. H., Plambeck, R. L., Mundy, L. G. & Looney, L. W., 1995, ApJ, 455, 185
- Zeng, Lou, & Sun (1987) Zeng, Q., Lou, G. F., & Sun, J. 1987, A&A, 172, 299