A Homogeneous Sample of Sub-DLAs II: Statistical, Kinematic and Chemical Properties
Abstract
Damped Ly Systems (DLAs), with N(HI) cm-2, observed in the spectra of quasars have allowed us to quantify the chemical content of the Universe over cosmological scales. Such studies can be extended to lower column densities, in the sub-DLA range ( N(HI) 2 cm-2), which are systems believed to contain a large fraction of the neutral hydrogen at . In this paper, we use a homogeneous sample of sub-DLAs from the ESO UVES archives presented in Paper I (Dessauges-Zavadsky et al. 2003), to observationally determine for the first time the shape of the column density distribution, , down to N(HI) cm-2. The results are in good agreement with the predictions from Péroux et al. (2003). We also present the kinematic and clustering properties of this survey of sub-DLAs which appear to be marginally different from the DLAs. We compare low- and high-ionization transition widths and find that the sub-DLAs properties roughly span the parameter space of DLAs. We also find hints of an increase of metallicity in systems with larger velocity widths in the metal lines, although the statistical significance of this result is low.
We then analyse the chemical content of this sample in conjunction with a compilation of abundances from 72 DLAs taken from the literature. As previously reported, the individual metallicities traced by [Fe/H] of these systems evolve mildly with redshift. Moreover, we analyse the HI column density-weighted mean abundance which is believed to be an indicator of the Universe’s metallicity. Although the number statistics is limited in the current sample, the results suggest a slightly stronger evolution of this quantity in the sub-DLA range. The effect is predominant at and most of the evolution observed lies in this redshift range. Observational arguments support the hypothesis that the evolution we probe in the sub-DLA range is not due to their lower dust content. Therefore these systems might be associated with a different class of objects which better trace the overall chemical evolution of the Universe. Finally, we present abundance ratios of [Si/Fe], [O/Fe], [C/Fe] and [Al/Fe] for sub-DLAs in conjunction with DLA measurements from the literature. The elemental ratios in sub-DLAs are comparable with those from DLAs. It is difficult to decipher whether the observed values are the effect of nucleosynthesis or are due to differential dust depletion. The metallicities are compared with two different sets of models of galaxy evolution in order to provide constraints on the morphology of quasar absorbers.
keywords:
galaxies: abundance – galaxies: high-redshift – quasars: absorption lines – quasars:1 Introduction
In addition to traditional emission studies, absorption systems along the line-of-sight to distant quasars provide a completely independent probe of galaxy evolution. The highest column density Damped Ly systems (hereafter DLAs) have N(HI) atoms cm-2. The reason why damped systems are a cosmologically important population is that they contain most of the neutral gas in the Universe at (Lanzetta et al. 1991; Wolfe et al. 1995; Storrie-Lombardi et al. 1996b). Since the metal content of these systems can be determined with rather high precision up to high redshift, they are a powerful tool to study the chemical evolution of galaxies. In particular, a way to trace the metallicity of the Universe is provided by estimating the ratio of the total metal content to the total gas content measured in these systems (Pettini et al. 1997; Pei, Fall & Hauser 1999). Using such techniques, Prochaska & Wolfe (2002), in agreement with previous work, find that the hydrogen column density-weighted [Fe/H] metallicities have similar values from . The results are in disagreement with expectations since models of cosmic chemical evolution (e.g. Pei & Fall 1995) predict evolution of global metallicity with cosmic time. Savaglio (2000), however, has used 50 DLAs and lower column density systems and finds clear evidence for redshift evolution, although this sample suffers high inhomogeneity.
In a recent study, Péroux et al. (2001) have shown that sub-DLAs, defined as systems with N(HI) atoms cm-2, play a major role, especially at higher redshifts. The authors postulate that at , 45% of the neutral gas mass is in sub-DLAs. These predictions are based on a constrained extrapolation of the quasar absorber column density distribution, , to lower column densities assuming the distribution can be fitted by a gamma function. This suggests that the metallicities of sub-DLAs require detailed study in order to obtain a complete picture of the redshift evolution of the metallicity of the Universe. For this purpose, we have constructed a homogeneous sample of sub-DLAs based on high-resolution quasar spectra from the ESO UVES/VLT archives (Dessauges-Zavadsky et al. 2003, hereafter Paper I). Sub-DLAs can be easily picked up since at these column densities damping wings are already formed and the rest equivalent width is Å.
In this paper, we analyse the sample of sub-DLAs presented in Paper I. We first use these data to establish the column density distribution in a range unprobed before. These results have direct implications for the determination of the neutral gas content of quasar absorbers and its evolution with redshift. We also emphasize the limitations of the present sample in terms of redshift path surveyed. The clustering properties of our sample of sub-DLAs are described in section 3. In section 4, we discuss the kinematic properties of the low- and high-ionization transitions associated with the sub-DLAs presented in Paper I. These results can be used to directly constrain some of the semi-analytic models recently presented in the literature. In section 5, we present the results of chemical abundance determinations in sub-DLAs in conjunction with the abundances in DLAs taken from the literature and provide information on the global metallicity evolution of both individual quasar absorbers and the Universe. We also cross-correlate these properties with the kinematic information we present in previous sections. Relative abundances are then analysed and compared with recent models of galaxy formation and evolution, putting further constraints on the morphology of quasar absorbers.
| Quasar | Ly- forest coverage | sub-DLA | |||
|---|---|---|---|---|---|
| Name | ( - )a | ||||
| Q00002620 | 4.11 | 2.533–3.365 3.423–4.105 | 3.390 | … | … |
| BR J03074945 | 4.75 | 3.119–3.903 4.034–4.455 | 4.466 | … | … |
| … | … | 4.482–4.774 | … | … | … |
| Q03473819 | 3.23 | 2.017–3.014 | 3.025 | … | … |
| Q0841129 | 2.50 | 1.903–2.362 2.387–2.466 | 2.375 | … | … |
| … | … | 2.484–2.497 | 2.476 | … | … |
| HE 09401050 | 3.05 | 1.719–2.183 2.933–3.046 | … | … | … |
| Q1038272 | 2.32 | 2.107–2.357 | … | … | … |
| Q1101264b | 2.14 | 1.519–2.117 | … | 1.838b | 19.500.05 |
| HE 11041805c | 2.31 | 1.609–1.654 1.670–2.307 | 1.662 | … | … |
| Q1151068 | 2.76 | 1.797–2.756 | 1.774d | … | … |
| PKS 1157014 | 1.99 | 1.559–1.918 1.982–1.987 | 1.44 | … | … |
| Q12231753 | 2.94 | 2.044–2.446 2.484–2.936 | 2.466 | 2.557 | 19.320.15 |
| … | … | … | … | … | … |
| PKS 12320815 | 2.57 | 1.704–2.327 2.350–2.566 | 2.338 | … | … |
| Q1409095 | 2.86 | 2.126–2.448 2.463–2.856 | 2.456 | 2.668 | 19.750.10 |
| Q1444014 | 2.21 | 1.710–2.082 2.091–2.207 | … | 2.087 | 20.180.10 |
| Q1451123 | 3.25 | 2.168–2.462 2.475–2.995 | 2.469 | 3.171e | 19.700.15 |
| … | … | … | 2.255 | … | … |
| Q1511090 | 2.88 | 1.720–2.876 | … | 2.088 | 19.470.10 |
| Q2059360 | 3.09 | 2.461–3.068 | 3.083 | 2.507 | 20.210.10 |
| Q2116358 | 2.34 | 1.710–1.992 2.000–2.337 | … | 1.996 | 20.060.10 |
| Q2132433 | 2.42 | 1.710–1.907 1.923–2.417 | 1.914 | … | … |
| PSS J21551358 | 4.26 | 2.913–3.300 3.337–3.606 | 3.316 | 3.142 | 19.940.10 |
| … | … | 3.689–4.255 | … | 3.565 | 19.370.15 |
| … | … | … | … | 4.212 | 19.610.15 |
| Q2206199 | 2.56 | 1.720–1.914 1.917–2.071 | 1.920 | … | … |
| … | … | 2.083–2.556 | 2.076 | … | … |
| PSS J23440342 | 4.24 | 2.889–3.201 3.241–3.606 | 3.220 | 3.882 | 19.500.10 |
| … | … | 3.689–4.295 | … | … | … |
a corresponds to the point where the signal-to-noise ratio was too poor to find absorption features and is 3000 km s-1 bluewards of the Ly- emission of the quasar. The holes in the redshift intervals correspond to either a DLA or a gap in the spectrum due to non-overlapping settings.
b This quasar has been observed as part as the Science Verification of UVES for the study of the Ly forest. As such, it does not fulfill our criteria for its redshift path to be included in our “statistical sample”. Nevertheless, an analysis of the spectrum reveals the presence of a sub-DLA system at and we undertook the determination of the abundance of this absorber.
c This quasar is gravitationally lensed. Only the brightest line of sight was included in our study.
d This system is situated outside our spectral coverage.
e Our spectrum does not cover the Ly line of this sub-DLA (, Å). It has been identified thanks to the HI column density measurement reported by Bechtold (1994) and Petitjean, Srianand & Ledoux (2000). Several lines from the Lyman series and metals are available, hence, we undertook the determination of the metal content of this system but did not include it in our “statistical sample”.
2 Statistical Properties of sub-DLAs
2.1 Sample Definition
The sample of quasars used for this study is presented in Paper I and their characteristics are summarised in Table 1. This lead to a set of 22 quasars studied in various observational programmes. In order to build the “statistical sample”, we have ignored the quasars which have been targeted for the study of the Ly forest (for the analysis of voids, low column density column density distribution, etc). Indeed these have been pre-selected for not having a LLS in their spectrum, precisely the type of feature we are looking for in the present study. As reported in Paper I, a sub-DLA at was found in Q1101264, a quasar observed during UVES Science Verification. This absorber is included in the abundance analysis, although for consistency, neither the redshift path of the quasar nor the sub-DLA are used in the “statistical sample”. This selection process resulted in a sample of 21 quasars suitable for studying the statistical properties of sub-DLAs.
Similarly, sub-DLAs which do not have their Ly feature within the spectral coverage are automatically excluded, although the determination of HI column density might be possible from other lines of the Lyman series. This is the case of the sub-DLA at towards Q1451123, for which we undertook a detailed abundance study similar to the other systems, but which is not included in our “statistical sample”. The resulting sample of sub-DLAs is thus composed of 10 systems. Although we looked for any system with N(HI) atoms cm-2, the smallest column density sub-DLA detected in this sample is N(HI) atoms cm-2.
The large majority of the quasars in the sample were observed with UVES because there was a DLA along their line-of-sight, as can be attested from Table 1. There is no a priori reason that this creates a bias for our statistical analysis.
Table 1 lists the minimum () and maximum () redshifts along which a sub-DLA could be detected along each quasar line-of-sight. corresponds to the point where the signal-to-noise ratio was too low to find absorption features at the sub-DLA threshold of Å, and is 3000 km s-1 blueward of the Ly emission of the quasar. We took care to exclude the DLA regions and the gaps in the spectrum due to non-overlapping settings when computing the redshift path surveyed.
2.2 Number Density
The number density of quasar absorbers is the number of absorbers, , per unit redshift , i.e., . is computed by summing up the redshift paths surveyed along the line-of-sight of each of the quasar studied as given in Table 1. is a directly observable quantity, although, its interpretation is dependent on the geometry of the Universe. Indeed, the evolution of the number density of absorbers with redshift is the intrinsic evolution of the true number of absorbers combined with effects due to the expansion of the Universe.
Measuring the incidence of sub-DLAs down to N(HI) atoms cm-2 in a given sample of quasars requires a number of high resolution spectra in order to unambiguously select all the absorption systems. Nevertheless, indirect information is also provided by the number of LLS in a given quasar sample. Péroux et al. (2003) fitted the observed cumulative number of absorbers of both DLAs and LLSs with a -distribution as suggested by Pei & Fall (1995) and first implemented by Storrie-Lombardi, Irwin & McMahon (1996a). This puts constraints on the number of systems in the N(HI) atoms cm-2 column density range. They then used these predictions to compute the expected number density of sub-DLAs. The results from this work are tabulated in the last column of Table 2 for comparison with the observations presented here.
Excluding Q1101264, we have sampled a total redshift path and find a total of 10 sub-DLAs. The comparison with the predictions of Péroux et al. (2003) show a good agreement in the intermediate redshift range. At , the low number statistics makes the results more uncertain. Nevertheless, it is important to note that in the quasar sample studied here all but 4 of the objects have . The sub-DLAs are thus predominantly located in the intermediate redshift range . Indeed, we find 7 sub-DLAs at , where we have surveyed , while we find 3 sub-DLAs at , where we have only surveyed . Consequently, the determination of at is not possible with the current set of data. The number of sub-DLAs and associated redshift paths are summarised in Table 2 for various redshift ranges.
| z range | number | ||||
| obs | obs | of sub-DLAs | obs | predicted | |
| 3.5 | 14.4 | 47.0 | 7 | 0.49 | 0.46 |
| 3.5 | 3.1 | 12.5 | 3 | 0.97 | 1.66 |
| 1.5-2.5 | 8.7 | 27.0 | 3 | 0.34 | 0.39 |
| 2.5-3.0 | 3.8 | 13.0 | 3 | 0.79 | 0.46 |
| 3.0-3.5 | 1.9 | 7.0 | 1 | 0.53 | 0.67 |
| 3.5-4.0 | 1.7 | 6.8 | 2 | 1.18 | 1.52 |
| 4.0-5.0 | 1.4 | 5.7 | 1 | 0.71 | 2.00 |
| total | 17.5 | 59.5 | 10 | 0.57 | 0.58 |
2.3 Column Density Distribution
2.3.1 Observationally Constraining down to log
Our sample of sub-DLAs from the UVES archive quasar spectra can be further used to determine the column density distribution of absorbers in the column density range N(HI) atoms cm-2. The column density distribution describes the evolution of quasar absorbers as a function of column density. It is defined as:
| (1) |
where is the number of quasar absorbers observed in a column density bin obtained from the observation of quasar spectra with total absorption distance coverage . The distance interval, , is used to correct to co-moving coordinates and thus depends on the geometry of the Universe. For a non-zero -Universe:
| (2) |
The values of used in our study are given in Table 2 for an , cosmology. We have sampled a total redshift path . This corresponds to a distance interval in , cosmological model.
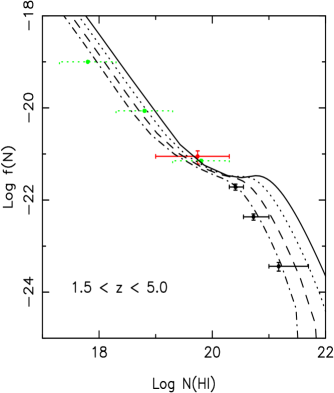
We have used the sample of sub-DLAs from the UVES archive quasar spectra to determine the column density distribution down to N(HI) atoms cm-2 for the first time. The results are shown in Figure 1 together with the predictions of Péroux et al. (2002) computed from the expected number of sub-DLAs and a compilation of DLAs at all redshifts. The observational results presented here are consistent with the predicted change of slope of the column density distribution at N(HI) atoms cm-2, as suggested by previous work (Petitjean et al. 1993; Storrie-Lombardi & Wolfe 2000; Péroux et al. 2003). This feature is probably the signature of the onset of self-shielding in these systems.
2.3.2 Comparison with Models
Although simulating high column density systems such as DLAs is still extremely challenging because of resolution limitations, Gardner et al. (1997) have tried to overcome the problem by imposing the density profile of resolved halos onto unresolved ones. They derive the evolution with redshift of the column density distribution and, interestingly, they find a flattening of the distribution somewhere in the region log N (HI) atoms cm-2. Nevertheless, the theory predicts little change in the form of the column density distribution function over the redshift range . This seems counter to current observations since a strong evolution of the number density of quasar absorbers with redshift has been derived (Péroux et al. 2002), implying a factor of 3 or more difference in the number of LLS between and .
More importantly, the new set of observations can be directly compared with models of the column density distribution (Corbelli, Salpeter & Bandiera, 2001 and Zheng & Miralda-Escudé, 2002). Zheng & Miralda-Escudé (2002), in particular, modeled DLAs as spherical isothermal gaseous halos ionized by external cosmic background to predict the column density distribution. Their models for different halo masses: , , , (from top to bottom) are overplotted in Figure 1. The normalisation of the curves is arbitrary since it depends, among other things, on the size distribution of clouds, which is not known, but the shape can be directly compared with the data. In addition, Zheng & Miralda-Escudé show that the column density at which the flattening takes place depends only on the neutral fraction in the absorber at the radius where self-shielding occurs. The present data exclude the models with high mass halos.
In addition, according to Péroux et al. (2002), the change of slope of the column density distribution should evolve with redshift, moving out in redshift from to . Unfortunately, the current sub-DLA sample is not sufficient to study the evolution with redshift of the distribution down to N(HI) atoms cm-2. More data are required at high redshift in order to be able to probe the evolution with time of the properties of the sub-DLAs.

3 Clustering of Sub-DLAs
As already noted all the quasars studied here were extracted from the ESO UVES archive and so the large majority were observed because there was a DLA along their line-of-sight. Although the DLAs themselves were excluded from the redshift path surveyed in the quasar, it is of interest to note that on at least one occasion, the sub-DLA discovered is situated in the wing of a known DLA: and towards Q12231753, giving , corresponding to 8000 km s-1 (see Paper I). In addition, we note that out of the 12 sub-DLAs which make up our sample, at least 3 systems ( towards Q2116358, towards PSS J21551358 and towards PSS J23440342) cannot be fitted with only one absorption system, suggesting the presence of smaller column density absorbers in their close vicinity (see Paper I for more details on these systems). Obviously, these features illustrate the difficulty in determining the HI column density of sub-DLA systems and differentiating these objects from a conglomerate of smaller column density objects. In the particular cases of and towards BR J03074945, we cannot estimate the size and number of absorbers involved. We refer the reader to section 3.1 of Paper I for discussion of these specific cases.
To summarise, our sample of 12 sub-DLAs contain 4 systems associated with other absorbers, one of which is a DLA, the remaining being smaller column density systems. From Péroux et al. (2002), the expected probability of absorbers with N(H) atoms cm-2 is at , if the absorbers where randomly distributed. Thus there is only a 1 in 50 chance of finding quasar absorbers separated by ( 8000 km s-1). The observed incidence of clustered absorbers (1 out of 12) is therefore higher than expected. For comparison, out of the hundreds of DLAs known today, only 3 cases of such clustering along a given line-of-sight have been reported in the literature. Prochaska & Wolfe (1999) report a pair of DLAs towards Q235902 at and separated by km s-1. Ellison & Lopez (2001) have presented a pair of (strictly speaking) DLA/sub-DLA at separated by km s-1 which are characterised by a low elemental ratio. Lopez et al. (2001) have found 3 DLAs at in CTQ 247 separated by km s-1 which show similar abundance patterns (Lopez & Ellison 2003).
The quantitative interpretation of this phenomenon is not straightforward. Lyman Break selected galaxies (e.g. Steidel et al. 1998) and Ly- emitting galaxies (Ellison et al. 2001) have been shown to be clustered at high redshifts. Similarly, studies of transverse clustering from quasars pairs or groups show a highly significant overdensity of strong absorption systems over separation lengths from to 8 h-1 Mpc (D’Odorico, Petitjean & Cristiani 2002). Our findings are therefore not surprising in that respect. In all cases, pairs of sub-DLAs/DLAs are potentially of great interest since, in such cases, one could reasonably assume that the incident radiation field is similar for both absorbers, thus providing further information on the otherwise poorly constrained photoionization spectrum. Such studies would nevertheless require a good estimate of HI column density of each system (often requiring other lines down the Lyman series) and that the metals associated with each absorber are well characterised.
4 Kinematics of Sub-DLAs
The kinematic properties of quasar absorbers can be used to provide further information on their nature. Using various line diagnostics to parameterise the symmetry, velocity width and the edge-leading profiles of the metal lines of 17 DLA systems, Prochaska & Wolfe (1998) suggest that the absorbers are fully formed, large, rapidly rotating galactic discs with 200 . More recently, Wolfe & Prochaska (2000b) have used a sample of 35 DLAs (Wolfe & Prochaska 2000a) and compared them with semi-analytical models of galaxy formation. They note that none of the models reproduce the overlap between low- and high-ionization metal profiles observed in the data. In addition, this scenario is in stark contrast with the currently favoured hierarchical structure formation models, where present-day galaxies are assembled from virialised sub-units over a large redshift range (). Other hydrodynamic N-body simulations and semi-analytical models (Haehnelt, Steinmetz & Rauch 1998; Maller et al. 2001; Maller et al. 2002) have shown that the low ion absorption profiles can equally well be interpreted as a signature from merging proto-galactic clumps in collapsing dark matter halos with small virial velocities ( 100 ). In addition, Ledoux et al. (1998) have used a sample of 26 DLAs and find a correlation between the asymmetry and for . They suggest that this correlation is evidence that rotation velocities may dominate the narrower metal lines.
4.1 Sub-DLAs Characteristics
First we examine the number of components necessary to fit the low-ionization transitions of the sub-DLAs, noting that out of 12 systems, 5 require more than 10 components. We also note that most of the remaining systems (another 5 absorbers) are well fitted with only 3 or less components.
We chose to describe the properties of the lines of the low- and high-ionization transitions in our sample of sub-DLAs with the help of four simple quantities, namely:
-
1.
: the width of the low-ionization transitions as measured from the most saturated Fe ii or Si ii lines.
-
2.
: the width of the high-ionization transitions as measured from the most saturated C iv or Si iv lines.
-
3.
: the offset between the mean velocity of the high- and low-ionization transitions.
-
4.
: the ratio of the velocity widths of the high- and low-ionization transitions.
All these parameters are used to quantify the differences between various states of the gas observed in absorption. The shift between the low- and high-ionization transitions for our sample of sub-DLAs is shown in Figure 2 for the 8 systems where high-ionization transitions are detected. In most cases, although the two sets of absorption overlap, the profiles are widely different. In one particular object ( in Q1451123), the Si ii is not superimposed at all on the C iv doublet in velocity space, the two being separated by km s-1. It might be that the C iv doublet is actually not associated with the sub-DLA itself (see Paper I for more details). As in DLAs, the high-ionization transitions spread over larger velocity intervals than their low-ionization counterparts, but their correspondence suggests that the systems are within the same potential well (Wolfe & Prochaska 2000b). However, in two cases ( in Q2344034 & in Q1444014), the low-ionization transitions traced by Si ii spread over a larger velocity interval than the high-ionization transitions.
4.2 Comparison with DLAs
In order to compare the kinematic properties of sub-DLAs with DLAs, we have determined the parameters described in the previous section for 72 DLAs taken from the literature. The systems quoted are from a mixture of UVES/HIRES and lower resolution spectrographs for high-redshift targets, and from HST at lower redshifts. Thirteen additional sub-DLAs are found in the literature. We made the relevant measurements from the quasar spectra whenever we had them, otherwise we directly used the original publications to quantify the width of the ion lines. We preferentially used the Fe ii and C iv lines whenever possible. In addition, if the data came from the UCSD HIRES/KeckI survey (Prochaska & Wolfe 1998, 2000 and 2002; Prochaska, Gawiser & Wolfe 2001; Prochaska et al. 2002), we took the velocities used for the Optical Depth Method given on the survey’s web page 111http://kingpin.ucsd.edu/hiresdla/ kindly provided to the general community and maintained by Jason X. Prochaska.
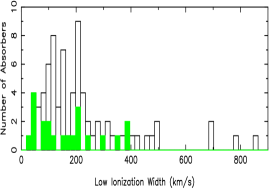
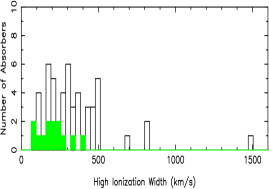
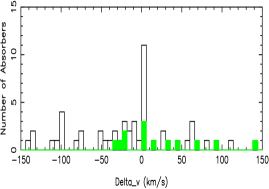
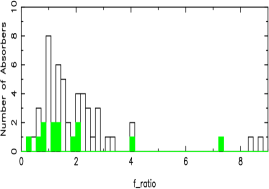
The resulting distributions for , , and are illustrated in Figure 3. Although the number of sub-DLAs is still small, it appears that their velocity spreads in both low- and high-ionization transitions are statistically equivalent to the DLAs (top left and top right panel of Figure 3). In most cases, the shift between the low- and high-ionization transitions is small in DLAs (less than 20 km s-1) (bottom left panel of Figure 3). Finally, the values of DLAs and sub-DLAs are comparable (bottom right panel of Figure 3). These measurements are important to constrain semi-analytical models. Indeed, Maller et al. (2002) find that a large fraction of absorbers with log N(HI) cm-2 might be composed of multiple component discs. In contrast, they predict that the smaller systems (in particular those with N(HI) cm-2) will mostly be single discs. Therefore, is expected to be smaller in these systems than in classical DLAs. Although our data set is still small, the observations presented here do not support this interpretation, thus challenging multiple component models. A possible explanation is that some of the low ionization gas in sub-DLAs is in hot gas. Indeed, the data show a hint of decreasing with lower column densities, therefore suggesting that the high and low ions are in the same gas at lower N(HI).

5 Chemical Abundances of Sub-DLAs
5.1 Ionization Fraction
In Paper I, we have presented the hydrogen and ionic column densities of all of the sub-DLAs included in Table 1, using standard Voigt profile fitting. Since their relatively low column density implies that some of the gas might be ionized, the ionization state of the sub-DLAs has been investigated in detail in Paper I using the photoionization models of the CLOUDY software package. The determination of the ionization parameter for a given absorber system crucially depends on the detection of intermediate-ionization transitions. In addition, the photoionization model relies on several input parameters related to the nature of the absorber and the characteristics of the radiation field. In this context we chose to extract from our analysis a global ionization correction rather than individual corrections limited by partial information. We found the correction to be dex for most elements down to N(HI) cm-2. We also note that the correction to apply is quite different from species to another. In the case of O i or C ii, for example, the ionization fraction is small, while it becomes important for such elements as Al ii or Zn ii. One needs to keep these facts in mind while interpreting the various figures presented in the following sections.
5.2 Metallicity Evolution
In this section, we present the results of the metallicity study of the sample of sub-DLAs and compare them with the characteristics of the well studied DLAs. The references for absorbers from the literature are the same as in Section 4.2. The chemical abundances in DLAs have been used to trace the metallicity evolution of galaxies over a large look-back time (e.g. Pettini et al. 1999; Prochaska & Wolfe 2000) and contrary to virtually all chemical models, the observations in DLAs indicate mild evolution with redshift. By extending the abundance determination to systems of lower column densities, such as the sub-DLAs, we can gain insight in the evolution of the galactic chemical evolution of galaxies, since they are more likely to represent the basic building blocks of hierarchical growth of structure.
5.2.1 Metallicity of Individual Systems
| data set | nber of | c.l. | Slope | |
|---|---|---|---|---|
| definition | abs | |||
| log N(HI) 20.3 | 72 | –0.29 | 99.53% | |
| log N(HI) 20.3 | 17 | –0.50 | 84.27% | |
| log N(HI) 21.0 | 75 | –0.40 | 99.99% | |
| All Absorbers | 89 | –0.35 | 99.53% |
[Fe/H]: Given that the ionization correction on the Fe ii column density is within the observational errors, the abundance measurements of the sub-DLAs can be directly compared with those of the DLAs gathered from various sources in the literature. We use the abundance ratios with respect to solar values defined in the usual manner 222, assuming that and . and presented in Paper I. For the sake of homogeneity we recompute these ratios for all data from the literature assuming [Fe/H] (Grevesse & Sauval 1998). The top panel of Figure 4 presents the evolution with redshift of the [Fe/H] absolute abundances in individual systems. The symbol sizes in this figure are proportional to the HI column density of the systems. The classical DLAs are represented with square symbols while the sub-DLAs are circles (open for data from the literature, filled for the data from the sample presented in this paper). We applied the order ranking Kendall test to several subsets of the sample as shown in Table 3, ignoring all upper and lower limits. As previously reported (e.g. Prochaska & Wolfe 2002; Dessauges-Zavadsky et al. 2001), there is evidence for a mild evolution of the individual [Fe/H] in DLAs (correlation coefficient of –0.29 at 99.53% confidence level). The analysis suggests a stronger correlation of the [Fe/H] in sub-DLAs although the significance of the test is weakened by low number statistics (correlation coefficient of –0.50 at 84.27% confidence level for a total of 17 sub-DLAs). The effect is predominant at and most of the evolution observed lies in this redshift range. We fitted the two populations of absorbers assuming a linear correlation and found a slope of for DLAs and for sub-DLAs (dashed and solid line of the top panel of Figure 4 respectively). The evolution with redshift of the [Fe/H] ratio might be more pronounced for sub-DLAs than for DLAs. This difference, if confirmed by a larger sample of data, suggests that the detection of DLAs is more biased by dust at low redshift, or that the sub-DLAs are associated with a class of galaxies which better trace the overall chemical evolution of the Universe.
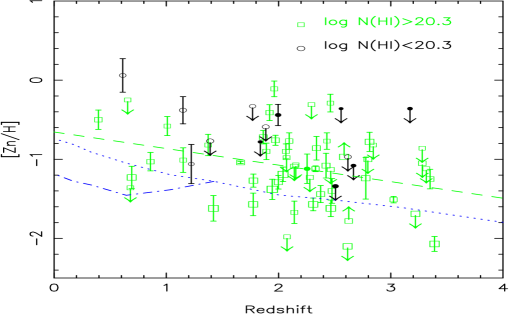
[Zn/H]: The well-known drawback of using Fe ii for abundance determination is the fact that this element is sensitive to depletion onto dust grains (Pettini et al. 1997). An alternative to overcome the dust depletion issue is provided by Zn, an element known to be only mildly depleted. The lower panel of Figure 4 present the evolution of the [Zn/H] with redshift. Again for the sake of homogeneity we recompute these ratios for all data from the literature assuming [Zn/H] (Grevesse & Sauval 1998). In our sample of sub-DLAs, most of the Zn ii lines are weak or undetected and thus we can only provide upper limits. In addition, the ionization correction in sub-DLAs is important for Zn ii and thus the interpretation of the abundances is more complicated. We again used the order ranking Kendall test for the subsets of the Zn ii sample. When considering both DLAs and sub-DLAs (and excluding all limits), we determine a slope , i.e. slightly shallower than the one derived by Vladilo et al. (2000) and Dessauges-Zavadsky et al. (2001) () since the latter works loosely include sub-DLAs in their samples. Nevertheless, the significance of this result is low (correlation coefficient of –0.25 at 84.27% confidence level for a total of 40 abundances). Analysing DLAs only, leads to a slope for 36 systems. There are not enough Zn ii measurements in the sub-DLAs range to allow such analysis. An important point, however, is the fact that the slope in the Zn ii DLA sub-set (), a tracer of true metallicity evolution, is not as steep as in the Fe ii sub-DLA sub-set (). This suggests that the evolution we probe in these latter absorbers is not due to the hidden effect of dust.
Comparison with Models: These observational results can be compared with models of galaxy evolution and the corresponding evolution of metal abundances to further test the nature of quasar absorbers. Complications arise from the fact that the observed systems might have different formation epochs, a parameter which cannot be directly constrained by the data. Prantzos & Boissier (2000) use models of the chemical evolution of disc galaxies, calibrated on the Milky Way (Boissier & Prantzos 1999, 2000), which they then compare with the Zn abundances of DLAs. This comparison is extended to other elements in Hou, Boissier and Prantzos (2001). They find that the results are compatible with available observations, provided that several biases are taken into account, one of these biases being reproduced by applying a “dust filter” to the models. This filter was proposed by Boissé et al. (1998) who suggest that high column density and high-metallicity systems are not detected because the light of background quasars is severely extinguished. This claim arises from the observed trend in [X/H] versus log N(HI) in quasar absorbers (see section 5.2.3 for more on this issue). The results of the models are further constrained by the HI column density detection limits in current surveys. In Hou, Boissier & Prantzos (2001), this limit corresponds to the formal definition of DLAs, . The mean [Fe/H] value of the model is presented in Figure 4 as a dotted curve. The scatter in the observations is genuine (since it is higher than the error bars on individual metallicity measurements) and is well reproduced by the model (see Figure 2 of Hou, Boissier & Prantzos 2001).
Adjusting the threshold to the sub-DLA definition results in the dashed-dotted curve presented in Figure 4. The models do not indicate a change in evolution with redshift between DLA and sub-DLA systems (see dotted and dashed-dotted curves in the bottom panel of Figure 4). Rather they suggest that the metallicity in sub-DLAs is lower than in DLAs. This is a natural consequence of the abundance gradients observed in nearby galaxies and in the Milky Way, well reproduced by the models (Prantzos & Boissier 2000). On the contrary, the observations indicate that the sub-DLAs seem more metal-rich than the DLAs, at least at low redshift. Therefore although the disc models are in quite good accordance with the DLAs observations, the mismatch between these models and the sub-DLA observations suggests that sub-DLAs do not arise in disc galaxies.
The [Zn/H] observed redshift evolution can also be compared with models of galaxy evolution proposed by Hou, Boissier & Prantzos (2001). It should be emphasized that in the models, the Zn ii abundance is set to follow the Fe abundance. The difference between the two arises only from different “biases”; the current Zn detection can be accounted for by applying to the models the filter: log N(HI)+[Zn/H]18.8, an estimate of the Zn limit detection (e.g. Prantzos & Boissier 2000). Again, setting the column density cut-off in the models to the DLA definition reproduces the trend well (dotted curve in the bottom panel of Figure 4) and the scatter between measurements (see also Prantzos & Boissier 2000). Once the cut-off is chosen to match the sub-DLA definition (dashed-dotted curve in bottom panel of Figure 4), the models suggest that the Zn ii abundances in the systems at redshift greater than 1.3 are below current detection limits. This is indeed what is observed since most of the [Zn/H] presented here are upper limits. Note that to be able to measure the Zn abundance (log N(HI)+[Zn/H]18.8) in sub-DLAs, the system must satisfy : [Zn/H] -1.5.
An alternative modelling approach has been recently proposed by Cen et al. (2003) using hydrodynamic simulations to reproduce the gas and metal evolution observed in DLAs. They find that the slow metallicity evolution currently observed in DLAs can be explained by the sequential formation of galaxies from the highest metallicity systems. This effect would be combined with the increase of metallicity of the absorbers with the smallest abundances. Including an artificial cut-off in order to mimic the presence of dust in DLAs, the simulations are found to be in excellent agreement with the observations (Cen et al. 2003).
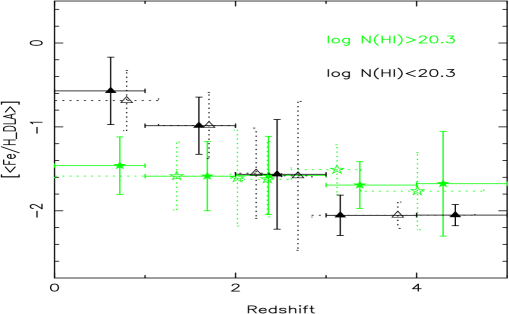
5.2.2 Weighted Mean Metallicity
Since DLAs and sub-DLAs are known to contain a major fraction of the neutral gas at all redshifts (Péroux et al. 2003), all of these systems should be used to probe the metallicity of the Universe and its evolution with time. A quantitative way of estimating this evolution is provided by the HI-weighted mean metallicity. Pettini et al. (1997) state that “under the working assumption that DLAs account for most of the material available for star formation at high redshift, the quantity (X=Fe or Zn) is a measure of the degree of metal enrichment by the Universe at a given epoch”.
Figure 5 presents the column density-weighted mean Fe ii abundances of systems in redshift bins of (solid bins) and in constant HI interval (dashed bins), for various sub-samples of quasar absorbers. Although more advanced statistical methods have been recently suggested (Kulkarni & Fall 2002), we choose to follow the prescription from Pettini et al. (1997):
| (3) |
where
| (4) |
and the error are estimated from the standard deviation, :
| (5) |
with
| (6) |
The results of these calculations are shown in Figure 5 for different subsets of quasar absorbers. The top panel includes all quasar absorbers (DLAs + sub-DLAs) as well as systems with N(HI) atoms cm-2. The bottom panel shows DLA and sub-DLAs separately. We note that the evolution of is clearly more pronounced for sub-DLAs than for DLAs, but this result is not apparent when all absorbers with N(HI) atoms cm-2 are considered. Indeed, in our sample the number of DLAs (72) is much larger than the number of sub-DLAs (17). On the contrary, in the Universe we expect the number of sub-DLAs to be up to 3 times (at ) the number of DLAs (Péroux et al. 2002). Since high column density systems dominate the HI-weighted mean metallicity, it will be important to increase the sub-DLA sample size to better probe . Nevertheless, these results show that the HI column density-weighted mean metallicity Fe ii of sub-DLAs do evolve with redshift more markedly than for the DLA population. The dotted bins correspond to constant HI intervals and therefore present similar number of systems. They also reveal an increase of metallicity with decreasing redshift, showing that this result is not an artifact of the low number of sub-DLAs known at . Starting from a metallicity 1/100 solar at , the sub-DLAs evolve up to a metallicity 1/3 solar at . The ionization correction cannot explain the evolution observed since we have shown in Paper I that for [Fe ii/HI], it does not exceed 0.2 dex. These results again reinforce the hypothesis that sub-DLAs better trace the global metallicity evolution and therefore should be included in the metallicity determination to obtain a complete picture of the abundance.
5.2.3 Correlating with Other Properties
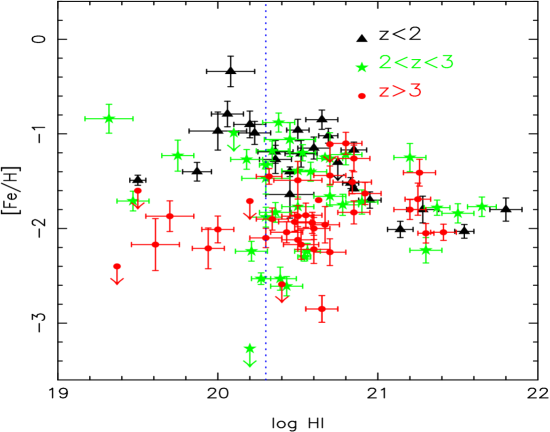
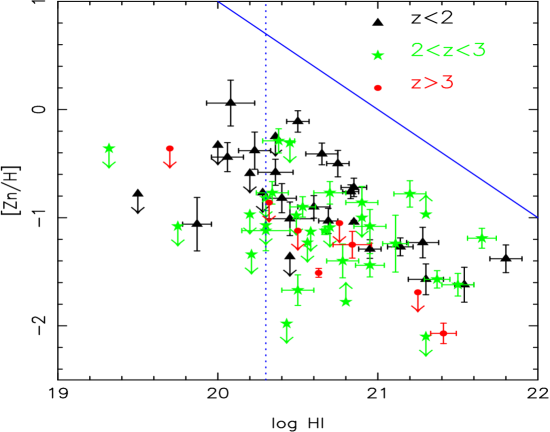
[Fe-Zn/H] versus HI: Figure 6 presents [Fe-Zn/H] as a function of HI column density for DLAs and sub-DLAs in three different redshift ranges: , and . In the top panel ([Fe/H]), the spread of values is larger at lower HI column densities. This suggests that we are sampling a different class of objects, or at least different parts of the same object as suggested by e.g. Boissier, Péroux & Pettini (2002). Another possibility is that dust plays an important role in the diversity of properties through a range of star formation histories. In contrast, there is little spread in the [Fe/H] ratio at very high HI column densities (log N(HI)) posing the question of why these systems differ from the other quasar absorbers. This might indicate that systems with high column densities belong to a well-defined population of objects, though more probably, the lack of apparent spread could be the result of a bias against high column density, high metallicity absorbers due to their high dust content (Boissé et al. 1998). Indeed, the bottom panel of Figure 6 shows that the observational bias noted by Boissé et al. in the HI versus [Zn/H] relation, still holds (i.e. no data are situated above the [Zn/H]+logN(HI) 21 solid line). A direct dust diagnostic in sub-DLAs is not straightforward to make since Zn ii is seldom detected. Using the three Zn ii detections in our sample of 12 systems, we find that the [Zn/Fe] value is around 0.3-0.4 dex. This suggests that the amount of dust is not negligible, although naturally there are too few detections to draw any firm conclusions. In addition, a study of absorbers derived from a radio-selected quasar sample (CORALS) does not indicate that a dust bias greatly affects DLAs studies (Ellison et al. 2001), but in the authors own words the conclusions are only tentative due to the limited size of the data set. Furthermore, in the range log N(HI), i.e. the bulk of the data available, the high redshift objects are less evolved than the others. In any case, we find that the metallicity evolution of quasar absorbers is a strong function of the HI column density. In addition, we have shown that the ionization correction in Fe ii (see Paper I) is similar within a group of systems with similar column densities. In the sub-DLA range, it tends to increase the Fe ii column density measured by 0.1-0.2, thus not affecting the apparent evolution.
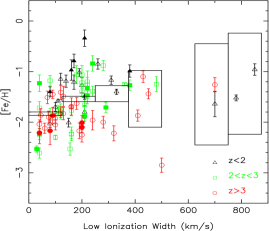
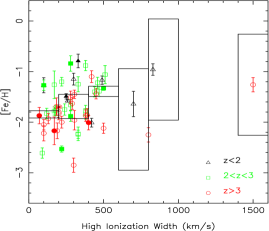
[Fe-Zn/H] versus kinematic properties: Figure 7 presents the metallicity of quasar absorbers as a function of their kinematic properties (, ) as measured in Section 3. The symbol shapes denote different redshift ranges. The open symbols are for DLAs and the filled symbols are for sub-DLAs. The results indicate that in most cases the properties are homogeneously mixed between samples of different HI column densities or redshifts. The boxes represent the mean in a given velocity interval with rms errors and suggest an increase of metallicity towards larger ionization widths, although the statistical significance of this result is low.
5.3 Relative Abundances
The comparison of elemental ratios, independent of HI column density, but as a function of metallicity is also very important. We concentrate in particular on the (i.e. O, Si) over Fe-peak element ratios versus [Fe/H] metallicities, since this relation provides information on the star formation histories of quasar absorbers. [/Fe] versus [Fe/H] is a strong function of the star formation history: /Fe depends on the lifetimes of the element progenitors, whereas [Fe/H] depends on the star formation rates. The -elements are typical products of Type II supernovae, which are likely to dominate the early stages of galaxy formation. Fe-peak elements on the contrary are products of Type Ia supernovae, which play a role in later evolutionary stages. Therefore, high overabundances of -elements at low [Fe/H] indicate recent star formation, while solar -element abundances at low [Fe/H] suggests a lower star formation rate or bursts separated by quiescent periods. Nevertheless, the interpretation of these elemental ratios is once again complicated by differential depletion: Fe ii and Si ii are known to be depleted onto dust grains in different proportions while O i is expected to remain unaffected by dust depletion.
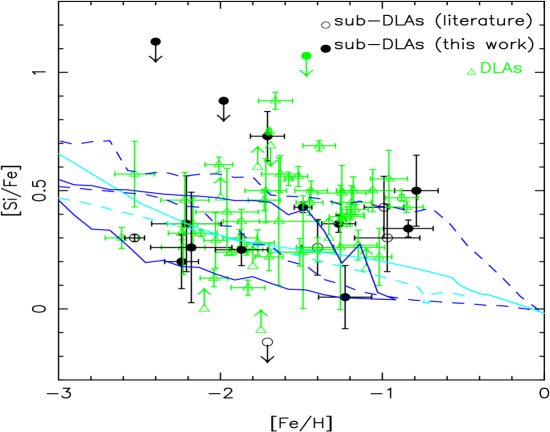
[Si/Fe]: Figure 8 shows that [Si/Fe] is similar in both DLAs and sub-DLAs, averaging around +0.5 dex. For the sake of homogeneity we recompute these ratios for all data from the literature and models assuming [Si/H] (Grevesse & Sauval 1998). This value is typical of Galactic metal-poor stars and is a strong indicator of enhancement if dust depletion does not play a major role. Nevertheless, the differential depletion of these two elements can lead to the same enhancement as the one observed. This observation can be directly compared with various models of galaxy formation and evolution. Models of Hou, Boissier & Prantzos (2001), with cut-off at the DLA and sub-DLA column density definitions, are presented in Figure 8 as dark-coloured dashed and solid contours, respectively. In both cases, the models seem to underproduce the Si ii abundance with respect to Fe in comparison with observations, but since the yields used in the model are uncertain by a factor 2, at best, it is unlikely that the absolute value of the abundance ratio is known with an uncertainty better than 0.6 dex.
In an alternative approach, Calura, Matteucci & Vladilo (2002) have produced models for a variety of galaxy types. In Figure 8, the light-coloured solid (dashed) curves are for spirals (irregulars). Indeed, in the chemical evolution models, irregulars are found to reproduce well the observed properties of DLAs. In these models, there is no artificial bias applied to mimic the effect of dust on the observations, nor was it necessary to add an extra HI column density cut-off to match the quasar absorbers’ definition. In the case of spiral galaxies, in particular, the models presented in Calura, Matteucci & Vladilo (2002) never reach the sub-DLA column density since star formation is set to occur only above a density threshold, as suggested by Chiappini et al. (1997). In order to reproduce the properties of sub-DLAs, it has been necessary to eliminate this threshold and extend the computations towards larger radii (20 kpc). For [Si/Fe], the two types of models show little difference. In addition, the interpretation of this elemental ratio might be complicated by the effect of dust.
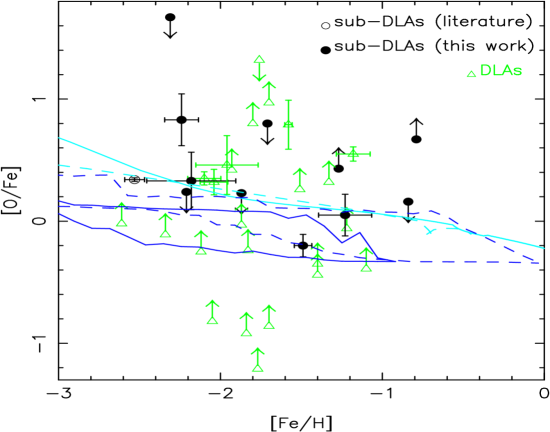
[O/Fe]: O i is not often measured in DLAs, since the most predominant line, O i 1302, is often saturated. In contrast, in sub-DLAs where the column densities are considerably smaller, this line is well suited for the abundance determination of oxygen. This element, which is not affected by dust depletion, is also a typical product of Type II supernovae. The prospect of measuring O i in large samples of sub-DLAs means that we will have a good indicator of over Fe-peak element ratios.
Figure 9 shows the evolution of the [O/Fe] ratio as a function of metallicity. All these ratios are recomputed assuming [O/H] (Holweger 2001). In most cases, this ratio is is sub-solar at high metallicities ([Fe/H]-1.6). However, [O/Fe] is still greater than solar at low metallicities. Similarly, Galactic metal-poor stars show an enhancement between 0.35 and 1 (Goswami & Prantzos 2000 and references therein). However, in the case of high [O/Fe] ratio, one cannot decipher whether dust depletion or nucleosynthesis produces such high values. In the case of low [O/Fe], however, we know that the intrinsic values cannot be much smaller than the values observed.
Models from Hou, Boissier & Prantzos (2001) seem to underproduce the corresponding ratios with respect to the observations for both DLAs and sub-DLAs. In contrast, models from Calura, Matteucci & Vladilo (2002) seem able to reproduce the observed sub-solar values of [O/Fe] (see also Chiappini, Romano & Matteucci 2002). At present, however, the observed sample is still too small to allow firm conclusions to be drawn.
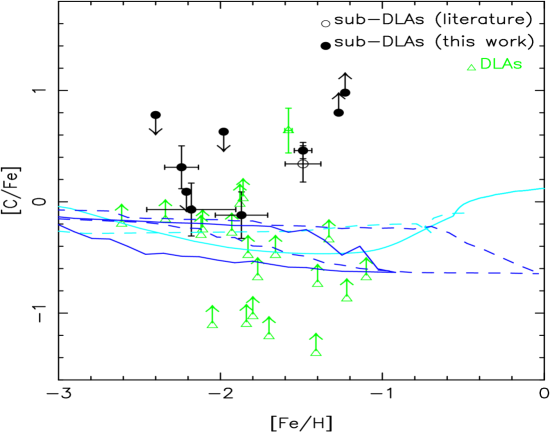
[C/Fe]: For the same reasons as O i, the first comprehensive set of measurements of C ii has been made in high HI absorbers. [C/Fe] is approximately solar in the majority of the Galactic stars. Previous studies of DLAs only allowed for lower limit determinations (see Figure 10), but measurements of C ii in sub-DLAs provide a tracer of Fe-peak elements regardless of dust depletion. In this figure we use [C/H] (Holweger 2001) as an estimate of the solar value. Some of the [C/Fe] ratios in sub-DLAs are clearly oversolar, at the level of the overabundance observed in the two tentative [C/Fe] measurements in the DLAs. Since C is a mildly refracted element in the interstellar medium, these measurements provide our best indicator of the dust content of sub-DLAs. Indeed, although C and Fe do not share the same nucleosynthesis origin, in the Milky Way stars, C and Fe show identical behaviours, i.e. [C/Fe]=0 (Goswami & Prantzos 2000). Therefore the deviation from zero observed in sub-DLAs are suggestive of either the presence of dust in these systems or a different behaviour of C relative to Fe relative to the Milky Way stars. Both types of chemical evolution models predict abundance ratios in the intermediate range between DLAs and sub-DLAs. Nevertheless, the models of Hou, Boissier & Prantzos (2001) do not include yields from intermediate-mass stars. This will affect the [C/Fe] abundance ratio. The models of Calura, Matteucci & Vladilo (2002) predict very little difference between DLAs and sub-DLAs, as is observed. But again, given the limited data set, these conclusions are tentative.
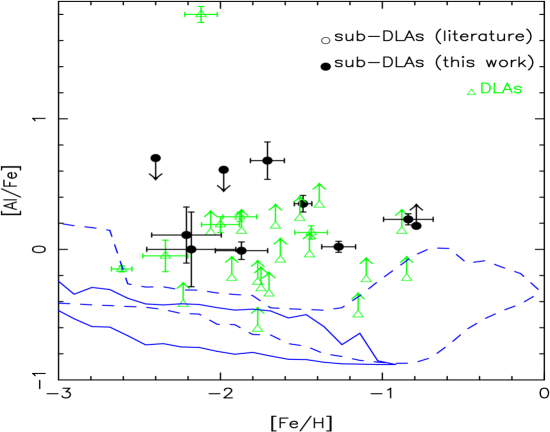
[Al/Fe]: The metallicity evolution of the [Al/Fe] ratio is presented in Figure 11, using [Al/H] (Grevesse & Sauval 1998). In DLAs, this ratio follows a trend similar to the one observed in metal-poor stars (Prochaska & Wolfe 2002). In the sub-DLA case, this ratio is strongly affected by ionization corrections which increase the real abundance of Al with respect to that measured solely from Al ii. The [Al/Fe] ratio will consequently rise by a factor of 0.3 dex in the worst case (see Paper I). Again sub-DLAs are characterised by a mean [Al/Fe] elemental ratio larger than DLAs. In this case, we note that models of Hou, Boissier & Prantzos (2001) do not match the values of high-redshift DLAs nor the observations in the Milky Way. It should be noted that the nucleosynthesis situation of this element is unclear (Goswami & Prantzos 2000) but it could also be that the intermediate-mass stars not included in the models contribute to the true [Al/Fe] abundance ratio.
6 Conclusion
Péroux et al. (2003) have extended the DLA definition to a new class of absorbers: the sub-DLAs with column density N(HI) 2 atoms cm-2. These systems are believed to contain a large fraction of the neutral gas mass in the Universe, especially at . Based on these considerations, we have constructed and fully analysed a sample of 12 sub-DLAs (see Paper I). In the present paper, we analyse several of the properties of these absorbers in conjunction with DLAs from the literature. Our main findings can be summarised as follows:
-
•
Our sample of sub-DLAs can be used to observationally determine for the first time the shape of the column density distribution, , down to N(HI) cm-2. The results are in good agreement with the predictions from Péroux et al. (2003). An evolutionary study of is not possible with the current sample illustrating the need for a sample of sub-DLAs at high-redshifts.
-
•
An analysis of the clustering of sub-DLAs in our sample shows that these are more clustered than expected from a random distribution, although the number statistic is too small to draw firm conclusions.
-
•
We measure the kinematic properties of the sub-DLAs from our sample together with a statistically significant number of DLAs from the literature. We compare low- and high-ionization transition widths and find that the sub-DLA properties roughly span the parameter space of the DLAs, thus challenging multicomponent semi-analytical models, such as the one presented by Maller et al. (2002).
-
•
The metallicity of absorbers as traced by [Fe/H] shows a slightly more pronounced slope for sub-DLAs () than for DLAs (). In addition, the HI-weighted mean metallicity is computed for various sub-sets of quasar absorbers. The evolution of might be stronger for sub-DLAs than for DLAs, and absorbers with N(HI) atoms cm-2 appear to be the less evolved, suggesting these objects in particular should be studied in detail. Observational evidence supports the hypothesis that this different behaviour is not due to the hidden effect of dust. We therefore propose that sub-DLAs might be associated with a class of galaxies which better traces the overall chemical evolution of the Universe.
-
•
A study of the metallicity evolution with metal line profile ionization width might show hints of a correlation, whereby higher [Fe/H] ratios are associated with systems with larger widths. However the statistical significance of this result is low and a larger sample of observations is required to unambiguously address this issue.
-
•
Abundance ratios for [Si/Fe], [O/Fe], [C/Fe] and [Al/Fe] were determined and compared with two different sets of models of the chemical evolution of galaxies. Overall, these appear to resemble abundance ratios observed in DLAs. The question thus remains open whether the two classes of objects have similar chemical evolution histories or whether there are objects with different ages and star formation histories, but at a similar stage of chemical evolution. The first comprehensive sets of measurements of O i and C ii in high H i column density systems are given. Indeed, these are well-defined in sub-DLAs while they are almost always saturated in DLAs. These elements, unaffected by dust depletion, provide direct indicators of the abundances in these systems.
These various issues illustrate the importance of further studies of sub-DLAs to interpret the overall chemical evolution of neutral matter with redshift, as well as to extend the analysis of quasar absorbers properties to a lower column density range. We are currently undertaking an observational program aimed at studying sub-DLAs at high-redshifts.
7 Acknowledgments
We are grateful to Samuel Boissier for extending the predictions of Hou, Boissier & Prantzos (2002) to the sub-DLA column densities and to Francesco Calura for doing the same with the models of Calura, Matteucci & Vladilo (2002). We have benefited from conversations with Samuel Boissier, Francesco Calura, Mike Irwin, Ari Maller, Francesca Matteucci, Paolo Molaro, Nikos Prantzos, Simone Recchi and Zheng Zheng. We also thank an anonymous referee for extensive and helpful comments. This work was supported in part by the European Community Research and Training Network “The Physics of the Intergalactic Medium”. CP is founded by an European Marie Curie Fellowship and MDZ by Swiss National Funds. RGM thanks the Royal Society.
References
- [1] Bechtold, J., 1994, ApJS, 91, 1.
- [2] Boissé, P., Le Brun, V., Bergeron, J. & Deharveng, J.M., 1998, A&A, 333, 841.
- [3] Boissier, S. & Prantzos, N., 1999, MNRAS, 307, 857.
- [4] Boissier, S. & Prantzos, N., 2000, MNRAS, 312, 398.
- [5] Boissier, S., Péroux, C. & Pettini, M., 2003, MNRAS, 338, 131.
- [6] Calura, F., Matteucci, F., & Vladilo, G., 2003, MNRAS, 340, 59.
- [7] Cen, R., Ostriker, J.P., Prochaska, J.X. & Wolfe, A.M., 2003, ApJ, submitted, astro-ph/0203524.
- [8] Chiappini, C., Matteucci, F., & Gratton. R., 1997, ApJ, 477, 765.
- [9] Chiappini, C., Romano, D. & Matteucci, F., 2003, MNRAS, 339, 63.
- [10] Corbelli, E., Salpeter, E. & Bandiera, B., 2001, ApJ, 550, 26.
- [11] Dessauges-Zavadsky, M., D’Odorico, S., McMahon, R.G., & Péroux, C., 2001, “17th IAP Astrophysics Colloquium”, Ed. Ferlte, Lemoine, Desert & Raban.
- [12] Dessauges-Zavadsky, M., Péroux, C., Kim, T.S., D’Odorico, S., & McMahon, R.G., MNRAS, 2003, submitted [Paper I].
- [13] D’Odorico, V., Petitjean, P. & Cristiani, S., 2002, A&A, 390, 13.
- [14] Ellison, S. L. & Lopez, S., 2001, A&A, 380, 117.
- [15] Ellison, S.L., Pettini, M., Steidel, C. C. & Shapley, A. E., 2001, ApJ, 549, 770.
- [16] Gardner, J.P., Katz, N., Hernquist, L., & Weinberg, D.H., 1997, ApJ, 484, 31.
- [17] Goswami, A. & Prantzos, N., 2000, A&A, 359, 191.
- [18] Grevesse, N. & Sauval, A.J., 1998, Space Science Review, vol. 85.
- [19] Haehnelt, M., Steinmetz, M. & Rauch., M., 1998, ApJ, 495, 647.
- [20] Holweger, H., 2001, “Joint SOHO/ACE workshop ”Solar and Galactic Composition”.
- [21] Hou, J.L., Boissier, S. & Prantzos, N., 2001, A&A, 370, 23.
- [22] Kulkarni, V. P. & Fall, S. M., 2002, ApJ, 580, 732.
- [23] Lanzetta, K., McMahon, R.G., Wolfe, A., Turnshek, D., Hazard, C. & Lu, L., 1991, ApJS, 77, 1.
- [24] Ledoux, C., Petitjean, P., Bergeron, J., Wampler, J. & Srianand, R., 1998, A&A, 337, 51L.
- [25] Lopez, S., Maza, J., Masegosa, J. & Marquez, I., 2001, A&A, 366, 387.
- [26] Lopez, S. & Ellison, S. L., 2003, A&A, in press, astro-ph/0303441.
- [27] Maller, A.H., Prochaska, J.X., Somerville, R.S. & Primack, J.R., 2001, MNRAS, 236, 1475.
- [28] Maller, A.H., Prochaska, J.X., Somerville, R.S. & Primack, J.R., 2002, MNRAS, submitted, astro-ph/0211231.
- [29] Pei, Y.C, & Fall, M.S., 1995, ApJ, 454, 69.
- [30] Pei, Y.C, Fall, M.S. & Hauser, M.G., 1999, ApJ, 522, 604.
- [31] Péroux, C., Storrie-Lombardi, L., McMahon, R., Irwin, M. & Hook, I., 2001, AJ, 121, 1799.
- [32] Péroux, C., McMahon, R., Storrie-Lombardi, L. & Irwin, M., 2003, MNRAS, submitted, astro-ph/0107045.
- [33] Péroux, C., Irwin, M., McMahon, R.G., & Storrie-Lombardi, L.J., 2002, “Chemical Enrichment of Intracluster and Intergalactic Medium”, ASP Conference Proceedings, Vol. 253, Ed R. Fusco-Femiano & F. Matteucci.
- [34] Petitjean, P., Srianand, R. & Ledoux, C., 2000, A&A, 364L, 26.
- [35] Petitjean, P., Webb, J., Rauch. M., Carswell, R., & Lanzetta, K., 1993, MNRAS, 262, 499.
- [36] Pettini, M., Smith, L.J., King, D.L. & Hunstead, R.W., 1997, ApJ, 486, 665.
- [37] Pettini, M., Ellison, S. L., Steidel, C. C., & Bowen, D. V., 1999, ApJ 510, 576.
- [38] Prantzos, N. & Boissier, S., 2000, MNRAS, 315, 82.
- [39] Prochaska, J.X., Gawiser, E. & Wolfe, A.M., 2001, ApJ, 552, 99.
- [40] Prochaska, J.X., Howk, J.C., O’Meara, J.M., Tytler, D., Wolfe, A.M., Kirkman, D., Lubin, D. & Suzuki, N., 2002, ApJ, 571, 693.
- [41] Prochaska, J.X. & Wolfe, A.M., 1998, ApJ, 507, 113.
- [42] Prochaska, J.X. & Wolfe, A.M., 1999, ApJS, 121, 369.
- [43] Prochaska, J.X. & Wolfe, A.M., 2000, ApJ, 533, L5.
- [44] Prochaska, J.X. & Wolfe, A.M., 2002, ApJ, 566, 68.
- [45] Savaglio, S., 2000, IAUS, 204, 24.
- [46] Steidel, C.C., Adelberg, K.L., Dickinson, M. et al. , 1998, ApJ, 492, 428.
- [47] Storrie-Lombardi, L., Irwin, M. & McMahon, R. , 1996a, MNRAS, 282, 1330.
- [48] Storrie-Lombardi, L., McMahon, R. & Irwin, M., 1996b, MNRAS, 283, L79.
- [49] Storrie-Lombardi, L. & Wolfe, A., 2000, ApJ, 543, 552.
- [50] Vladilo, G., Bonifacio, P., Centurión, M. & Molaro, P., 2000, ApJ, 543, 24.
- [51] Wolfe, A., Lanzetta, K. M., Foltz, C. B. & Chaffee, F. H., 1995, ApJ, 454, 698.
- [52] Wolfe, A., & Prochaska, J.X., 2000a, ApJ, 545, 591.
- [53] Wolfe, A., & Prochaska, J.X., 2000b, ApJ, 545, 603.
- [54] Zheng, Z. & Miralda-Escudé, J., 2002, ApJ, 568, 71.