A Homogeneous Sample of Sub-DLAs I: Construction of the Sample and Chemical Abundance Measurements ††thanks: Based on ESO public data released from July 2001 obtained with UVES at the VLT Kueyen telescope, Paranal, Chile
Abstract
In this first paper of a series, we report on the use of quasar spectra obtained with the UVES high resolution spectrograph and available through the ESO VLT archive to build the first homogeneous and unbiased sample of sub-DLA systems, absorbers with \textH i column densities cm -2 but lower than the classical definition of damped Ly systems (DLAs) cm-2. A systematic investigation of the properties of these systems and a comparison with those of the DLAs (Paper II of this series; Péroux et al. 2003b) is expected to provide new clues on the association of high column density absorbers with galaxies and on the overall evolution of the neutral hydrogen gas mass and metal content in the Universe. In the spectra of 22 quasars which were found suitable for a sub-DLA search, we identified 12 sub-DLAs and 1 borderline case between the DLA and sub-DLA systems in the redshift interval . We measured the column densities of \textH i and of up to 16 additional ions of low-, intermediate- and high-ionization, \textO i, \textC ii, \textC iv, \textSi ii, \textSi iv, \textN i, \textS ii, \textMg i, \textMg ii, \textAl ii, \textAl iii, \textFe ii, \textFe iii, \textNi ii, \textZn ii, and \textCr ii. We further investigated the significance of the ionization corrections in the determination of the chemical abundances from the low-ionization ions in the sub-DLA \textH i column density range. Using the predictions of different ion ratios as a function of the ionization parameter computed with the CLOUDY software package, we have estimated that with the exception of one case, the ionization corrections to the abundances of 9 systems for which we were able to constrain the ionization parameter, are lower than 0.2 dex for all of the elements except \textAl ii and \textZn ii down to \textH i column densities of (\textH i) cm-2. We finally present the first sub-DLA chemical abundance database which contains the abundance measurements of 11 different elements (O, C, Si, N, S, Mg, Al, Fe, Ni, Zn, and Cr). We took advantage of the lower \textH i column densities in sub-DLAs to measure, in particular, the O and C abundances using lines which are normally saturated in DLAs.
keywords:
galaxies: abundances – galaxies: high-redshift – quasars: absorption lines – quasars.1 Introduction
Galaxy formation and evolution remain important issues in our understanding of the early epoch of the Universe. Fundamental steps towards these issues would be the reconstruction of the chemical histories of galaxies and the metal census of the Universe. They are investigated both via the traditional approach of observing the galaxy starlight, and via the absorption line systems detected along the quasar lines of sight independently of their distance, luminosity and morphology. The absorption line systems, in particular, provide a very accurate observational method to measure the neutral gas and metal content of the Universe up to very high redshifts, (e.g. Lu et al. 1996a; Prochaska, Gawiser & Wolfe 2001; Dessauges-Zavadsky et al. 2001a; Songaila & Cowie 2002).
The quasar absorption line systems are divided into three classes according to their neutral hydrogen column density: the Ly forest with (\textH i) ranging from to cm-2, the Lyman limit systems (LLs) with (\textH i) cm-2, and the damped Ly systems (DLAs) with (\textH i) cm-2 (Wolfe et al. 1986). They thus probe different media from voids to halos and disks of both dwarf and normal (proto-)galaxies (Prochaska & Wolfe 1998; Ledoux et al. 1998; Haehnelt, Steinmetz & Rauch 1998; Matteucci, Molaro & Vladilo 1997; Jimenez, Bowen & Matteucci 1999; Calura, Matteucci & Vladilo 2003). The DLAs, in particular, are a cosmologically important population, since they dominate the neutral hydrogen content of the Universe (e.g. Wolfe et al. 1995; Storrie-Lombardi & Wolfe 2000) and are believed to be the progenitors of the present-day galaxies.
| Quasar name | ESO prog. No. | Settings | Wavelength coverage∗ | Exposure | |||
|---|---|---|---|---|---|---|---|
| Å | s | +(Ref.) | |||||
| Q00002620 | 4.11 | Commissioning | B437+R860 | 37705000, 670010500 | 19700 | 3.390 | … |
| APM BR J03074945 | 4.75 | Commissioning | R600, R760, R800 | 50009900 | 26300 | 4.466 | ?a |
| Q03473819 | 3.23 | Commissioning | B427+R860 | 36554888, 672210000 | 9500 | 3.025 | … |
| Q0841129 | 2.50 | 65.O-0063 | B412+R860 | 35504740, 671010000 | 5400 | 2.375 | … |
| … | … | … | … | … | … | 2.476 | … |
| HE 09401050 | 3.05 | 65.O-0474 | B346+R580 | 36003870, 47806809 | 3600 | … | … |
| Q1038272 | 2.32 | 65.O-0063 | B437+R860 | 37654998, 670710000 | 5400 | … | … |
| Q1101264b | 2.14 | Science Verification | B346+R580, B437+R860 | 30508530 | 45000 | … | 1.838b (1) |
| HE 11041805c | 2.31 | Commissioning | B360, R670 | 31844024, 56987714 | 10880 | 1.662 | … |
| Q1151068 | 2.76 | 65.O-0158 | B346+R580, B437+R860 | 310010000 | 21600 | 1.774 | … |
| PKS 1157014 | 1.99 | 65.O-0063 | B346+R550 | 30503870, 45006500 | 7200 | 1.944 | … |
| Q12231753 | 2.94 | 65.P-0038, 65.O-0158 | B390+R564, B437+R860 | 330010000 | 18000 | 2.466 | 2.557 |
| PKS 12320815 | 2.57 | 65.P-0038 | B390+R564 | 33006650 | 10800 | 2.338 | … |
| Q1409095 | 2.86 | 65.O-0158 | B437+R860 | 37694998, 670710000 | 18000 | 2.456 | 2.668 (2,3,4) |
| Q1444014 | 2.21 | 65.O-0158 | B390+R564 | 32946650 | 18000 | … | 2.087 (3,5) |
| Q1451123 | 3.25 | 65.O-0063 | B424+R750 | 36404855, 59009400 | 7200 | 2.469 | 2.255d (2) |
| … | … | … | … | … | … | … | 3.171e (1,2) |
| Q1511090 | 2.88 | 65.P-0038 | B390+R564, B437+R860 | 330010000 | 32400 | … | 2.088 |
| Q2059360 | 3.09 | 65.O-0063 | B480+R740 | 42005340, 59009300 | 10800 | 3.083 | 2.507 |
| Q2116358 | 2.34 | 65.O-0158 | B390+R564 | 32946650 | 7200 | … | 1.996 (6,7,8) |
| Q2132433 | 2.42 | 65.O-0158 | B390+R564 | 32946650 | 3600 | 1.914 | … |
| PSS J21551358 | 4.26 | 65.O-0296 | R565, R800 | 46339800 | 11600 | 3.316 | 3.142 |
| … | … | … | … | … | … | … | 3.565 |
| … | … | … | … | … | … | … | 4.212 |
| Q2206199 | 2.56 | 65.O-0158 | B390+R564, B437+R860 | 329410000 | 25200 | 1.920 | … |
| … | … | … | … | … | … | 2.076 | … |
| PSS J23440342 | 4.24 | 65.O-0296 | R565, R800 | 46339800 | 13500 | 3.220 | 3.882 |
∗ With some gaps in the wavelength coverage.
a The detection of sub-DLAs is uncertain (see Section 3.1).
b This quasar has been observed for the study of the Ly forest. Nevertheless, an analysis of the spectra revealed the presence of a sub-DLA. For consistency reasons, this system will not be included in the study of the sub-DLA statistical properties presented in Paper II.
c This quasar is gravitationally lensed. Only the brightest line of sight was included in our study.
d This absorption line system is a borderline case between the DLA and sub-DLA systems with a \textH i column density of (\textH i) . It is not included in the sub-DLA sample.
e The spectra do not cover the Ly absorption line at Å of this sub-DLA. It has been identified thanks to the \textH i column density measurement reported by Petitjean, Srianand & Ledoux (2000).
References to the sub-DLAs already reported in the literature:
(1) Petitjean, Srianand & Ledoux (2000); (2) Lanzetta et al. (1991); (3) Pettini et al. (2002); (4) Lu et al. (1993); (5) Wolfe et al. (1995); (6) Lanzetta, Wolfe & Turnshek (1987); (7) Wampler, Bergeron & Petitjean (1993); (8) Møller, Jakobsen & Perryman (1994)
Observing programmes:
65.P-0038: “Probing the nuclear regions of QSOs with associated systems”
(Srianand, Petitjean & Aracil)
65.O-0063: “Molecular hydrogen at high redshift” (Ledoux, Petitjean, Srianand & Rauch)
65.O-0158: “Abundance ratios in Damped Ly systems: clues to the nucleosynthesis of N and Mn”
(Pettini, Bergeron & Petitjean)
65.O-0296: “A study of the IGM-galaxy connection at using the UVES high quality absorption spectra”
(D’Odorico, Cristiani, Fontana, Giallongo & Savaglio)
65.O-0474: “Deuterium abundance in the high redshift QSO absorption system towards HE 09401050”
(Molaro, Centurión & Bonifacio)
A recent study by Péroux et al. (2003a) has, however, suggested that the relative importance of lower \textH i column density systems, the so-called ‘sub-DLA systems’ with \textH i column densities between and cm-2, increases with redshift. Indeed, this until now poorly studied class of absorbers should contain about 45% of the neutral hydrogen mass at , and may thus play an important role at high redshift in the study of the redshift evolutions of both the total amount of neutral gas and the metal content in the Universe. The sub-DLAs, similarly to the DLAs, present the advantage that the \textH i column density of these systems can accurately be estimated thanks to the presence of damping wings in their Ly lines, observed down to \textH i column densities of cm-2.
At the present time only the chemical abundances of DLAs have been used to trace the metal content in the Universe, but this has shown unexpected results. Contrary to the cosmic chemical evolution model predictions (e.g Pei & Fall 1995; Pei, Fall & Hauser 1999; Cen & Ostriker 1999; Cen et al. 2003), the most recent observations indicate only a mild evolution of the metal content with redshift (Pettini et al. 1999; Prochaska & Wolfe 2000; Vladilo et al. 2000; Dessauges-Zavadsky et al. 2001b; Prochaska & Wolfe 2002). Only Savaglio (2000), who focused on lower \textH i column density DLA systems, claims evidence for redshift evolution. If the Péroux et al. (2003a) predictions are confirmed, the sub-DLA metallicities should be taken into account in order to obtain a complete picture of the redshift evolution of the Universe’s metal content. Indeed, the current metallicity studies which focused only on the higher column density absorption line systems, may have provided a biased and/or incomplete view of the global metal evolution in the Universe at . The observational confirmation of the impact of the sub-DLA systems at high redshift thus is crucial. In addition, the investigations of the chemical, kinematic and clustering properties of the sub-DLAs to see whether we are dealing with a different class of objects with a lower \textH i content/mass relative to the DLAs are our further motivations for studying these absorbers. If sub-DLAs are the basic building blocks of the hierarchical growth of galactic structures as suggested by Péroux et al. (2003a), their abundance analysis may provide an insight into the very early stages of the chemical enrichment of galaxies.
The work presented in this paper therefore aims at constructing the first homogeneous sample of sub-DLA systems. For this purpose, we have used all of the high-resolution quasar spectra available to us in July 2001 in the ESO UVES-VLT archives. Section 2 explains how the quasar spectra were selected and how the sub-DLA systems were identified. We provide a detailed chemical analysis for each sub-DLA system in Section 3, and we address the issues of the photoionization effects in Section 4. Finally, in Section 5, we summarize all the ionic column density and the absolute abundance measurements. In Paper II of this series (Péroux et al. 2003b), we use the database presented here in combination with the data on DLAs and other sub-DLAs from the literature to discuss the overall properties of these objects.
2 Construction of a homogeneous sub-DLA sample
All the observations presented in this paper were acquired with the Ultraviolet-Visual Echelle Spectrograph (UVES; see D’Odorico et al. 2000) on the VLT 8.2 m ESO telescope at Paranal, Chile, between the Commissioning and the Science Verification time of the instrument at the end of 1999 and beginning of 2000, respectively, and July 2000. All these data reached in July 2001 the end of their one-year long propriety period and could be retrieved from the ESO archives. A total of 35 high resolution, high signal-to-noise ratio (S/N) quasar spectra was available, illustrating the success of both the instrument and the data distribution policy of the ESO archives.
2.1 Quasar Selection
The goal of our study being well defined, we have selected from the 35 quasars available in the ESO UVES archives only the quasars suitable for the sub-DLA search. First, we took the conservative approach of excluding all quasars exhibiting Broad Absorption Lines (BALs), since the nature of these objects and their characteristic features are not fully understood yet, rendering the distinction between true intervening absorption systems and other quasar spectral features difficult. However, we have not excluded the quasars selected for the study of associated systems, , since the quasars considered in the ESO programme 65.P-0038 (see Table 1) do not exhibit BALs which are often confused with associated absorbers. Secondly, we have excluded the quasars which were observed for the sole purpose of studying the Ly forest (e.g. for the analysis of voids, low column density distribution). Indeed, these quasars have been pre-selected for having no high column density systems in their spectrum, precisely the type of systems we are looking for in the present study. In one case, however, a sub-DLA has been found in the later sample of quasars, the quasar Q1101264 at observed during the UVES Science Verification. This absorber is included in the present abundance analysis, but for consistency reasons it will be excluded from the study of the sub-DLA statistical properties (see Paper II).
The above selection process resulted in a sample of 22 quasars. A large majority of these quasars were observed with UVES because of their intervening DLA systems. There is a priori no reason why this should create a bias in our sample. We assume that the sub-DLA systems are not preferentially found close to the DLA systems. An analysis of the clustering properties of the sub-DLA systems identified in our sample is presented in Paper II.
Table 1 summarizes the observing programme details (i.e. the ESO programme number, the exposure time, the settings), the wavelength coverages, the redshifts of the 22 selected quasars and the redshifts of their intervening DLA systems. The sample of the selected quasars should result in the construction of an unbiased and homogeneous sample of sub-DLA systems.
2.2 Data Reduction

The constructed sample of 22 quasars has benefited from a homogeneous data reduction. All of the quasar spectra were reduced using the ESO data reduction package MIDAS and the UVES pipeline in an interactive mode available as a MIDAS context. A detailed description of the pipeline can be found in Ballester et al. (2000). To optimize the results we made a systematic check of each step of the pipeline reduction. Once reduced, the wavelengths of the one-dimensional spectra were converted to a vacuum-heliocentric scale, the individual spectra were co-added using their S/N ratio as weights to get the maximum signal-to-noise ratio, and the various settings were combined to obtain the maximum wavelength spectral coverage. An average resolution of km s-1 FWHM was achieved in the spectra, and an average S/N per pixel between 10 and 150 is observed from spectrum to spectrum according to the exposure time and the magnitude of the quasar.
The final step was the normalization of the resulting spectra obtained by dividing them by a spline function fitted to smoothly connect the regions free from absorption features. The continuum in the Ly forest was fitted by using small regions deemed to be free of absorptions and by interpolating between these regions with a spline. The higher the redshift of the quasar, the more difficult is the normalization in the Ly forest due to the higher density of absorption lines (e.g. Kim, Cristiani & D’Odorico 2001). The procedure we applied for the normalization is the same as the one we used for two high-redshift and four intermediate-redshift quasars we have previously analysed for a detailed chemical abundance study of their intervening DLA systems (Dessauges-Zavadsky et al. 2001a; Levshakov et al. 2002; Dessauges-Zavadsky et al. 2002). This procedure has proven to lead to an accuracy of the normalization level of about % in the Ly forest and better than 5% redwards of the Ly emission of the quasar (according to the signal-to-noise ratio of the spectra). For each quasar we tested the derived normalization first by selecting different regions in the continuum and by varying the number of these regions used for the fit of the continuum with a spline. In the Ly forest, in particular, some regions are key regions in the continuum definition, when omitted, the shape and level of the continuum are drastically modified. We tried to qualitatively and quantitatively estimate these modifications. Secondly, we checked whether the adopted continuum fit is within the 1 error of the spectra along the whole wavelength range sampled, and we estimated the normalization accuracy by determining the mean deviation of the adopted continuum fit from the observed continuum within its 1 error and the maximum variation of this fit tolerated within the 1 error of the spectra.
2.3 Sub-DLA Identification
The sample of quasars to be analysed being defined and their high resolution spectra being reduced, we used these spectra to identify their intervening sub-DLA systems. In order to select all the sub-DLAs, we have used a detection algorithm equivalent to the one applied by Péroux et al. (2001) to detect the DLAs in medium resolution spectra ( Å pixel-1), and which was previously used by Lanzetta et al. (1991), Wolfe et al. (1995), and Storrie-Lombardi & Wolfe (2000). This technique consists in building an equivalent width spectrum over 500 pixel wide boxes for each quasar. The analysis was done 3000 km s-1 bluewards from the Ly emission of the quasar in order to avoid possible contaminations from systems associated with the quasar itself, and it ended where the S/N was too low to detect absorption features at the sub-DLA threshold, i.e. Å.
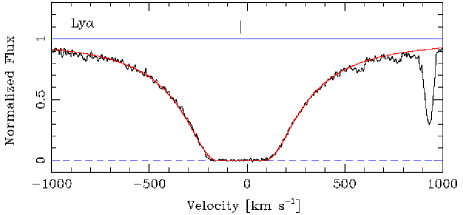
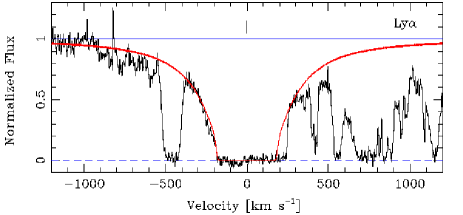
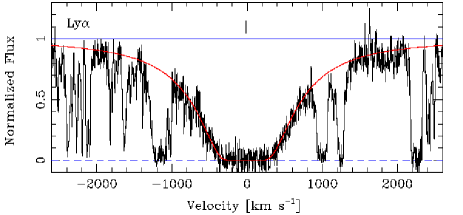
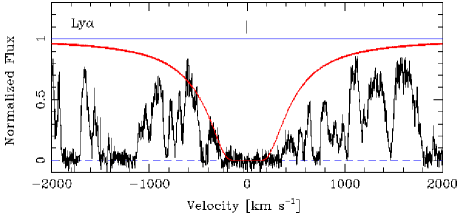
Fig. 1 displays an example of the output of the sub-DLA search algorithm in the case of the quasar Q2116358. The solid line is the equivalent width spectrum and the dotted line is the error array. The straight dashed line corresponds to the threshold above which the sub-DLA systems are detected. In this example, the sub-DLA system at Å () is clearly identified.
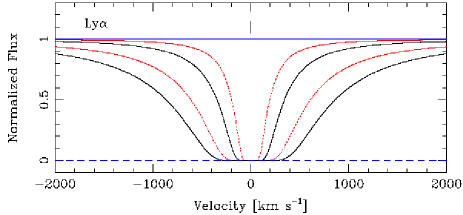
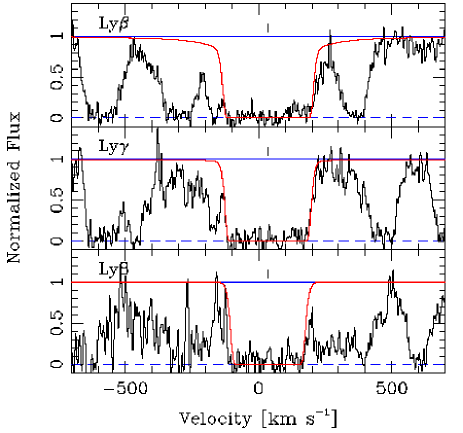
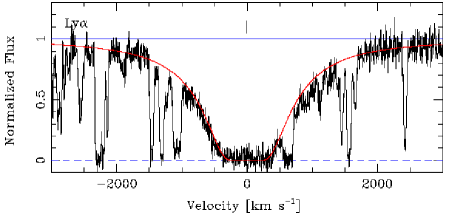
We then supplemented the sub-DLA candidates found by the algorithm with a visual identification. Indeed, since the algorithm selects any region with the required equivalent width regardless of the shape of the absorption feature and whether or not the absorption goes to zero, an additional check of the candidates is necessary to distinguish the true sub-DLAs from blends of several Ly clouds. Three main visual criteria were used to identify a sub-DLA system: i) the saturation of the absorption feature identified as the Ly absorption line of the sub-DLA candidate, ii) the presence of damping wings in the Ly absorption lines which are clearly observed in the sub-DLA \textH i column density regime between and cm-2 as illustrated in Fig. 2, and iii) the detection of lines of higher members of the Lyman series with the same \textH i column density as the one measured from the Ly line when the wavelength coverage is available. An additional visual criterion, though not necessary, was the identification of associated metal lines which are very likely to occur in absorbers with \textH i column densities greater than cm-2. On the basis of these visual criteria and to impartially select the sub-DLAs, three of us (M.D.-Z., C.P., T.-S.K.) looked independently at the sub-DLA candidates found by the algorithm and closely inspected the original spectra to determine whether or not these absorption features correspond to sub-DLAs.
We reached a good agreement in all but one case, the quasar APM BR J03074945 at . Given the high redshift of this quasar the Ly forest is very dense, and thus at three different redshifts the presence of sub-DLA systems is ambiguous (see Section 3.1). The absence of lines of higher members of the Lyman series for two of them does not allow us to draw a conclusion on the true \textH i column density of these systems, leading us to not include them in the sub-DLA sample. In the third candidate, the Lyman lines are heavily blended and prevent us from obtaining an accurate \textH i column density measurement, thus this candidate is also not analysed and not included in our sub-DLA sample. Moreover, the sub-DLA system at towards Q1451+123 has been identified thanks to the \textH i column density measurement reported by Petitjean, Srianand & Ledoux (2000), the spectra we had at our disposal do not cover the Ly line of this system. With the lines of higher members of the Lyman series Ly, Ly and Ly8 we confirm the reported \textH i column density measurement of this absorption system (see Section 3.6.2). This system is included in the abundance analysis, but it is excluded from the study of the sub-DLA statistical properties (see Paper II), similarly to the sub-DLA system towards Q1101264 (see the explanation in Section 2.1). Finally, the identified absorption line system at towards Q1451+123 is a borderline case between the DLA and sub-DLA systems with a \textH i column density of (\textH i) (see Section 3.6.1). We provide a detailed abundance analysis of this system, but we do not consider it as a sub-DLA system, and thus we do not include it in the sub-DLA sample used for the different studies undertaken in Paper II.
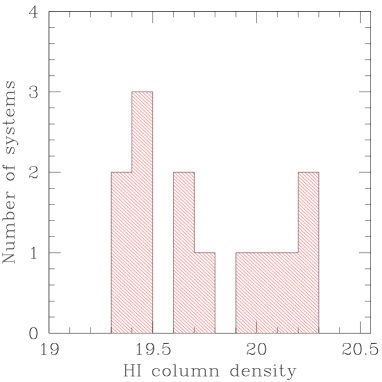
In Table 1 we give the redshifts and the references of the 12 sub-DLAs and 1 borderline case between the DLA and sub-DLA systems detected towards the 22 selected quasars, and in Fig. 3 we show their \textH i column density distribution. The detected systems span a range of \textH i column densities from to cm-2. No particular trend can be confirmed with this small number of objects yet. The sample of the 10 sub-DLAs, when excluding the sub-DLA towards Q1101264 and towards Q1451+123, constitutes an unbiased and homogeneous sample of sub-DLAs, ideal for a statistical analysis (see Paper II).
| No | Ion | No | Ion | ||||||||
| km s-1 | km s-1 | cm-2 | km s-1 | km s-1 | cm-2 | ||||||
| Low-ion transitions | |||||||||||
| 1 | 1.837407 | 158 | 3.0(0.9) | \textC ii | 12.30(0.03) | 8 | 1.838902 | 0 | 5.3(0.1) | \textSi ii | 13.61(0.01) |
| \textMg ii | 11.45(0.04) | \textO i | 14.10(0.15) | ||||||||
| 2 | 1.837507 | 147 | 4.3(0.5) | \textC ii | 12.65(0.01) | \textS ii | 13.23(0.08) | ||||
| \textMg ii | 11.70(0.04) | \textC ii | 14.70(0.08) | ||||||||
| 3 | 1.837711 | 126 | 6.9(0.1) | \textSi ii | 12.23(0.05) | \textAl ii | 12.26(0.05) | ||||
| \textC ii | 13.29(0.02) | \textFe ii | 13.14(0.01) | ||||||||
| \textAl ii | 11.50(0.05) | \textMg ii | 13.69(0.02) | ||||||||
| \textFe ii | 11.48(0.04) | \textMg i | 11.49(0.01) | ||||||||
| \textMg ii | 12.40(0.02) | 9 | 1.839144 | 26 | 8.4(0.3) | \textSi ii | 12.86(0.02) | ||||
| 4 | 1.838201 | 74 | 7.8(0.2) | \textSi ii | 12.55(0.03) | \textO i | 13.80(0.11) | ||||
| \textC ii | 13.44(0.08) | \textC ii | 13.55(0.05) | ||||||||
| \textAl ii | 11.70(0.02) | \textAl ii | 11.61(0.04) | ||||||||
| \textFe ii | 11.82(0.02) | \textFe ii | 12.58(0.04) | ||||||||
| \textMg ii | 12.59(0.01) | \textMg ii | 12.64(0.04) | ||||||||
| 5 | 1.838326 | 61 | 5.9(0.2) | \textSi ii | 12.49(0.03) | \textMg i | 11.01(0.02) | ||||
| \textC ii | 13.24(0.05) | 10 | 1.839249 | 37 | 2.0(0.3) | \textSi ii | 12.46(0.03) | ||||
| \textAl ii | 11.46(0.03) | \textO i | 13.34(0.11) | ||||||||
| \textFe ii | 11.67(0.02) | \textC ii | 13.12(0.04) | ||||||||
| \textMg ii | 12.30(0.02) | \textAl ii | 11.20(0.03) | ||||||||
| 6 | 1.838542 | 38 | 6.0(0.1) | \textSi ii | 13.37(0.01) | \textFe ii | 12.20(0.04) | ||||
| \textO i | 13.77(0.02) | \textMg ii | 12.36(0.04) | ||||||||
| \textS ii | 13.13(0.10) | \textMg i | 10.88(0.03) | ||||||||
| \textC ii | 14.60(0.08) | 11 | 1.839334 | 46 | 5.2(0.1) | \textSi ii | 12.48(0.03) | ||||
| \textAl ii | 12.29(0.08) | \textO i | 13.30(0.10) | ||||||||
| \textFe ii | 12.83(0.01) | \textC ii | 13.29(0.03) | ||||||||
| \textMg ii | 13.58(0.06) | \textAl ii | 11.50(0.02) | ||||||||
| \textMg i | 11.29(0.02) | \textFe ii | 11.97(0.02) | ||||||||
| 7 | 1.838712 | 20 | 8.0(0.3) | \textSi ii | 13.19(0.01) | \textMg ii | 12.40(0.01) | ||||
| \textO i | 13.83(0.02) | ||||||||||
| \textS ii | 13.19(0.15) | ||||||||||
| \textC ii | 13.99(0.06) | ||||||||||
| \textAl ii | 12.10(0.08) | ||||||||||
| \textFe ii | 12.64(0.01) | ||||||||||
| \textMg ii | 13.08(0.02) | ||||||||||
| \textMg i | 10.97(0.02) | ||||||||||
| Intermediate-ion transitions | |||||||||||
| 1 | 1.838240 | 70 | 13.0(1.4) | \textAl iii | 11.75(0.04) | 3 | 1.838865 | 4 | 14.5(1.2) | \textAl iii | 11.82(0.04) |
| 2 | 1.838574 | 35 | 14.9(1.3) | \textAl iii | 11.99(0.03) | ||||||
| High-ion transitions | |||||||||||
| 1 | 1.837500 | 148 | 10.5(0.4) | \textSi iv | 12.59(0.02) | 4 | 1.838591 | 33 | 14.5(0.2) | \textSi iv | 13.34(0.03) |
| 1.837485 | 150 | 9.2(0.2) | \textC iv | 12.86(0.03) | 1.838570 | 35 | 16.0(0.2) | \textC iv | 13.45(0.02) | ||
| 2 | 1.837715 | 125 | 8.5(0.1) | \textSi iv | 13.02(0.02) | 5 | 1.838942 | 4 | 15.6(0.2) | \textSi iv | 13.13(0.04) |
| 1.837718 | 125 | 12.1(0.1) | \textC iv | 13.41(0.02) | 1.838970 | 7 | 14.7(0.1) | \textC iv | 13.76(0.03) | ||
| 3 | 1.838210 | 73 | 15.5(0.2) | \textSi iv | 13.22(0.12) | 6 | 1.839337 | 46 | 9.2(0.4) | \textSi iv | 12.40(0.02) |
| 1.838176 | 77 | 20.7(0.2) | \textC iv | 13.62(0.08) | 1.839365 | 49 | 17.6(0.8) | \textC iv | 12.67(0.03) | ||
∗ Velocity relative to
3 Ionic Column Densities
In this Section we present the ionic column density measurements of the 12 detected sub-DLA systems and 1 borderline case between the DLA and sub-DLA systems. All of the column densities of the metal species were derived with the Voigt profile fitting technique. This technique consists in fitting theoretical Voigt profiles to the observed absorption metal lines well described as a complex of components, each defined by a redshift , a Doppler parameter , a column density and the corresponding errors. The fits were performed using a minimization routine fitlyman in MIDAS (Fontana & Ballester 1995).
We assumed that all of the metal species with similar ionization potentials can be fitted using identical component fitting parameters, i.e. the same (which means that macroturbulent motions dominate over thermal broadening) and the same in the same component, and allowing for variations from metal species to metal species in only. We distinguish three categories of metal species with similar ionization potentials: the low-ion transitions (i.e. the neutral and singly ionized species), the intermediate-ion transitions (e.g. \textFe iii, \textAl iii) and the high-ion transitions (e.g. \textC iv, \textSi iv). By using relatively strong lines (but not saturated) to fix the component fitting parameters (the and values for each component), we then obtain excellent fit results even for weak metal lines and for metal lines in the Ly forest where the probability of blending is high, by allowing only the column density to vary. For all of the analysed systems exhibiting multicomponent velocity structures, we had a sufficient number of relatively strong metal lines to constrain well the fitting parameters.
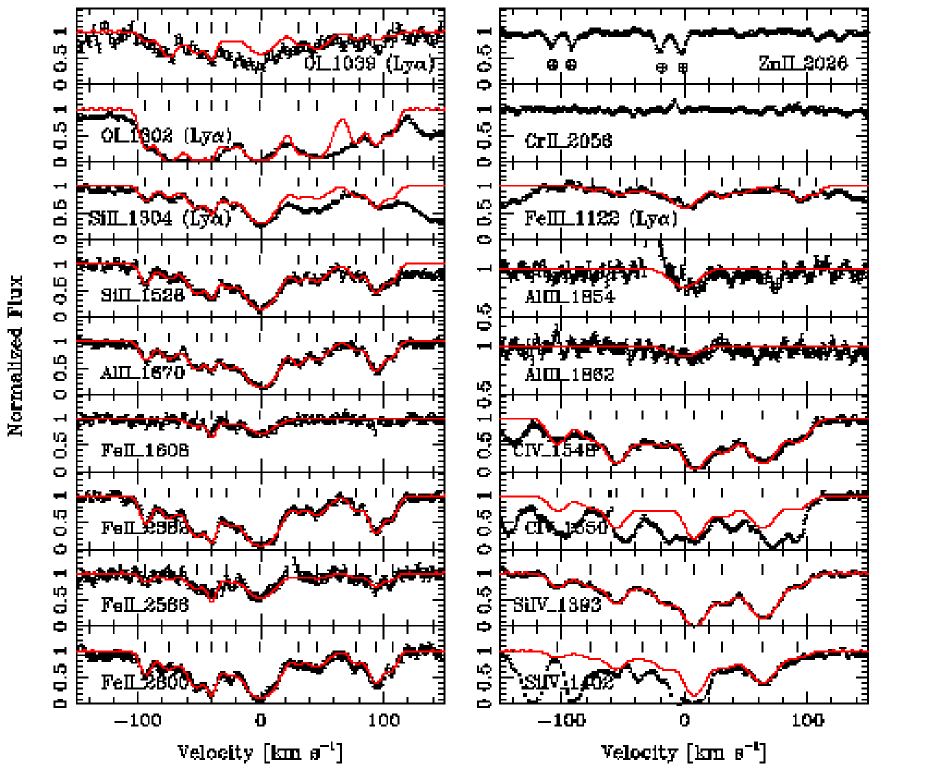
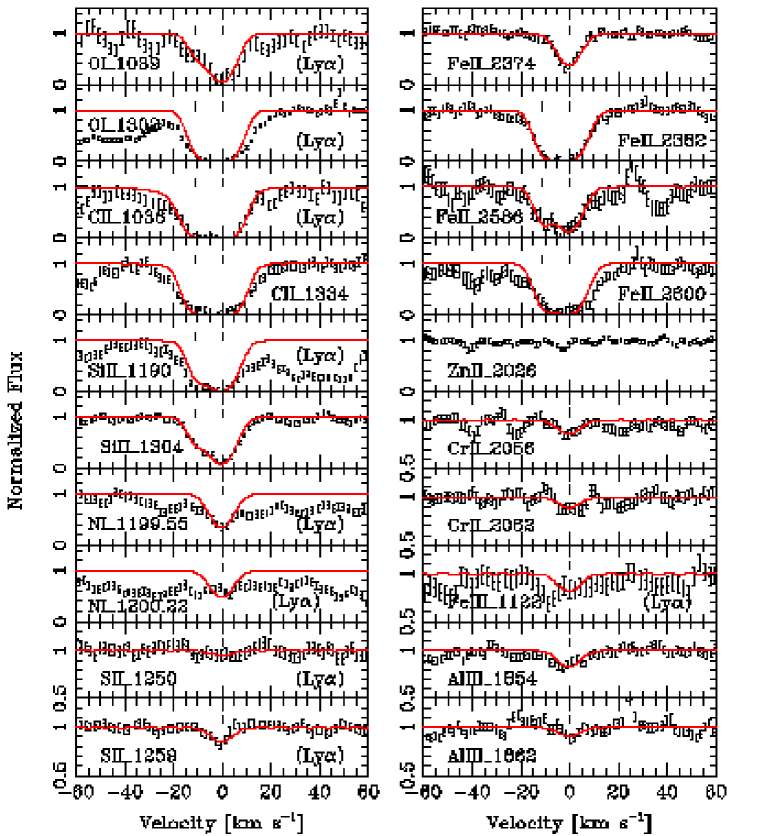
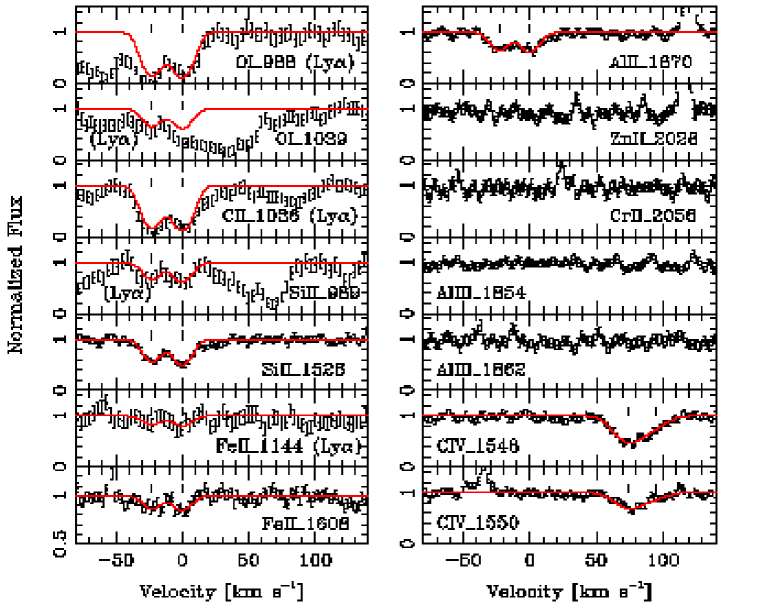
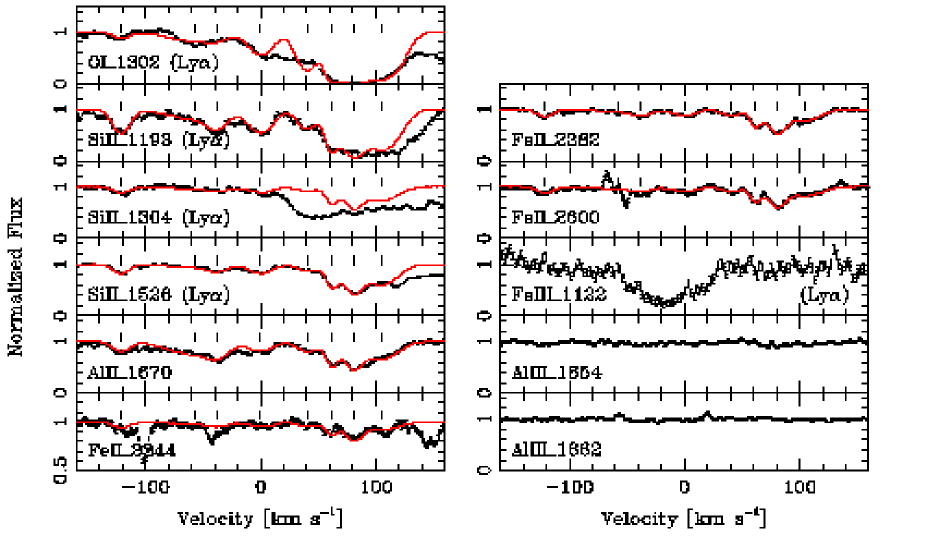
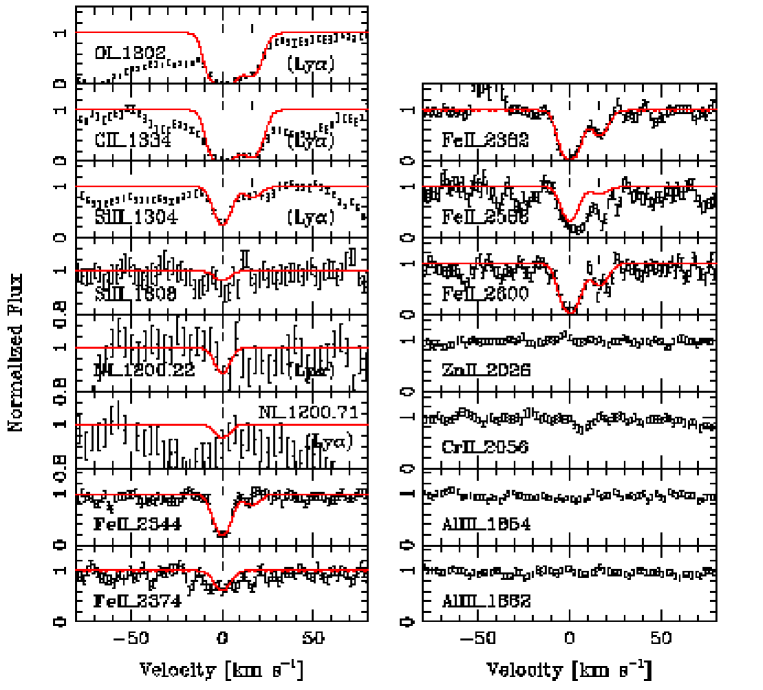
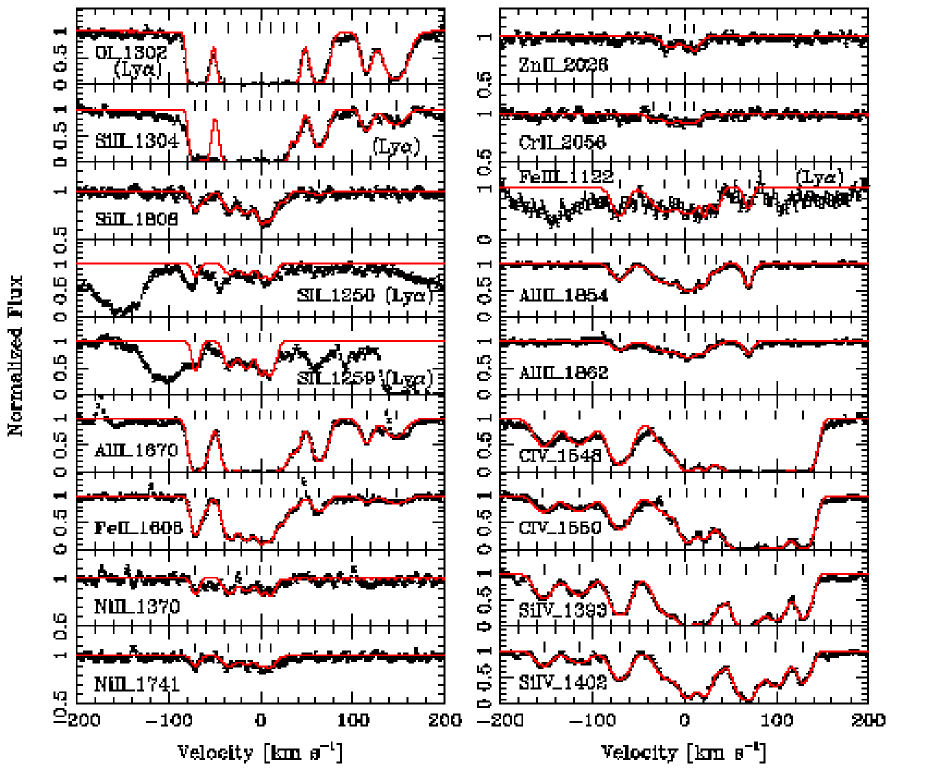
Tables 214 present the results of the component per component ionic column density measurements for the fitting model solutions of the low-, intermediate- and high-ion transitions for all of the analysed systems. The reported errors are the 1 errors computed by fitlyman. These errors do not take into account the uncertainties on the continuum level determination. For the saturated components, the column densities are listed as lower limits. The values reported as upper limits correspond to cases contaminated by significant line blendings due to \textH i clouds in the Ly forest or telluric lines. Figs. 529 (odd numbers) show the best fitting solutions of the low-, intermediate- and high-ion transitions for all of the analysed systems. In these velocity plots, corresponds to an arbitrary component, and all the identified components are marked by small vertical bars. The thin solid line represents the best fit solution. We point out that the high-ion transitions in the bulk of sub-DLA systems present very different profiles from the low-ion transitions, whereas the intermediate-ion transitions show relatively similar profiles with small differences in the model fitting parameters. This will be discussed individually for each system in the following sub-sections.
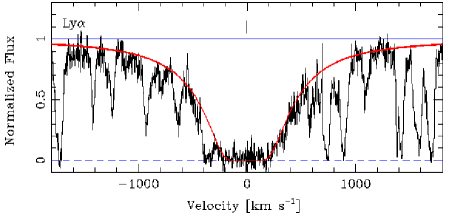
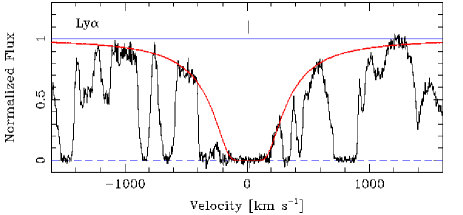
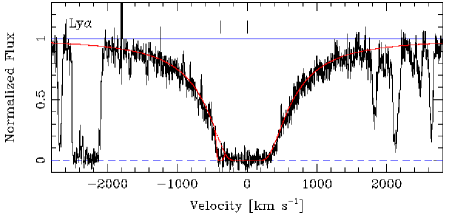
The neutral hydrogen column densities were measured from the fits of the Ly damping line profiles. The -value was usually fixed at 20 km s-1 or left as a free parameter similarly to the DLA systems the fit of the damped Ly line of sub-DLA systems is independent of the -value , and the redshift was fixed at the redshift of one of the strongest components of the low-ion metal line profiles or also left as a free parameter depending on the sub-DLA system (see the comments in the following sub-sections). When other lines of higher members of the Lyman series were covered in the spectra, we used them to check the \textH i column density obtained from the fit of the Ly line. Figs. 428 (even numbers) show the results of the \textH i fitting solutions for all of the analysed systems. The small vertical bar corresponds to the redshift used in the best fit solution and the thin solid line represents the best fit solution. In one case, the sub-DLA at towards Q1451+123, the Ly line is not covered in the available spectra, thus the \textH i column density measurement was performed using the Ly, Ly and Ly8 lines, the other members of the Lyman series being heavily blended.
Throughout the analysis we have adopted the list of the atomic data laboratory wavelengths and oscillator strengths compiled by J. X. Prochaska and collaborators, and presented on the web site “The HIRES Damped Ly Abundance Database”111http://kingpin.ucsd.edu/hiresdla/. The most recent measurements of the and -values of the metal-ions that impact the abundances of high-redshift absorption systems and their references are reported there.
We now comment on the individual sub-DLA systems.
3.1 APM BR J03074945
The spectra of this quasar (Storrie-Lombardi et al. 2001) as well as the chemical abundances of one of the highest redshifted damped Ly system discovered by Péroux et al. (2001) have been analyzed in detail by Dessauges-Zavadsky et al. (2001a). Given the high redshift of this quasar () several intervening sub-DLA systems are expected. Three candidates at 3.356, 3.589 and 4.214 have been detected. However, the high density of absorption lines in the Ly forest of such distant objects makes the blends of several absorption clouds very likely to occur. The lines of higher members of the Lyman series are necessary to distinguish blends of clouds from high \textH i column density absorbers. As discussed below, none of the three sub-DLA candidates can be confirmed in the considered spectra and they probably never will be. They thus are not included in any of our further analysis (this paper and Paper II).
For the two candidates at lower redshifts, 3.356 and 3.589, we do not have any information on the higher members of the Lyman series, these lines being beyond the quasar flux cut-off. Moreover, for the system at no associated metal lines are observed. Thus, since the Ly absorption lines of these two candidates do not show clearly any damping wing and since they can be fitted with one single system with (\textH i) cm-2 as well as with several clouds of lower \textH i column densities, the identification of these sub-DLA candidates is doubtful, and we choose to consider these two detected absorption line systems as unlikely sub-DLAs.
Several metal lines (\textC ii, \textC iii, \textC iv, \textSi ii, \textSi iii, \textSi iv, \textN iii, \textAl iii) and the hydrogen lines Ly, Ly and Ly have been identified in the candidate at . From the metal line profiles two main sub-systems can be clearly distinguished, separated by km s-1. These two sub-systems have already been carefully analysed by Levshakov et al. (2003). From their Monte Carlo Inversion analysis they determined the \textH i column densities of and cm-2 in the bluest and reddest sub-systems, respectively, corresponding to values characterizing the class of the Lyman limit absorbers. Although these recovered values are self-consistent, they are not necessarily a unique solution. Indeed, the (\textH i) measurement in the reddest system is well constrained by the three observed hydrogen lines. However, all of the three hydrogen lines in the bluest system are highly blended, hence the real (\textH i) value may be higher and can possibly be above the sub-DLA (\textH i) definition threshold. Given this uncertainty, we prefer again to consider this absorption line system only as a sub-DLA candidate.
| No | Ion | No | Ion | ||||||||
| km s-1 | km s-1 | cm-2 | km s-1 | km s-1 | cm-2 | ||||||
| Low- and intermediate-ion transitions | |||||||||||
| 1 | 2.556532 | 93 | 4.8(0.5) | \textSi ii | 13.03(0.04) | 7 | 2.558001 | 30 | 4.6(0.7) | \textSi ii | 12.79(0.03) |
| \textO i | \textO i | ||||||||||
| \textAl ii | 11.80(0.03) | \textAl ii | 11.83(0.05) | ||||||||
| \textFe ii | 12.62(0.02) | \textFe ii | 12.09(0.10) | ||||||||
| 2 | 2.556755 | 75 | 8.3(0.5) | \textSi ii | 13.02(0.04) | \textFe iii | 13.16(0.15) | ||||
| \textO i | 8 | 2.558186 | 46 | 11.1(1.1) | \textSi ii | 13.21(0.03) | |||||
| \textAl ii | 11.90(0.03) | \textO i | |||||||||
| \textFe ii | 12.64(0.02) | \textAl ii | 12.04(0.04) | ||||||||
| \textFe iii | 12.89(0.14) | \textFe ii | 12.65(0.03) | ||||||||
| 3 | 2.557023 | 52 | 8.8(0.8) | \textSi ii | 13.45(0.01) | \textFe iii | 13.24(0.13) | ||||
| \textO i | 9 | 2.558559 | 77 | 5.6(2.0) | \textSi ii | 12.91(0.04) | |||||
| \textAl ii | 12.19(0.02) | \textO i | |||||||||
| \textFe ii | 13.09(0.03) | \textAl ii | 11.44(0.12) | ||||||||
| \textFe iii | 13.28(0.13) | \textFe ii | 12.32(0.08) | ||||||||
| 4 | 2.557174 | 39 | 2.6(0.3) | \textSi ii | 13.27(0.02) | \textFe iii | 12.83(0.14) | ||||
| \textO i | 10 | 2.558752 | 94 | 6.1(1.0) | \textSi ii | 13.32(0.02) | |||||
| \textAl ii | 11.89(0.04) | \textO i | |||||||||
| \textFe ii | 13.16(0.05) | \textAl ii | 12.15(0.05) | ||||||||
| \textFe iii | 12.40(0.07) | \textFe ii | 12.90(0.04) | ||||||||
| 5 | 2.557317 | 27 | 7.2(0.9) | \textSi ii | 13.17(0.02) | \textFe iii | 13.39(0.14) | ||||
| \textO i | 11 | 2.558908 | 4.5(1.2) | \textSi ii | 12.93(0.05) | ||||||
| \textAl ii | 12.04(0.02) | \textO i | |||||||||
| \textFe ii | 12.67(0.04) | \textAl ii | 11.67(0.11) | ||||||||
| \textFe iii | 13.03(0.14) | \textFe ii | 12.46(0.09) | ||||||||
| 6 | 2.557640 | 0 | 14.8(0.3) | \textSi ii | 14.00(0.01) | \textFe iii | 13.08(0.15) | ||||
| \textO i | |||||||||||
| \textAl ii | 12.85(0.01) | ||||||||||
| \textFe ii | 13.56(0.01) | ||||||||||
| \textFe iii | 13.94(0.12) | ||||||||||
| \textAl iii | 12.32(0.13) | ||||||||||
| High-ion transitions | |||||||||||
| 1 | 2.556414 | 103 | 8.8(1.0) | \textSi iv | 12.43(0.03) | 6 | 2.557734 | 8 | 8.9(0.2) | \textSi iv | 13.53(0.01) |
| \textC iv | 13.15(0.12) | \textC iv | 13.84(0.02) | ||||||||
| 2 | 2.556744 | 75 | 12.5(1.1) | \textSi iv | 12.57(0.03) | 7 | 2.558007 | 31 | 13.7(0.9) | \textSi iv | 13.04(0.03) |
| \textC iv | 13.18(0.12) | \textC iv | 13.52(0.03) | ||||||||
| 3 | 2.556981 | 56 | 8.6(0.6) | \textSi iv | 12.83(0.05) | 8 | 2.558402 | 64 | 13.0(0.2) | \textSi iv | 13.37(0.01) |
| \textC iv | 13.56(0.04) | \textC iv | 13.75(0.01) | ||||||||
| 4 | 2.557225 | 35 | 16.1(2.9) | \textSi iv | 12.70(0.08) | 9 | 2.558732 | 92 | 11.2(1.1) | \textSi iv | 12.48(0.03) |
| \textC iv | 13.37(0.08) | \textC iv | 13.18(0.02) | ||||||||
| 5 | 2.557476 | 14 | 10.2(0.5) | \textSi iv | 12.92(0.03) | ||||||
| \textC iv | 13.14(0.07) | ||||||||||
∗ Velocity relative to
3.2 Q1101264,
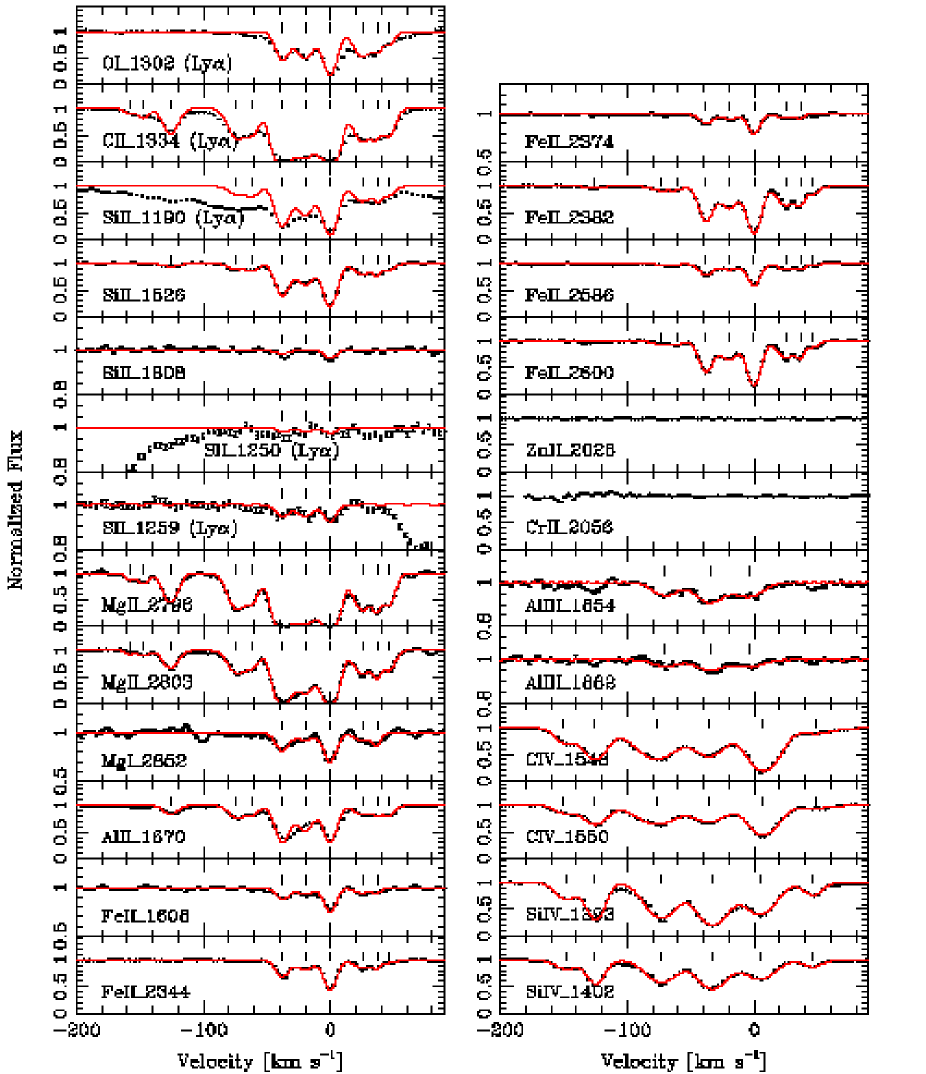
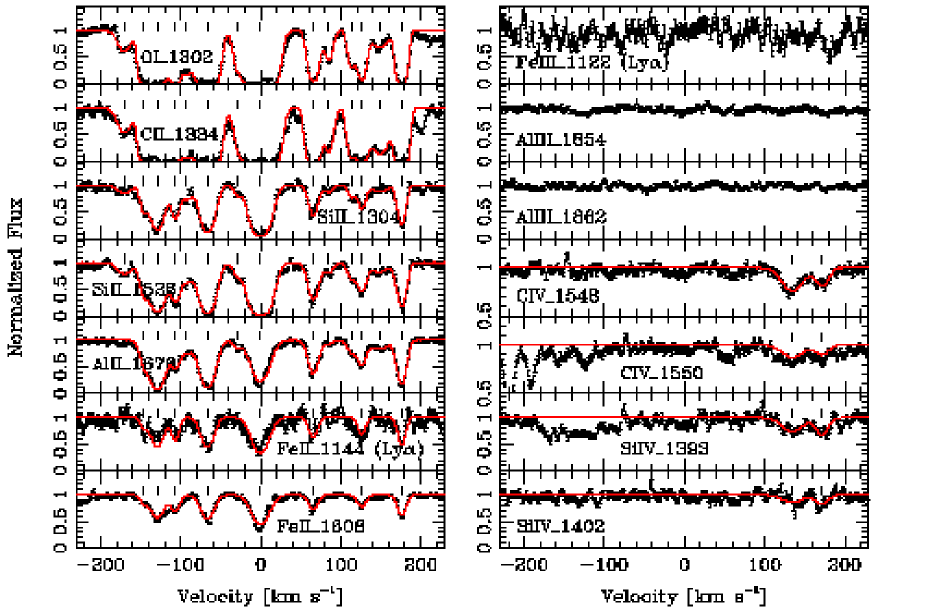
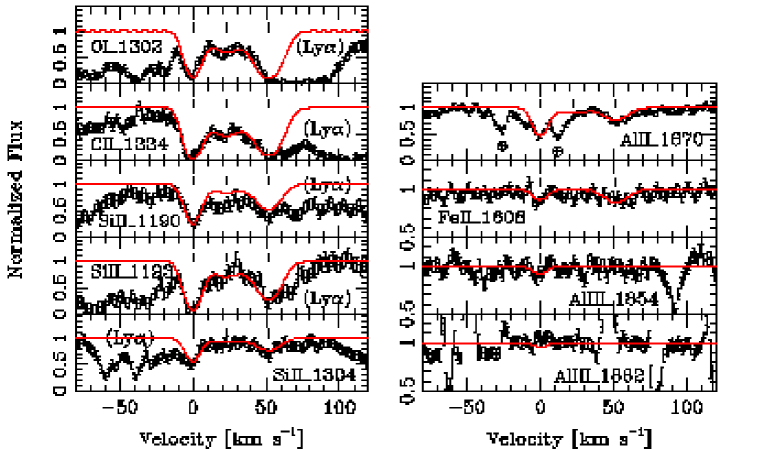
This quasar has been observed as part of the UVES Science Verification programme for the study of the Ly forest (see Kim, Cristiani & D’Odorico 2002). It has previously been observed and analysed at lower resolution, and the absorption line system at we are interested in has already been identified (e.g. Carswell et al. 1984). Thanks to the large amount of UVES observing time devoted to this quasar, the spectra show an extremely high S/N. The quality of the data allowed us to measure with high accuracy the column densities of 11 ions and 7 elements (Si, O, S, C, Al, Fe, Mg) in the sub-DLA system at observed in this line-of-sight. 4 upper limits on the column densities of \textZn ii and \textCr ii have been provided, since these lines are not detected in the spectra. Only the hydrogen line, Ly, is observed in the available spectral coverage, but the absence of contamination and the presence of well defined damping wings lead to a very reliable (\textH i) measurement of obtained by leaving the redshift and the -value as free parameters (see Fig. 4). This absorber has already been studied by Petitjean, Srianand & Ledoux (2000) with regards to its molecular content. We confirm their \textH i column density measurement and their [Fe/H]222[X/H] [(X)/(H)] [(X)/(H)]⊙. and [S/H] abundance measurements.
The component structure of this absorber is presented in Table 2 for the low-, intermediate- and high-ion transitions. The low-ion profiles are described with a relatively complex structure of 11 components extended over km s-1, while the high-ion transitions are well fitted with only 6 components (see Fig. 5). This difference in the line profiles suggests that the low- and high-ion lines are not emitted from the same physical region, which is a commonly observed situation in DLAs. Nevertheless, in this particular case, surprisingly the lines of C+++ and Si+++, two ions with the same ionization degree, do not show the same line profiles and require slightly different fitting parameters (, and ). In addition, the \textAl iii lines better resemble the high-ion transition profiles than the low-ion ones, contrary to what is usually observed in DLA studies where the intermediate-ion line profiles are very similar to the low-ion line profiles, indicating they are emitted from the same physical region. Unfortunately, no other intermediate-ion is detected in this sub-DLA system to confirm these observations.
3.3 Q1223+1753,
This quasar, also called LBQS 1223+1753, was discovered by Foltz et al. (1987) and it has been observed on many occasions for the study of its intervening DLA system at . The large \textH i column density of this absorber allows the analysis of a great number of transitions (over 20) as well as of the H2 molecule (e.g. Pettini et al. 1994; Centurión et al. 2000; Petitjean, Srianand & Ledoux 2000; Ellison, Ryan & Prochaska 2001; Prochaska et al. 2001). In addition to this DLA, we identified a sub-DLA system at with a (\textH i) of , and we present here for the first time its chemical analysis.
This sub-DLA system was identified thanks to its Ly absorption line, the only hydrogen line observed in the available spectra. This line shows a well defined blue damping wing, but the red damping wing is partially blended with \textH i clouds (see Fig. 6). The \textH i column density measurement was hampered by an additional difficulty, the location of the sub-DLA Ly line in the red wing of the DLA Ly line. Therefore, we first had to locally renormalize the quasar spectrum with the fit of the DLA Ly damping wing profile, before measuring the (\textH i) of the sub-DLA by fixing the redshift at the position of the strongest component of the metal line profiles (the component 6). The error on the derived hydrogen column density was estimated by varying the continuum level by 5%.
As shown in Fig. 7 the low-ion transitions of the sub-DLA system present a complex velocity structure composed of 11 components spread over km s-1 (see Table 3). The numerous Fe+ lines identified in the system (\textFe ii 1608,2382,2586,2600) allowed to obtain a very accurate (\textFe ii) measurement. We also provide measurements of the \textSi ii and \textAl ii column densities. To be conservative, we prefer to consider the measured (\textO i) obtained from the \textO i 1039,1302 lines located in the Ly forest as an upper limit. The \textZn ii and \textCr ii lines are not detected in the spectra, we provide 4 upper limits. The \textC ii lines are highly saturated.
| No | Ion | ||||
| km s-1 | km s-1 | cm-2 | |||
| Low- and intermediate-ion transitions | |||||
| 1 | 2.668092 | 11 | 2.1(0.9) | \textSi ii | 13.32(0.04) |
| \textO i | 14.24(0.15) | ||||
| \textC ii | |||||
| \textFe ii | 13.63(0.24) | ||||
| 2 | 2.668227 | 0 | 4.8(0.4) | \textSi ii | 14.06(0.03) |
| \textO i | 15.27(0.11) | ||||
| \textC ii | |||||
| \textS ii | 13.54(0.06) | ||||
| \textN i | |||||
| \textCr ii | 12.49(0.15) | ||||
| \textFe ii | 13.79(0.05) | ||||
| \textFe iii | 13.17(0.12) | ||||
| \textAl iii | 11.89(0.05) | ||||
∗ Velocity relative to
In addition, we observe the \textC iv and \textSi iv high-ion transitions showing in this case very similar line profiles to the low-ion transitions. The \textC iv 1550 and \textSi iv 1402 lines are blended with the metal lines of other absorbers (see Fig. 7). We also detect the \textAl iii and \textFe iii intermediate-ion transitions. The intermediate-ion column density determination, in particular the one of Fe++, is crucial for the estimation of the ionization corrections, which may not be negligible in this low \textH i column density system (see Section 4). Since the \textAl iii lines are weak and the \textFe iii line is in the Ly forest where blends with \textH i clouds are possible, we cannot determine with high accuracy whether the intermediate-ion profiles present differences with respect to the low-ion profiles in this sub-DLA system. Thus, as the \textAl iii lines show a single velocity component located exactly at the redshift of the strongest component of the low-ion line profiles, the component 6, we assume that we can adopt the same fitting parameters for the intermediate-ion transitions as the ones defined for the low-ion transitions.
3.4 Q1409+095,
Discovered by Hazard et al. (1986), this quasar has first been studied at low resolution by Lanzetta et al. (1991) and then by e.g. Lu et al. (1993). They reported the identification of a DLA system at and another absorption line system at with a \textH i column density below the DLA definition corresponding to a sub-DLA system. Pettini et al. (2002) studied these two systems at high resolution and obtained the abundance measurements of O, Si, N and Fe. We identified the sub-DLA system in the UVES spectra thanks to the Ly absorption line with clearly visible damping wings (see Fig. 8), and derived a \textH i column density of (\textH i) in agreement with the Pettini et al. measurement.
| No | Ion | No | Ion | ||||||||
| km s-1 | km s-1 | cm-2 | km s-1 | km s-1 | cm-2 | ||||||
| Low-ion transitions | |||||||||||
| 1 | 2.085060 | 170 | 10.9(1.0) | \textSi ii | 12.98(0.06) | 8 | 2.086808 | 0 | 13.3(0.2) | \textSi ii | 14.37(0.01) |
| \textO i | 13.75(0.04) | \textO i | |||||||||
| \textC ii | 13.44(0.03) | \textC ii | |||||||||
| 2 | 2.085297 | 147 | 5.2(0.6) | \textSi ii | 13.27(0.05) | \textAl ii | 12.66(0.01) | ||||
| \textO i | \textFe ii | 13.91(0.02) | |||||||||
| \textC ii | 9 | 2.087482 | 65 | 7.1(0.2) | \textSi ii | 13.54(0.02) | |||||
| \textAl ii | 11.88(0.08) | \textO i | 14.38(0.02) | ||||||||
| \textFe ii | 12.81(0.08) | \textC ii | 14.57(0.03) | ||||||||
| 3 | 2.085481 | 129 | 10.4(0.5) | \textSi ii | 14.02(0.02) | \textAl ii | 12.27(0.02) | ||||
| \textO i | \textFe ii | 13.26(0.04) | |||||||||
| \textC ii | 10 | 2.087682 | 85 | 6.3(0.8) | \textSi ii | 12.73(0.08) | |||||
| \textAl ii | 12.81(0.02) | \textO i | 13.75(0.03) | ||||||||
| \textFe ii | 13.66(0.02) | \textC ii | 13.65(0.02) | ||||||||
| 4 | 2.085711 | 107 | 6.1(0.4) | \textSi ii | 13.53(0.02) | \textAl ii | 11.07(0.19) | ||||
| \textO i | 14.59(0.25) | 11 | 2.087973 | 113 | 5.6(0.4) | \textSi ii | 12.92(0.05) | ||||
| \textC ii | \textO i | 13.86(0.04) | |||||||||
| \textAl ii | 12.06(0.05) | \textC ii | 13.82(0.03) | ||||||||
| \textFe ii | 13.28(0.03) | \textAl ii | 11.61(0.07) | ||||||||
| 5 | 2.085857 | 92 | 8.5(3.2) | \textSi ii | 13.16(0.12) | 12 | 2.088111 | 127 | 6.1(0.4) | \textSi ii | 13.30(0.03) |
| \textO i | 14.20(0.12) | \textO i | 14.24(0.02) | ||||||||
| \textC ii | \textC ii | 14.32(0.21) | |||||||||
| \textAl ii | 11.75(0.12) | \textAl ii | 12.01(0.04) | ||||||||
| 6 | 2.086125 | 66 | 10.2(0.4) | \textSi ii | 14.09(0.03) | \textFe ii | 13.13(0.05) | ||||
| \textO i | 13 | 2.088333 | 148 | 13.8(2.0) | \textSi ii | 12.97(0.06) | |||||
| \textC ii | \textO i | 13.75(0.05) | |||||||||
| \textAl ii | 12.75(0.02) | \textC ii | 14.03(0.10) | ||||||||
| \textFe ii | 13.67(0.02) | \textAl ii | 11.75(0.07) | ||||||||
| 7 | 2.086501 | 30 | 6.0(1.3) | \textSi ii | 12.81(0.07) | 14 | 2.088617 | 176 | 6.0(0.2) | \textSi ii | 13.66(0.02) |
| \textO i | 13.85(0.22) | \textO i | 14.69(0.04) | ||||||||
| \textC ii | 13.33(0.18) | \textC ii | |||||||||
| \textAl ii | 11.36(0.11) | \textAl ii | 12.48(0.02) | ||||||||
| \textFe ii | 13.40(0.02) | ||||||||||
| High-ion transitions | |||||||||||
| 1 | 2.088197 | 135 | 17.5(1.8) | \textSi iv | 12.69(0.04) | 2 | 2.088584 | 173 | 10.4(1.1) | \textSi iv | 12.58(0.04) |
| \textC iv | 13.05(0.04) | \textC iv | 12.72(0.07) | ||||||||
∗ Velocity relative to
Our determinations of the \textO i, \textSi ii and \textFe ii column densities and of the \textN i upper limit are also consistent with their findings, although we obtained dex higher \textSi ii and \textFe ii column densities. This discrepancy may be explained by the fact that we used a two-component fitting model for the low-ion transitions (see Table 4), while these authors used a one-component fitting model. Indeed, weak metal lines, like the \textN i, \textS ii lines and some \textFe ii lines with low oscillator strengths, are well fitted with a single component. However, as shown in Fig. 9, the strong \textFe ii 2382,2586,2600, \textO i 1302, \textSi ii 1190 and \textC ii 1036,1334 line profiles clearly indicate the presence of a second weaker component at km s-1 bluewards of the main component. In addition to the O0, Si+, Fe+ column densities and the (\textN i) upper limit the N0 triplet being blended with the Ly forest absorptions , we obtained the column density measurements of S+ from the \textS ii 1250,1259 lines and Cr+. The \textZn ii lines are not detected, thus we provide a 4 upper limit. We also report a lower limit on (\textC ii), since the feature is saturated.
We detect the Al++ and Fe++ intermediate-ion transitions in this sub-DLA system. A single component is observed in the \textAl iii 1854 and 1862 line profiles, and it is reasonably well fitted with the low-ion transition fitting parameters (see Fig. 9). Although the fit of the \textAl iii 1854 component does not look optimal and could be shifted by a few km s-1 bluewards, when fitting simultaneously the two \textAl iii lines at and Å, the best fit solution is very similar to the low-ion transition fitting parameters. Thus, given the weak intensity of the \textAl iii and \textFe iii absorption lines and the low S/N in the spectral regions covering these lines, we preferred to adopt the same fitting parameters as the ones derived for the low-ion transition lines, and we obtained \textAl iii and marginal \textFe iii column density measurements. No high-ion transition line is observed, all of them being outside the available wavelength coverage.
3.5 Q1444+014,
The quasar Q1444+014 is found more commonly under the name LBQS 1444+0126 and was discovered by Hewett et al. (1991). Its intervening absorption system at was first reported by Wolfe et al. (1995). Pettini et al. (2002) analysed the \textH i, \textO i, \textSi ii, \textN i and \textFe ii lines of this absorber, loosely referring to it as a DLA system. We derived the \textH i column density by fitting the weakly contaminated Ly absorption line showing well defined damping wings (the redshift was left as a free parameter; see Fig. 10), and we classified the system as a sub-DLA with (\textH i) , in agreement with the Pettini et al. measurement.
The low-ion transition profiles of this sub-DLA system exhibit a very complex velocity structure with 14 components extended over km s-1 (see Table 5 and Fig. 11). We obtained column density measurements of \textSi ii, \textAl ii and \textFe ii. Only the strongest components are observed in the \textFe ii 1144,1608 line profiles. Unfortunately, several components between and km s-1 of the \textO i 1302 and \textC ii 1334 lines are saturated, thus we could only provide lower limits on the column densities of these two metal transitions. No intermediate-ion line was detected. We therefore give only the 4 upper limits on (\textAl iii) and (\textFe iii) the \textFe iii 1122 line is located in the Ly forest, but the spectral region where the strongest components of the \textFe iii line should be detected is free from important \textH i blendings, and thus we can derive a reliable 4 upper limit on (\textFe iii). A very surprising particularity observed in this system is the behaviour of the high-ion transition lines, \textC iv and \textSi iv. They are characterized by only two relatively weak components and are extended over a much narrower velocity range of km s-1 than the low-ion profiles (see Table 5 and Fig. 11). Most of the DLA systems show the opposite situation with the high-ion line profiles spread over a larger velocity range than the low-ion line profiles.
3.6 Q1451+123
The absorption line systems towards this quasar discovered by Hazard et al. (1986) have first been studied by Wolfe et al. (1986). Lanzetta et al. (1991) identified in their low-resolution spectra a DLA system at and two other absorption systems at and . Petitjean, Srianand & Ledoux (2000) studied the intervening DLA and sub-DLA at for their molecular content and report some of their elemental abundances. We present here for the first time the abundance analysis of the additional system at which is a borderline case between the DLA and sub-DLA systems.
| No | Ion | ||||
| km s-1 | km s-1 | cm-2 | |||
| Low-ion transitions | |||||
| 1 | 2.254420 | 27 | 11.5(0.6) | \textSi ii | |
| \textFe ii | 13.68(0.02) | ||||
| \textNi ii | |||||
| \textCr ii | 12.33(0.15) | ||||
| 2 | 2.254584 | 12 | 5.0(2.1) | \textSi ii | |
| \textFe ii | 13.73(0.08) | ||||
| \textNi ii | |||||
| \textZn ii | 11.49(0.15) | ||||
| \textCr ii | 12.37(0.13) | ||||
| 3 | 2.254710 | 0 | 2.8(1.4) | \textSi ii | |
| \textFe ii | 13.84(0.12) | ||||
| \textNi ii | |||||
| \textZn ii | 11.60(0.08) | ||||
| \textCr ii | 12.48(0.15) | ||||
| 4 | 2.255047 | 31 | 15.4(0.4) | \textSi ii | 13.95(0.08) |
| \textFe ii | 13.56(0.01) | ||||
| 5 | 2.255725 | 93 | 7.2(0.7) | \textSi ii | 12.56(0.21) |
| \textFe ii | 12.86(0.03) | ||||
| Intermediate-ion transitions | |||||
| 1 | 2.254395 | 29 | 18.2(3.5) | \textAl iii | 12.29(0.07) |
| 2 | 2.254675 | 3 | 5.1(0.6) | \textAl iii | 12.48(0.03) |
∗ Velocity relative to
3.6.1
This absorption metal-line system was identified thanks to the Ly absorption line observed only Å away from the blue edge of the quasar spectrum (the quasar flux cut-off is at Å). The normalization is very difficult in this region, but the limited number of Ly forest absorptions leads to a clear high \textH i column density system detection, the damping wings being well observed (see Fig. 12). We obtained a hydrogen column density measurement of (\textH i) , which shows that this absorber is a borderline case between the DLA and sub-DLA systems. A large error bar on (\textH i) was adopted to take into account the uncertainty in the continuum level. This absorption line system, although analysed in this paper, is not considered as a sub-DLA and is not included in the sub-DLA sample used for the different studies undertaken in Paper II.
| No | Ion | ||||
| km s-1 | km s-1 | cm-2 | |||
| Low-ion transitions | |||||
| 1 | 3.170795 | 23 | 8.9(1.3) | \textSi ii | 13.29(0.04) |
| \textO i | |||||
| \textC ii | 13.96(0.18) | ||||
| \textAl ii | 11.97(0.03) | ||||
| \textFe ii | 12.99(0.07) | ||||
| 2 | 3.171109 | 0 | 9.2(0.9) | \textSi ii | 13.38(0.03) |
| \textO i | |||||
| \textC ii | 14.04(0.21) | ||||
| \textAl ii | 12.04(0.03) | ||||
| \textFe ii | 13.06(0.06) | ||||
| High-ion transitions | |||||
| 1 | 3.172149 | 75 | 14.3(3.0) | \textC iv | 13.39(0.14) |
| 2 | 3.172427 | 95 | 12.4(2.4) | \textC iv | 12.78(0.07) |
∗ Velocity relative to
| No | Ion | ||||
|---|---|---|---|---|---|
| km s-1 | km s-1 | cm-2 | |||
| Low-ion transitions | |||||
| 1 | 2.086977 | 121 | 9.1(0.3) | \textSi ii | 12.84(0.01) |
| \textO i | 13.14(0.03) | ||||
| \textAl ii | 11.66(0.18) | ||||
| \textFe ii | 12.14(0.02) | ||||
| 2 | 2.087631 | 57 | 30.0(3.8) | \textSi ii | 12.87(0.02) |
| \textO i | |||||
| \textAl ii | 12.29(0.13) | ||||
| \textFe ii | 12.12(0.03) | ||||
| 3 | 2.087833 | 38 | 11.4(1.0) | \textSi ii | 12.70(0.03) |
| \textO i | |||||
| \textAl ii | 11.81(0.14) | ||||
| \textFe ii | 12.05(0.04) | ||||
| 4 | 2.088223 | 0 | 13.5(0.8) | \textSi ii | 12.98(0.02) |
| \textO i | |||||
| \textAl ii | 11.78(0.14) | ||||
| \textFe ii | 12.19(0.03) | ||||
| 5 | 2.088643 | 41 | 11.1(1.0) | \textSi ii | 12.80(0.01) |
| \textO i | |||||
| \textAl ii | 11.76(0.16) | ||||
| \textFe ii | 12.12(0.03) | ||||
| 6 | 2.088861 | 62 | 5.6(0.3) | \textSi ii | 13.17(0.01) |
| \textO i | |||||
| \textAl ii | 11.99(0.13) | ||||
| \textFe ii | 12.37(0.02) | ||||
| 7 | 2.089054 | 81 | 9.7(0.5) | \textSi ii | 13.47(0.18) |
| \textO i | |||||
| \textAl ii | 12.24(0.13) | ||||
| \textFe ii | 12.73(0.03) | ||||
| 8 | 2.089310 | 106 | 17.6(1.4) | \textSi ii | 13.50(0.15) |
| \textO i | |||||
| \textAl ii | 12.22(0.13) | ||||
| \textFe ii | 12.58(0.04) | ||||
∗ Velocity relative to
Table 6 and Fig. 13 present the velocity structure of the low-ion transitions in this absorber. It is characterized by 5 components spread over km s-1. We obtained the column density measurements of Zn+, Cr+ and Fe+ from the \textFe ii 2374,2382,2600 lines. Only the strongest components, the components 1, 2 and 3, are observed in the weak \textZn ii and \textCr ii lines detected thanks to the relatively high \textH i column density of the system. Several interesting metal lines are unfortunately located in the spectral wavelength gap between 4855 and 5900 Å. The only observed Si+ line in the available spectra is the saturated \textSi ii 1304 line which is, in addition, blended with the damping red wing of the Ly line of the DLA system at . To obtain a correct lower limit we first had to renormalize the portion of the quasar spectrum around the \textSi ii line with the fit of the DLA Ly damping wing profile. The \textNi ii 1317,1370 lines located in the Ly forest are detected at the noise level and at the uncertainty level of the continuum placement. We therefore considered the measured Ni+ column density as an upper limit. The \textO i 1302, \textC ii 1334 and the \textMg ii doublet lines are also detected, but these lines are so highly saturated that no useful lower limit can be deduced.
From the higher ionization transitions, only the Al++ intermediate-ion lines and the Si+++ high-ion lines are covered in the available spectra. The \textAl iii lines clearly show slightly different profiles from the low-ion profiles, but with a very similar trend (see Fig. 13). We provide an Al++ column density measurement obtained with the fitting parameters given in Table 6. No column density measurement can be obtained from the \textSi iv doublet, since it is heavily blended with Ly forest absorptions.
3.6.2
The Ly absorption line of this sub-DLA system is outside the available spectral coverage. We identified this sub-DLA system thanks to the \textH i column density measurement reported by Petitjean, Srianand & Ledoux (2000). They estimated the hydrogen column density of this system from the equivalent width measurement by Bechtold (1994) and give (\textH i) . We confirm this value with the measurements obtained from the fits of the Ly, Ly and Ly8 lines (the redshift and the -value were left as free parameters; see Fig. 14). The other members of the Lyman series were not taken into account, being heavily blended with Ly forest absorptions.
This sub-DLA system shows a very simple velocity structure. The low-ion transition profiles are well fitted with two components (see Table 7 and Fig. 15). We obtained the column density measurements of Si+, C+, Al+ and Fe+, and confirm the Petitjean, Srianand & Ledoux (2000) [Fe/H] and [Si/H] abundance measurements. The \textC ii column density was deduced from the \textC ii 1036 line located in the Ly forest. We adopted a relatively large error on (\textC ii) to take into account possible \textH i contaminations. We observe eight \textO i lines in the available spectra, but the bulk of them are heavily blended with Ly forest absorptions. Only the \textO i 988,1039 lines allowed us to obtain a significant upper limit on (\textO i). The \textZn ii and \textCr ii lines are not detected in the spectra, thus we provide only 4 upper limits. No column density measurement of intermediate-ion transitions was obtained. The \textFe iii 1122 line is heavily blended in the Ly forest, and the \textAl iii lines are not detected, hence only a 4 upper limit was derived.
Similarly to the sub-DLA system at towards Q1444+014, the \textC iv high-ion transition lines observed in this sub-DLA show a peculiar behaviour. They are shifted by km s-1 redwards of the low-ion transition lines. Although such a velocity difference between low- and high-ion lines is also observed in some DLA absorbers (Ledoux et al. 1998), in this particular case, the low- and the high-ion profiles do not overlap at all in velocity space (see Table 7 and Fig. 15). This could suggest that the \textC iv lines are not associated with the studied sub-DLA system. Under this assumption, it may mean that another metal-line system at km s-1 is blended with the absorber associated with the low-ion transitions. However, this situation seems unlikely, since we should then observe the absorption lines of higher members of the Lyman series breaking into two components. A weak emission feature is observed at km s-1 in the Ly8 line (see Figure 14) and it may cast some doubt on the previous statement. However, given the low quality of the data, it is difficult to determine with confidence whether this feature is real or just noise. Indeed, the feature is detected at less than 2 in the Ly8 line which is observed less than 15 Å away from the blue edge of the quasar spectrum (the quasar flux cut-off is at Å), where the signal-to-noise ratio is very low (only FWHM). Therefore, with the available data we assume that the analysis of this absorption line system presented here is correct. However, we advise the reader that higher S/N spectra in the blue are required to determine whether the observed emission feature in the Ly8 line is real or not, since it will then imply a revision of the \textH i column density measurement in this absorber. If in the end this system is not a sub-DLA, it has no impact on our unbiased sample of sub-DLAs and on the statistical work presented in Paper II, since due to the non-observation of the Ly line in this system, it was excluded from the sample of sub-DLAs used for the statistical work (see Section 2.3).
3.7 Q1511+090,
The absorption line systems towards this quasar were first analysed by Sargent, Steidel & Boksenberg (1988). But, the sub-DLA system at has never been previously studied, nor reported in the literature. It has been identified thanks to the Ly absorption line, the only hydrogen line observed in the available spectra. The blue damping wing of the Ly line is blended with other \textH i clouds, and only the outer parts of the blue wing are visible. The red damping wing is on the contrary relatively well constrained and can be used to determine the hydrogen column density of the system (see Fig. 16). By fixing the -value at 20 km s-1 and by leaving the redshift as a free parameter, we obtained a \textH i column density of (\textH i) as the best fit solution for the Ly line. The derived redshift at is located between the components 4 and 5 of the low-ion transition profiles.
Table 8 and Fig. 17 present the velocity structure of this sub-DLA system. The low-ion transition lines are well described by 8 components extended over a large velocity interval of km s-1. All the metal lines with rest-wavelengths up to Å are located in the Ly forest, thus the column density determinations of a large number of elements have to be done with caution. We obtained the column density measurements of \textSi ii, \textAl ii and \textFe ii. The access to the strong \textFe ii 2344,2382,2600 transitions allowed us to measure accurately (\textFe ii) of this rather low metallicity system, [Fe/H] . The \textO i 1302 line is blended with Ly forest lines, thus no reliable column density measurement can be determined, and we choose to consider the derived value as an upper limit. The case of the \textC ii 1334 line is even more difficult. The saturation of the line together with the strong blending, makes impossible the estimation of the column density of C+. The Al++ and Fe++ intermediate-ion transition lines are not detected, hence we provide only 4 upper limits on (\textAl iii) and (\textFe iii) the \textFe iii 1122 line is located in the Ly forest, but the spectral region where the strongest components of the \textFe iii line should be detected is free from \textH i blendings, and thus we can derive a reliable 4 upper limit on (\textFe iii). The observed high-ion transition lines, the \textC iv and \textSi iv doublets, are all heavily blended with Ly forest lines preventing us from measuring their column densities.
| No | Ion | ||||
|---|---|---|---|---|---|
| km s-1 | km s-1 | cm-2 | |||
| Low-ion transitions | |||||
| 1 | 2.507341 | 0 | 4.9(0.2) | \textSi ii | 13.66(0.08) |
| \textO i | 15.52(0.21) | ||||
| \textC ii | 14.82(0.21) | ||||
| \textN i | 12.66(0.18) | ||||
| \textFe ii | 13.41(0.03) | ||||
| 2 | 2.507535 | 17 | 5.3(0.8) | \textSi ii | 12.91(0.25) |
| \textO i | 14.11(0.13) | ||||
| \textC ii | 13.87(0.15) | ||||
| \textFe ii | 12.59(0.04) | ||||
∗ Velocity relative to
3.8 Q2059360,
The quasar Q1451+123 was discovered by Warren, Hewett & Osmer (1991), and it has been studied for its intervening DLA system at . The molecular content of this DLA has been analysed by Petitjean, Srianand & Ledoux (2000). We have found in the spectra of Q2059360 an additional high hydrogen column density absorption line system, a sub-DLA at . It has been identified thanks to the Ly absorption line which shows well defined damping wings (see Fig. 18). No other hydrogen line is observed in the available spectra. The fit of the Ly line was performed by fixing the -value at 20 km s-1 and the redshift at the redshift of the strongest component of the low-ion transition lines, the component 1. The derived \textH i column density is (\textH i) .
The low-ion transition profiles are characterized by a simple velocity structure composed of two components (see Table 9 and Fig. 19). In the weaker lines, only the strongest component at is observed. We obtained an accurate Fe+ column density measurement thanks to the numerous observed \textFe ii lines at , 2374, 2382, 2586 and 2600, and despite the fact that the reddest parts of the available spectra at Å are noisy with a S/N per pixel lower than 10. The observed \textSi ii 1304, \textO i 1302 and \textC ii 1334 lines are all located in the Ly forest. Large errors have been adopted on their column density measurements to take into account possible Ly contaminations. In the case of Si+, we could constrain the column density of the strongest component with the \textSi ii 1808 line located outside the Ly forest. However, the derived O0 and C+ column density measurements might be considered as borderline cases between values and limits. We also obtained a column density measurement of N0 from the \textN i 1200.223,1200.710 lines, the \textN i 1199.550 line being blended. This measurement is marginal, since the detected \textN i lines are extremely weak, at the limit of the noise level. The \textZn ii and \textCr ii lines are not detected despite the relatively high \textH i column density of the system, thus we provide 4 upper limits. We also give the 4 upper limit on the Al++ intermediate-ion transition column density, the \textAl iii lines being not detected. No high-ion transition column density has been measured, since the \textSi iv lines are heavily blended with Ly forest absorptions and the \textC iv lines are not covered in the available spectra.
3.9 Q2116358,
The quasar Q2116358 was discovered by Adam (1985). Its intervening absorption metal-line system at has previously been reported by Lanzetta, Wolfe & Turnshek (1987), Wampler, Bergeron & Petitjean (1993), Møller, Jakobsen & Perryman (1994), and it has even been targeted in an imaging programme by Warren et al. (2001). In this paper we provide a new complete abundance analysis of this system using the UVES high-resolution spectra.
| No | Ion | No | Ion | ||||||||
| km s-1 | km s-1 | cm-2 | km s-1 | km s-1 | cm-2 | ||||||
| Low-ion transitions | |||||||||||
| 1 | 1.995416 | 70 | 5.0(0.8) | \textSi ii | 14.39(0.07) | 6 | 1.996224 | 10 | 7.5(2.6) | \textSi ii | 14.71(0.14) |
| \textO i | \textO i | ||||||||||
| \textS ii | \textS ii | ||||||||||
| \textAl ii | 13.29(0.17) | \textAl ii | |||||||||
| \textNi ii | 12.79(0.07) | \textNi ii | 12.99(0.05) | ||||||||
| \textFe ii | 13.83(0.03) | \textFe ii | 14.05(0.13) | ||||||||
| 2 | 1.995528 | 59 | 4.8(1.1) | \textSi ii | 13.93(0.18) | \textZn ii | 11.94(0.08) | ||||
| \textO i | 14.11(0.16) | \textCr ii | 12.42(0.11) | ||||||||
| \textAl ii | 12.22(0.15) | 7 | 1.996373 | 25 | 5.5(1.8) | \textSi ii | 14.07(0.13) | ||||
| \textFe ii | 13.06(0.19) | \textO i | |||||||||
| 3 | 1.995777 | 34 | 7.2(1.3) | \textSi ii | 14.49(0.09) | \textAl ii | 12.51(0.16) | ||||
| \textO i | \textFe ii | 13.48(0.07) | |||||||||
| \textS ii | 8 | 1.996504 | 38 | 5.6(0.8) | \textSi ii | 13.50(0.05) | |||||
| \textAl ii | \textO i | 14.20(0.15) | |||||||||
| \textNi ii | 12.93(0.06) | \textAl ii | 12.17(0.03) | ||||||||
| \textFe ii | 14.00(0.08) | \textFe ii | 13.03(0.07) | ||||||||
| \textCr ii | 12.15(0.20) | 9 | 1.996759 | 64 | 9.2(0.3) | \textSi ii | 13.82(0.03) | ||||
| 4 | 1.995963 | 16 | 9.5(2.4) | \textSi ii | 14.66(0.12) | \textO i | 14.53(0.10) | ||||
| \textO i | \textAl ii | 12.56(0.01) | |||||||||
| \textS ii | \textFe ii | 13.41(0.04) | |||||||||
| \textAl ii | 10 | 1.997269 | 115 | 7.6(0.6) | \textSi ii | 13.34(0.06) | |||||
| \textNi ii | 12.95(0.06) | \textO i | 14.05(0.03) | ||||||||
| \textFe ii | 14.13(0.11) | \textAl ii | 12.06(0.03) | ||||||||
| \textZn ii | 11.96(0.08) | \textFe ii | 12.89(0.11) | ||||||||
| \textCr ii | 12.49(0.10) | 11 | 1.997586 | 147 | 13.7(0.5) | \textSi ii | 13.42(0.10) | ||||
| 5 | 1.996119 | 0 | 4.0(2.3) | \textSi ii | 14.46(0.16) | \textO i | 14.50(0.05) | ||||
| \textO i | \textAl ii | 12.12(0.15) | |||||||||
| \textS ii | \textFe ii | 13.18(0.12) | |||||||||
| \textAl ii | |||||||||||
| \textNi ii | 12.61(0.10) | ||||||||||
| \textFe ii | 13.88(0.10) | ||||||||||
| \textZn ii | 11.23(0.24) | ||||||||||
| \textCr ii | 12.07(0.20) | ||||||||||
| Intermediate-ion transitions | |||||||||||
| 1 | 1.995417 | 70 | 9.8(1.0) | \textAl iii | 12.38(0.03) | 4 | 1.996339 | 22 | 3.9(1.9) | \textAl iii | 12.10(0.20) |
| \textFe iii | \textFe iii | ||||||||||
| 2 | 1.995903 | 22 | 17.1(2.9) | \textAl iii | 12.67(0.10) | 5 | 1.996458 | 34 | 6.4(2.5) | \textAl iii | 11.87(0.11) |
| \textFe iii | \textFe iii | ||||||||||
| 3 | 1.996172 | 5 | 13.5(3.0) | \textAl iii | 12.80(0.11) | 6 | 1.996814 | 69 | 5.5(0.6) | \textAl iii | 12.40(0.02) |
| \textFe iii | \textFe iii | ||||||||||
| High-ion transitions | |||||||||||
| 1 | 1.994594 | 153 | 12.5(0.7) | \textSi iv | 12.88(0.02) | 6… | 1.996344 | 22 | 9.7(0.8) | \textSi iv | 13.53(0.03) |
| \textC iv | 13.33(0.06) | \textC iv | 13.89(0.14) | ||||||||
| 2 | 1.994974 | 115 | 16.3(1.1) | \textSi iv | 12.90(0.02) | 7… | 1.996517 | 40 | 6.4(0.8) | \textSi iv | 12.65(0.05) |
| \textC iv | 13.41(0.04) | \textC iv | 13.48(0.16) | ||||||||
| 3 | 1.995426 | 69 | 13.6(0.3) | \textSi iv | 13.29(0.01) | 8… | 1.996789 | 67 | 13.7(0.5) | \textSi iv | 13.81(0.01) |
| \textC iv | 13.80(0.02) | \textC iv | |||||||||
| 4 | 1.995957 | 16 | 17.4(1.3) | \textSi iv | 13.41(0.05) | 9… | 1.997112 | 99 | 13.2(0.5) | \textSi iv | 13.44(0.01) |
| \textC iv | 13.55(0.07) | \textC iv | |||||||||
| 5 | 1.996150 | 3 | 9.1(0.6) | \textSi iv | 13.52(0.04) | 10… | 1.997414 | 130 | 9.7(0.4) | \textSi iv | 13.22(0.02) |
| \textC iv | 13.92(0.13) | \textC iv | 14.33(0.12) | ||||||||
∗ Velocity relative to
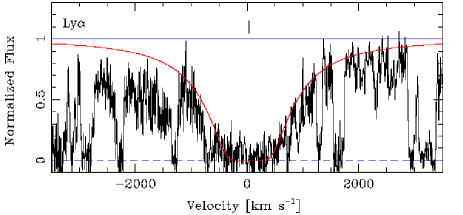
Only the hydrogen Ly line is observed in the available data. It shows well defined damping wings which allowed an accurate measurement of the \textH i column density of the system. We obtained a value of (\textH i) , lower by dex than the value reported by Møller, Jakobsen & Perryman (1994), and which indicates that the absorber is a sub-DLA system. Fig. 20 shows the best fit solution of the Ly line. The presence of an asymmetry in the profiles of the blue and red damping wings made it necessary to include, besides the contribution of the sub-DLA system, a second low column density absorption system bluewards of the sub-DLA in order to obtain a good fit of both wings of the Ly line. During the fitting procedure, the redshift and the -value of the sub-DLA system were fixed at the redshift of the component 6 of the low-ion transition lines and at 20 km s-1, respectively, and the redshift and the -value of the second absorber were left as free parameters. We obtained the best fit solution with the second absorption line system at shifted by about km s-1 from the sub-DLA system and with a \textH i column density of (\textH i) .
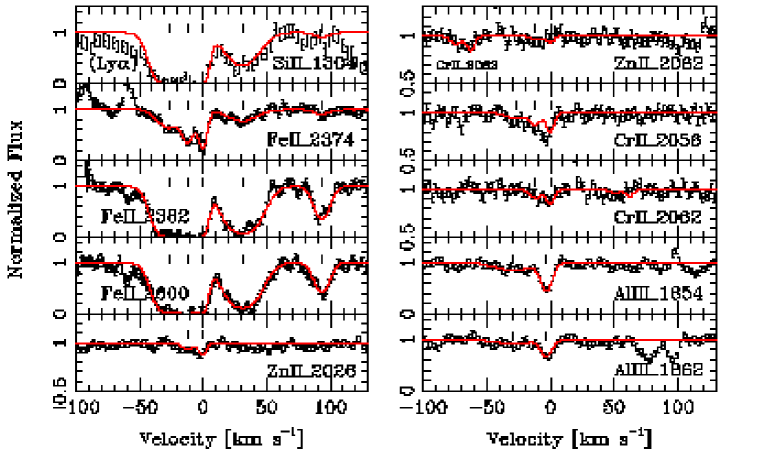
Metal lines from a wide range of ionization species are present in this sub-DLA system. Fig. 21 shows the low-, intermediate- and high-ion transition line profiles, and their velocity structures are described in Table 10. The low-ion transition lines are characterized by a relatively complex velocity structure of 11 components spread over km s-1. Only the strongest components, the components 3 to 6, are observed in the weak metal lines, such as the \textNi ii, \textCr ii and \textZn ii lines. We obtained the column density measurements of Si+, Ni+, Cr+, Zn+ and Fe+. Many components of the \textO i 1302 and \textAl ii 1670 lines are strongly saturated, while the weaker components are well matched by the model parameters defined from the \textSi ii and \textFe ii lines. Since no reliable value of the total column density of O0 and Al+ can be deduced, we provide only lower limits. We detect also the \textS ii 1250,1259 lines. But, since they are blended with Ly forest absorptions, we preferred to consider the measured S+ column density as an upper limit.
Relatively strong \textAl iii lines are observed in this sub-DLA system (see Fig. 21). These intermediate-ion transition lines show profiles which are very similar to the low-ion profiles, but need to be fitted with slightly different model parameters given in Table 10. The \textFe iii 1122 intermediate-ion line is also observed. Nevertheless, it is located in the Ly forest and is blended, therefore we provide only an upper limit on its column density. The observed high-ion transition lines are very strong and show a complex velocity structure composed of 10 components. They extend over a wider velocity range of km s-1 than the low-ion profiles (see Fig. 21). We obtained the column density measurement of \textSi iv and a lower limit on (\textC iv) two components of the \textC iv doublet are heavily saturated.
3.10 PSS J2155+1358
High signal-to-noise ratio, 5 Å resolution (FWHM) spectra of this quasar have been obtained by Péroux et al. (2001). They identified a high \textH i column density DLA system at . The metallicity of this DLA system was first reported by Dessauges-Zavadsky et al. (2001b). Here we present the chemical analysis of three newly identified sub-DLA systems at , and towards this quasar.
| No | Ion | ||||
| km s-1 | km s-1 | cm-2 | |||
| Low- and intermediate-ion transitions | |||||
| 1 | 3.141998 | 0 | 5.7(1.0) | \textSi ii | 13.36(0.06) |
| \textO i | |||||
| \textC ii | 14.05(0.20) | ||||
| \textAl ii | 12.07(0.07) | ||||
| \textFe ii | 12.77(0.20) | ||||
| \textAl iii | |||||
| 2 | 3.142313 | 23 | 14.5(2.6) | \textSi ii | 12.76(0.10) |
| \textO i | |||||
| \textC ii | |||||
| \textAl ii | 11.50(0.18) | ||||
| 3 | 3.142712 | 52 | 10.0(2.8) | \textSi ii | 13.20(0.07) |
| \textO i | |||||
| \textC ii | |||||
| \textAl ii | 11.81(0.13) | ||||
| \textFe ii | 13.04(0.18) | ||||
∗ Velocity relative to
3.10.1
This sub-DLA system has been identified thanks to the Ly absorption line. No other hydrogen lines are observed in this sub-DLA, since they are beyond the quasar flux cut-off. Its \textH i column density is thus poorly constrained, all the more since the Ly line lies in the far blue end of the quasar spectrum. Due to the high number of \textH i absorptions present in these spectral regions, the Ly damping wings are strongly blended and the continuum placement is uncertain. Fig. 22 shows the best fit solution obtained by fixing the -value at 20 km s-1 and the redshift at the redshift of the strongest component, the component 1, of the low-ion transition lines. We derived a hydrogen column density of (\textH i) .
Few metal lines were detected in this sub-DLA system, mainly because all of the lines with rest-wavelengths less than 1543 Å are located in the Ly forest. The velocity structure of the low-ion transition lines was deduced from the \textSi ii, \textO i, \textC ii, \textAl ii and \textFe ii lines, all observed in the Ly forest apart from the \textAl ii and \textFe ii lines. It is well described by three components (see Table 11 and Fig. 23). We were able to measure the column density of Si+ thanks to the detection of three \textSi ii lines at , 1193 and 1304 Å. We obtained the column density measurement of Al+ from the \textAl ii 1670 line whose velocity components are just not blended with telluric lines, which we identified with the help of the spectrum of a hot, fast rotating star observed the same night as the quasar. We deduced the Fe+ column density from the \textFe ii 1608 line. The weakness of this \textFe ii line observed in this case just above the noise level and which is usually almost saturated in the DLA systems indicates that the metallicity in this sub-DLA is low, [Fe/H] . To be conservative, we preferred to consider the derived O0 and C+ column density measurements as upper limits due to the possible blends with Ly forest lines. No intermediate-ion and high-ion transitions are observed in this sub-DLA system. We provide an upper limit on the Al++ column density obtained from the fit of the very weak feature observed in the \textAl iii 1854 line at the redshift of the strongest component of the low-ion line profiles.
3.10.2
This sub-DLA system was also identified thanks to the Ly absorption line. No other hydrogen line is observed in the available spectra. Given the high redshift of the quasar PSS J2155+1358, the Ly forest shows many absorptions, and thus it is not surprising that the damping wings of the Ly line are strongly blended. We made several fitting tests to find the best fit solution of the Ly line. The first test was done by fixing in the fitting procedure the -value at 20 km s-1 and by leaving the redshift as a free parameter. We obtained a good fit with (\textH i) , but it was not a satisfactory solution, since the deduced redshift was shifted by about 73 km s-1 bluewards of the redshift of the single component observed in the low-ion transition lines. The second and adopted test was made by fixing both the -value at 20 km s-1 and the redshift at the redshift of the single component of the low-ion lines. We obtained the fit shown in Fig. 24. But, in this case, to fill the whole observed Ly absorption profile, we had to include, besides the sub-DLA contribution, a second low \textH i column density absorption system bluewards of the sub-DLA system. In the fitting procedure, the -value and the redshift of this second absorber were left as free parameters. We obtained the best fit solution with the second absorption line system located at , i.e. shifted by about km s-1 from the sub-DLA system, and with a \textH i column density of (\textH i) . The derived hydrogen column density of the sub-DLA is (\textH i) .
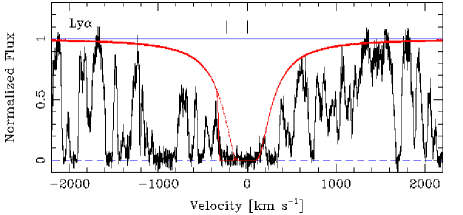
As mentioned above, a very simple velocity structure with a single component is observed in the low-ion line profiles (see Fig. 25 and Table 12). We obtained the column density measurements of Si+, C+ and Al+. (\textSi ii) was deduced from four \textSi ii lines at , 1260, 1304, 1526 Å. (\textC ii) is a marginal measurement, since the \textC ii 1334 line is located in the Ly forest, where blends are not excluded. Finally, (\textAl ii) was obtained from the \textAl ii 1670 line found in a spectral region heavily contaminated by telluric lines. The spectrum of a hot, fast rotating star observed the same night as the quasar allowed us to identify the telluric lines and to show that the Al+ line is not blended, but the uncertainty relative to the continuum placement in this region remains. We therefore adopted a relatively large error on the measured (\textAl ii). Only the \textFe ii 1608 line is available to measure the Fe+ column density, and no absorption feature at the redshift of the single component observed in the other low-ion transition lines is detected. We thus provide only a 4 upper limit on the Fe+ column density, which indicates that the metallicity is very low in this sub-DLA system, lower than [Fe/H] .
| No | Ion | ||||
| km s-1 | km s-1 | cm-2 | |||
| Low- and intermediate-ion transitions | |||||
| 1 | 3.565272 | 0 | 5.9(0.9) | \textSi ii | 13.66(0.04) |
| \textC ii | 14.34(0.12) | ||||
| \textAl ii | 12.16(0.12) | ||||
| \textFe iii | |||||
| \textAl iii | 12.71(0.09) | ||||
| High-ion transitions | |||||
| 1 | 3.564519 | 49 | 12.5(2.6) | \textSi iv | 12.95(0.07) |
| \textC iv | 13.54(0.07) | ||||
| 2 | 3.564939 | 22 | 10.8(1.1) | \textSi iv | 13.38(0.03) |
| \textC iv | 13.83(0.17) | ||||
| 3 | 3.565289 | 1 | 7.4(1.2) | \textSi iv | 13.57(0.04) |
| \textC iv | 13.84(0.06) | ||||
| 4 | 3.565531 | 17 | 5.5(0.9) | \textSi iv | 13.02(0.04) |
| \textC iv | 13.15(0.10) | ||||
| 5 | 3.565859 | 39 | 3.7(1.1) | \textSi iv | 12.97(0.08) |
| \textC iv | 13.01(0.15) | ||||
| 6 | 3.565966 | 46 | 18.8(1.0) | \textSi iv | 13.36(0.03) |
| \textC iv | 13.64(0.04) | ||||
∗ Velocity relative to
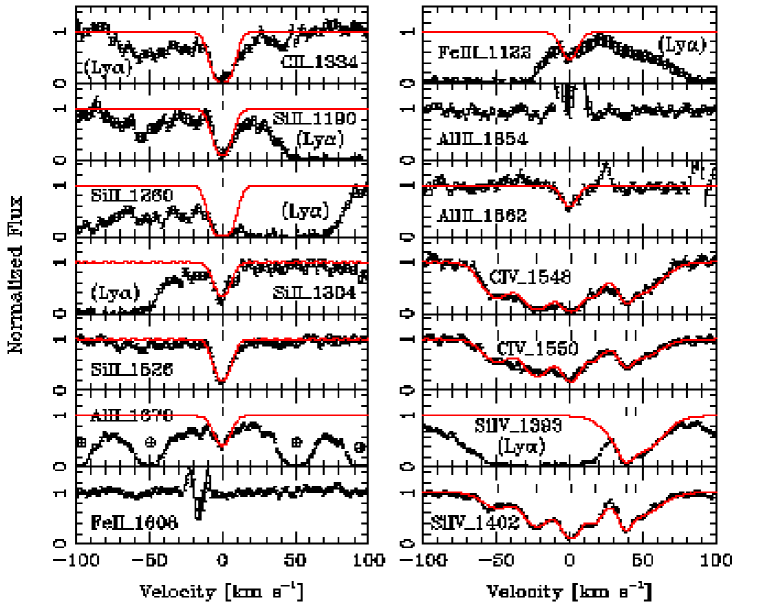
The column density measurements of the intermediate-ion transitions are crucial to constrain the ionization parameters in this sub-DLA system which has among the lowest \textH i column density in our sample. We detect only the \textAl iii 1862 line. The \textAl iii 1854 line is blended with emission lines from badly subtracted cosmic rays in the reduction procedure only two exposures were obtained for this quasar. The observed \textAl iii 1862 line shows a single component at exactly the redshift of the component of the low-ion transition lines (see Fig. 25). Assuming that this feature is real and is Al++, we obtained a column density measurement using the same fitting parameters as those deduced for the low-ion lines. We also derived an upper limit on (Fe++) from the \textFe iii 1122 line located in the Ly forest. In addition, we detect the strong \textC iv and \textSi iv high-ion transition lines. They show a much more complex velocity structure, composed of 6 components and spread over km s-1 than the low-ion lines (see Fig. 25 and Table 12).
| No | Ion | ||||
| km s-1 | km s-1 | cm-2 | |||
| Low-ion transitions | |||||
| 1 | 4.212229 | 0 | 6.8(0.5) | \textSi ii | 13.01(0.04) |
| \textO i | 14.26(0.05) | ||||
| \textC ii | 13.70(0.07) | ||||
| \textAl ii | 11.62(0.16) | ||||
| \textFe ii | 12.76(0.20) | ||||
| 2 | 4.212628 | 23 | 6.3(0.6) | \textSi ii | 12.88(0.04) |
| \textO i | 14.13(0.05) | ||||
| \textC ii | 13.59(0.05) | ||||
| \textAl ii | 11.62(0.17) | ||||
| \textFe ii | 12.43(0.30) | ||||
| High-ion transitions | |||||
| 1 | 4.212394 | 10 | 22.5(6.7) | \textSi iv | 12.87(0.10) |
| 2 | 4.212925 | 40 | 7.9(4.9) | \textSi iv | 12.05(0.25) |
∗ Velocity relative to
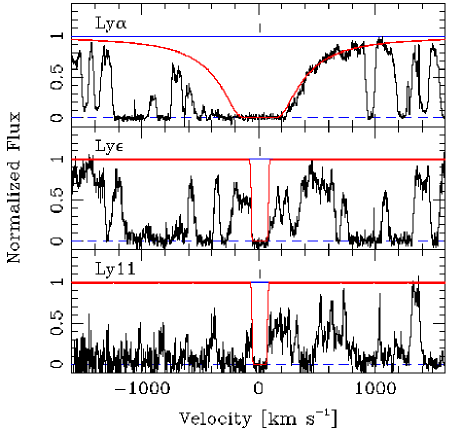
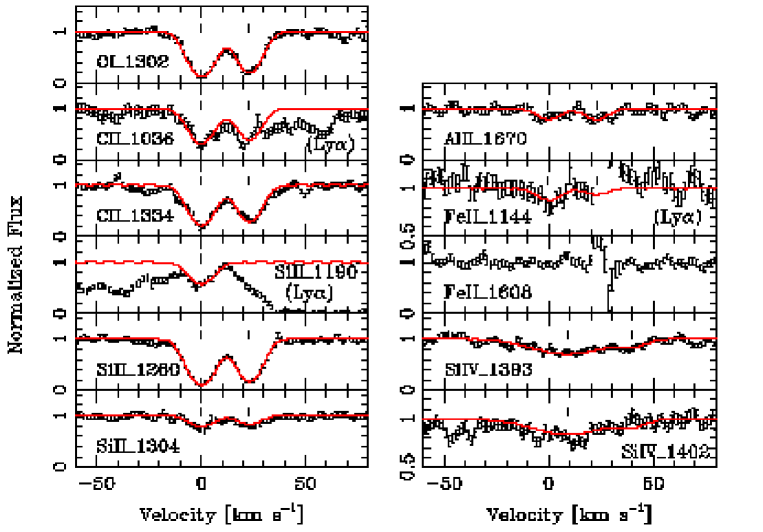
3.10.3
This high redshift sub-DLA system was easily identified with the Ly absorption line which shows a very well defined red damping wing, the blue wing being partially blended with Ly forest lines. The Lyman series is observed down to Ly13 in this sub-DLA and allowed us to obtain a very accurate \textH i column density measurement by fitting simultaneously the Ly line and the unblended Ly and Ly11 lines (see Fig. 26). In the fitting procedure, we left the redshift as a free parameter and we fixed the -value at 23 km s-1. The best fit solution was obtained with which fell just between the two components observed in the low-ion transition lines, and with a \textH i column density of (\textH i) . However, it can be seen that the sub-DLA system is not sufficient to fill the whole observed Ly absorption, so contributions from additional Ly clouds have to be included.
| No | Ion | ||||
| km s-1 | km s-1 | cm-2 | |||
| Low-ion transitions | |||||
| 1 | 3.880511 | 131 | 8.7(2.0) | \textSi ii | 12.91(0.11) |
| \textC ii | 13.55(0.06) | ||||
| \textAl ii | 11.28(0.15) | ||||
| 2 | 3.880811 | 112 | 5.6(1.3) | \textSi ii | 12.87(0.10) |
| \textC ii | 13.48(0.06) | ||||
| \textAl ii | 11.68(0.25) | ||||
| 3 | 3.881785 | 52 | 7.4(1.1) | \textSi ii | 13.08(0.05) |
| \textC ii | 13.79(0.06) | ||||
| \textAl ii | 11.92(0.09) | ||||
| 4 | 3.882032 | 37 | 6.5(1.9) | \textSi ii | 12.63(0.07) |
| \textC ii | 13.35(0.14) | ||||
| 5 | 3.882392 | 15 | 4.2(3.3) | \textC ii | 12.88(0.15) |
| 6 | 3.882639 | 0 | 6.4(1.1) | \textSi ii | 12.95(0.10) |
| \textC ii | 13.59(0.04) | ||||
| \textAl ii | 11.59(0.15) | ||||
| 7 | 3.883733 | 67 | 25.6(2.8) | \textC ii | 13.91(0.04) |
| 8 | 3.884153 | 93 | 7.1(3.4) | \textC ii | 12.87(0.32) |
| 9 | 3.884580 | 119 | 10.5(0.9) | \textSi ii | 13.45(0.04) |
| \textC ii | 14.12(0.04) | ||||
| \textAl ii | 11.92(0.09) | ||||
| 10 | 3.885067 | 149 | 12.1(1.2) | \textSi ii | 13.35(0.05) |
| \textC ii | 14.09(0.03) | ||||
| \textAl ii | 12.16(0.06) | ||||
| 11 | 3.885412 | 170 | 3.5(2.0) | \textC ii | 13.02(0.09) |
| High-ion transitions | |||||
| 1 | 3.883235 | 37 | 20.0(5.7) | \textC iv | 13.15(0.10) |
| 2 | 3.883706 | 66 | 11.8(2.8) | \textSi iv | 12.91(0.07) |
| \textC iv | 13.50(0.04) | ||||
| 3 | 3.884165 | 94 | 10.7(1.4) | \textSi iv | 13.00(0.04) |
| \textC iv | 13.40(0.05) | ||||
| 4 | 3.884840 | 135 | 18.8(3.9) | \textSi iv | 13.28(0.10) |
| \textC iv | 13.79(0.04) | ||||
| 5 | 3.885314 | 164 | 7.7(1.4) | \textSi iv | 12.81(0.06) |
| \textC iv | 13.35(0.06) | ||||
∗ Velocity relative to
Given the high signal-to-noise ratio of the available spectra in the regions where we detect the low-ion transition lines and the fact that they show a simple velocity structure composed of two well separated components (see Fig. 27 and Table 13), we obtained very accurate column density measurements of O0, C+, Si+ and Al+. Two \textFe ii lines at and 1608 Å are observed in the available spectra. A very weak feature is detected in the \textFe ii 1144 line at the redshift of the component 1. But, the second component is partially blended with an emission line from badly subtracted cosmic rays in the reduction procedure a single exposure was obtained for this quasar in the blue. No absorption feature is observed in the \textFe ii 1608 lines, moreover the second component is blended with a badly subtracted strong sky line. We thus obtained only a marginal measurement of the Fe+ column density, on which we adopted a large error. The weakness of these \textFe ii lines indicates that the metallicity in this sub-DLA system is very low, [Fe/H] .
The \textAl iii intermediate-ion transition lines are covered in the available spectra, but the signal-to-noise ratio is so low in this particular region that no Al++ line is detected, and no reliable 4 upper limit can be derived. In addition, the \textFe iii 1122, \textSi iii 1206 and \textC iii 977 lines are all blended with Ly forest absorptions. Consequently, no intermediate-ion column density measurement was obtained in this sub-DLA system. On the other hand, the \textSi iv high-ion transition lines are observed (the \textC iv lines are outside the available spectral coverage). Again they show a different velocity structure from the low-ion line profiles, but are in this case extended over a similar velocity range (see Fig. 27 and Table 13).
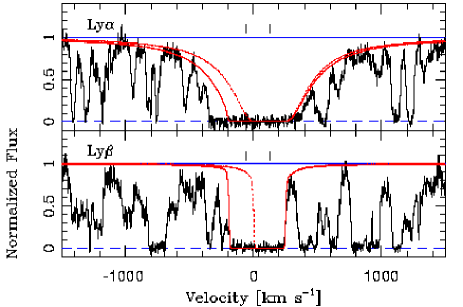
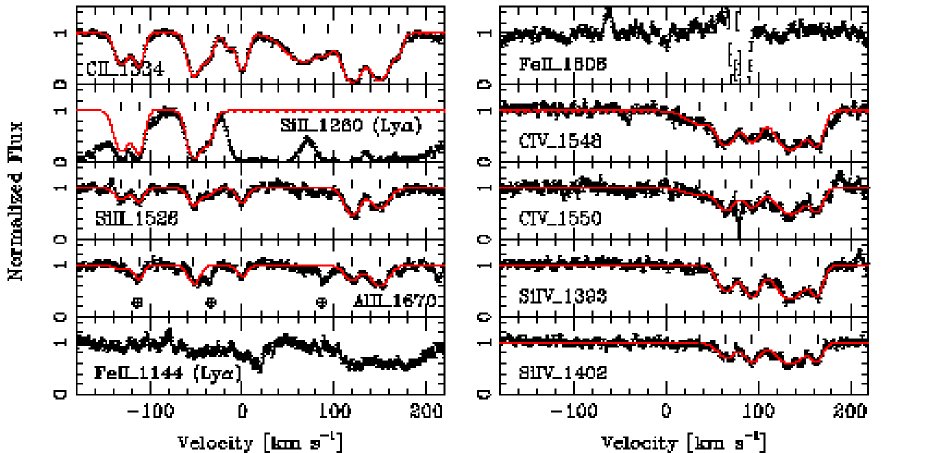
3.11 PSS J2344+0342,
Péroux et al. (2001) obtained 5 Å resolution (FWHM) spectra of this quasar and identified a DLA system at . The metallicity of this DLA system was first reported by Dessauges-Zavadsky et al. (2001b). Here we present the chemical analysis of a newly discovered high-redshift sub-DLA system at . It has been identified thanks to the Ly absorption line which shows partially blended damping wings. The Ly and Ly lines are also observed in this sub-DLA system. The simultaneous fit of both Ly and Ly the Ly line is strongly blended allowed us to obtain an accurate \textH i column density measurement.
A first series of fitting tests of the Ly and Ly lines was done by considering a single absorption line system. By leaving the redshift and the -value as free parameters, the best fit solution was obtained with a sub-DLA system at very close to the redshift of the strongest component of the low-ion transition lines, the component 9 and a \textH i column density of (\textH i) . In this solution the red wings of the Ly and Ly lines were well fitted, but the fit clearly shows that another strong absorption line system is present bluewards of the sub-DLA system (see Fig. 28). We then made a second series of fitting tests by considering this time two absorption line systems. By leaving in the fitting procedure all the -values and redshifts as free parameters, we obtained the best fit solution with a sub-DLA system characterized by the values described above plus a second strong absorber at shifted by about km s-1 from the sub-DLA system with a \textH i column density of (\textH i) . This absorption line system is a borderline case between the Lyman limit and sub-DLA systems, but we do not include it in the sub-DLA sample.
Table 14 and Fig. 29 present the velocity structure of the sub-DLA system. The low-ion transition lines show a complex velocity structure well described by 11 components. We obtained accurate column density measurements of C+ and Si+. The \textAl ii 1670 line is located in a region strongly contaminated by telluric lines. We identified the telluric lines with the help of the spectrum of a hot, fast rotating star observed the same night as the quasar, and noticed that the components 2 and 7 are blended. We adopted a large error on the deduced (Al+) to take into account the contributions of these blends. Two Fe+ lines, \textFe ii 1144 and \textFe ii 1608, are observed. However, the \textFe ii 1144 line is partially blended with Ly forest lines, and none of the 11 components is detected in the \textFe ii 1608 line. We thus provide a 4 upper limit on the Fe+ column density which indicates that the metallicity in this sub-DLA system is low, lower than [Fe/H] . No intermediate-ion transition line is clearly observed. The \textFe iii 1122, \textC iii 977, \textN ii 1083 and \textSi iii 1206 lines are strongly blended with Ly forest lines, and the \textAl iii lines are not detected. We provide a 4 upper limit on the Al++ column density.
| Correlations for the whole sample of | # of systems | slope | intercept | ||
|---|---|---|---|---|---|
| both the DLA and sub-DLA systems | |||||
| (Si+) vs (Fe+) | 39 | 0.95 | |||
| (Al+) vs (Si+) | 19 | 0.92 | |||
| (Al+) vs (Fe+) | 17 | 0.82 | |||
| (Al++)/(Al+) vs (H0) ∗ | 30 | 0.67 |
∗ Computed for the sample of DLAs only.
References: This paper; Dessauges-Zavadsky et al. (2001a); Lopez et al. (1999,2002); Lu et al. (1995,1996b); Prochaska & Wolfe (1996,1997,1999); Prochaska et al. (2001); Péroux et al. (2002b)
It should be emphasized that the observed low-ion transition line profiles extend over a very large velocity interval of km s-1, from to km s-1 in velocity space. It implies that the low-ion transition lines overlap over the two identified clustered absorption line systems the sub-DLA and the absorber at shifted by only km s-1 from the sub-DLA (see above). It may thus be possible that some of the components of the detected low-ion metal lines are associated with this second absorber and not with the sub-DLA system. Two distinct clumps in the low-ion profiles are not yet observed, but the two high \textH i column density absorption line systems are so close that it would not be surprising to find their metal lines blended. Moreover, the observed high-ion transition lines, \textC iv and \textSi iv, are surprisingly confined to a much narrower velocity interval from to km s-1 (see Fig. 29 and Table 14). This may suggest that the detected high-ion lines are associated only with the sub-DLA system. If this is the case, the components of the low-ion transition lines belonging to the sub-DLA could be only the ones which are located in the same velocity interval as the high-ion lines, i.e. the components 7 to 11. The components 1 to 6 could then be associated with the second absorption line system. It is difficult to be categorical on the real situation, therefore it would perhaps be more sensible to speak of an interval of values for the column density measurements in this sub-DLA system.
4 Ionization correction study
In the 12 sub-DLA systems and 1 borderline case between the DLA and sub-DLA systems studied, we obtained ionic column density measurements of low-ion transitions, O0, C+, Si+, N0, S+, Mg+, Al+, Fe+, Ni+, Zn+ and Cr+, intermediate-ion transitions, Al++ and Fe++, and high-ion transitions, C3+ and Si3+. To derive the intrinsic abundance measurements of the 11 detected elements, it is necessary to take into account both the ionization and dust depletion effects, since we are measuring gas-phase abundances. Depletion is discussed in the wider context of Paper II. Here we analyse the ionization status of these systems.
Several authors have investigated the ionization effects in the DLA systems (Viegas 1995; Howk & Sembach 1999; Izotov, Schaerer & Charbonnel 2001; Vladilo et al. 2001; Prochaska et al. 2002). Many of them were motivated by the observations of the intermediate-ion Al++, a tracer of moderately ionized gas, with the same velocity profiles as the low-ion transitions (Lu et al. 1996b; Prochaska & Wolfe 1999; Prochaska et al. 2001), which suggest that ionization effects may be present in these systems. Indeed, to explain the similarity of \textAl iii and other low-ionization species line profiles, Howk & Sembach (1999) and Izotov & Thuan (1999) proposed that these lines originate in the same ionized region or in a mix of neutral and ionized clouds, and stressed the importance of abundance corrections for ionization effects. Although the different approaches used to deal with the problem of photoionization in DLAs have led to slightly different conclusions, it is generally accepted that ionization corrections in DLAs are negligible, being below the measurement errors.
In the present study, we are concerned about the ionization corrections for sub-DLA, i.e. systems with \textH i column densities lower than those of DLA systems, between (\textH i) cm-2. The check of ionization effects in these systems is very important, since their relatively low \textH i column density implies that some of the gas might be ionized.
4.1 Al++/Al+ as Indicator of the Ionization State
In six out of the 12 sub-DLA systems studied we detect the \textAl iii 1854,1862 lines, and in four we also detect the \textFe iii 1122 line. While neutral and singly ionized species with ionization potential eV can be present in the inner parts of H0 regions, the production of Fe++ and Al++ requires photons with and 18.8 eV, respectively, which cannot so easily penetrate large \textH i column densities. The analysis of these intermediate-ion transition profiles, however, shows that in all of the sub-DLAs but one at towards Q1101264 (see Section 3.2), their velocity structure is almost indistinguishable from that of low-ion transition profiles, while the high-ion \textC iv and \textSi iv transitions have very different velocity profiles. This suggests that the Fe++ and Al++ and regions of neutral H in these systems are physically connected.
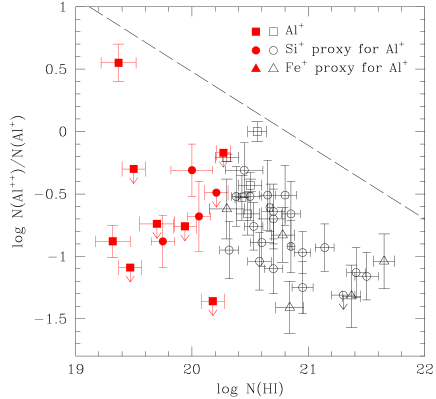
The (Al++)/(Al+) and (Fe++)/(Fe+) ratios can then be used as indicators of the ionization state. Vladilo et al. (2001) studied the DLA ionization properties from the analysis of the Al++/Al+ ratios in a data sample of 20 DLAs, and found a (Al++)/(Al+) versus (H0) anti-correlation. The existence of such an empirical anti-correlation implies that the neutral hydrogen column density is an indirect tracer of the ionization state of the gas. Consequently, if this anti-correlation is further observed in the sub-DLA \textH i column density range, it would indicate that the sub-DLA systems require higher ionization corrections than absorbers in the DLA \textH i column density range.
Therefore, we decided to investigate the extension of the different correlations found by Vladilo et al. (2001) in the DLA systems to the \textH i column density range of the sub-DLA systems. For this purpose we have collected all the DLA and sub-DLA systems found in the literature for which measurements of the Al+ and/or Al++ column densities exist and was performed on high resolution spectra obtained at the 8-10 m class telescopes. Most of them were derived from the HIRES/Keck spectra. We have then considered only the systems which show similarities in their Al++ and low-ionization species line profiles, since it is only in this case that the neutral and ionized clouds might be physically related. Finally, we have adopted the values given by Vladilo et al. (2001) for the few cases of Al+ column density measurements that they have revisited due to previously unquoted saturations or contaminations by telluric lines. The results and the references for the adopted sample of both DLAs and sub-DLAs found in the literature and analysed in this paper are given in Table 15. This table contains the Spearman’s test correlation coefficients, , the probabilities of null hypothesis (of no correlation), , the slopes and the intercepts obtained for the linear regressions of (Si+) versus (Fe+), (Al+) versus (Si+), (Al+) versus (Fe+), and (Al++)/(Al+) versus (H0).
We confirm the existence of the (Si+) versus (Fe+), (Al+) versus (Si+), and (Al+) versus (Fe+) correlations found by Vladilo et al. (2001) in the DLA systems (see Table 15). These correlations are also satisfied by the sub-DLA systems. We then used the Si+ (in priority, because the correlation with Al+ has lower slope and intercept errors) or Fe+ column densities as a proxy for (Al+), when no (Al+) measurement was available in the DLA or sub-DLA systems. In four sub-DLAs and several DLAs we took advantage of the correlations Si+ versus Al+ and Fe+ versus Al+ to indirectly estimate (Al+) in order to increase the number of the (Al++)/(Al+) ratio measurements.
Figure 30 shows the Al++/Al+ column density ratios versus H0 column densities both for the DLA (open symbols) and sub-DLA (filled symbols) systems. We confirm the (Al++)/(Al+) versus (H0) anti-correlation for the enlarged sample of DLA systems (30 objects instead of 17 used by Vladilo et al. 2001) at the probability of null hypothesis of (correlation coefficient of ; see Table 15). However, we show that at a lower \textH i column density regime, this correlation is no longer valid. The sub-DLA systems have Al++/Al+ ratios which are similar to those of the DLAs and not higher, as shown in Fig. 30 with five measured values and seven upper limits (filled symbols). Only one system at towards PSS J2155+1358 with (\textH i) is really in agreement with the extrapolation of the DLA correlation to lower \textH i column densities (filled square in the upper left corner in Fig. 30).
This implies that the neutral hydrogen column density is not a reliable indicator of the ionization state of the gas in absorption line systems as suggested by Vladilo et al. (2001), since it does not scale with the Al++/Al+ column density ratio which is at a first approximation an indicator of the ionization level in the gas. On the contrary, Figure 30 shows that since the sub-DLA systems, despite their lower \textH i column densities, span approximately the same range of the Al++/Al+ column density ratio values as the DLA systems, they are likely to be affected by ionization corrections on average at the same level as the DLAs and not higher. However, we cannot claim that all of the absorption line systems with \textH i column densities between and cm-2 (the sub-DLA \textH i column density definition) satisfy the same trend, as already shown by the example of the sub-DLA system at towards PSS J2155+1358. We can rather interpret the present data as showing an increasing dispersion in the (Al++)/(Al+) ratios with lower H0 column densities. The plotted dashed line in Figure 30 with the slope of the (Al++)/(Al+) versus (H0) anti-correlation observed in DLAs can be considered as an upper band limit of this increasing dispersion trend. If this trend is further confirmed by additional measurements, this would suggest that at high (H0) cm-2 only low ionization effects are expected, while at lower (H0) between and cm-2 one can find systems affected by low as well as high ionization corrections.
4.2 Photoionization Models
To investigate the ionization corrections in our sub-DLAs, we have used the CLOUDY software package (version 94.00, Ferland 1997), and we have computed photoionization models assuming ionization equilibrium. In the models we have adopted a plane-parallel geometry for the gas cloud, the solar abundance pattern, and two different ionizing spectra, since the major uncertainty in determining the ionization effects in absorption line systems is the unknown shape of the ionizing spectrum. The two most likely origins for ionizing UV photons are external background sources and internal stellar sources it is reasonable to expect some star formation in these systems. For the external ionizing source, we adopted the Haardt-Madau (hereafter HM) ionizing UV spectrum from background quasars with contributions from galaxies (Haardt & Madau 1996; Madau, Haardt & Rees 1999). For the stellar ionizing source, we adopted the spectrum of a local ionization which we consider to be a composite stellar spectrum plus a power law (hereafter SSP; see D’Odorico & Petitjean 2001). In the former case the ionizing photons have a harder spectrum.
With each of these two ionizing spectra, we computed a series of CLOUDY models for each sub-DLA system in our sample by varying the \textH i column density of the plane-parallel ‘cloud’, the metallicity and the redshift according to the system considered, and by varying the volume density of hydrogen, , through the variation of the ionization parameter, , defined by
where is the surface flux of ionizing photons with Ryd, and is the intensity of the incident radiation at 1 Ryd. In practice, we varied from to 0, and obtained the theoretical column density predictions for all of the observed ions as a function of the ionization parameter.
We then determined the ionization state of a given sub-DLA system by measuring adjacent ions of elements (e.g. Al++/Al+, Fe++/Fe+). Indeed, the value of the ionization parameter, , at which the observed column density ratio of adjacent ions matches the predicted ratio, corresponds to the ionization parameter of the system studied. Therefore, the more numerous the measurements of column density ratios of adjacent ions of different elements, the more accurate is the determination of the ionization state of a system, all the more since the reliability of the derived photoionization models depends not only on the assumed hypothesis, but also on the accuracy of the input atomic data for the CLOUDY code (e.g. dielectric recombination coefficients).


Following the Prochaska et al. (2002) ionization analysis, we have further computed models giving the predicted abundance of low-ion Xi over H0 and Fe+ relative to the intrinsic abundance of these two elements,
-
,
-
,
as a function of the ionization parameter, . Departures of [Xi/H0] and [Xi/Fe+] from zero indicate that ionization corrections have to be added to the observed absolute and relative elemental abundances, respectively. When the corrections to be applied are negative (positive), this implies that the measured [X/H] or [X/Fe] are underestimated (overestimated). The main advantage of these models compared to the models giving the predicted Xi column densities as a function of is that they allow a direct quantification of the effects of photoionization on the absolute and relative abundances.
4.3 Results: Ionization Corrections
In the sample of the 12 sub-DLA systems and one borderline case between the DLA and sub-DLA systems studied here, the \textH i column densities range from (\textH i) to 20.30 cm-2, and the metallicities spread over dex (from [Fe/H] to [Fe/H] ). This large range of input parameters for the CLOUDY models allows us to highlight some general trends. Indeed, the computed CLOUDY models specific to each sub-DLA system in our sample show that for a given ionization parameter, , the derived [Xi/H0] and [Xi/Fe+] ionization corrections (as defined in Section 4.2) increase with lower \textH i column densities of systems for all low-ions Xi and for both the HM or SSP ionizing spectra, while no particular trend is observed with the metallicity of the systems. In addition, we notice that the ionization corrections are on the average more important in the models with a SSP radiation field than with a HM spectrum for all of the systems studied. We show in Figs. 31 and 32 the CLOUDY models for two sub-DLA systems, one at towards Q1223+1753 with a very low \textH i column density (\textH i) and a high [Fe/H] , and the second at towards PSS J2155+1358 with a high \textH i column density (\textH i) and a low [Fe/H] , respectively. They illustrate these general trends.
Once we have computed the CLOUDY models, the determination of the ionization state is crucially dependent on the measurements of column density ratios of adjacent ions of elements, and thus on the detections of intermediate-ion transitions. In the sample of 13 systems studied, we were able to constrain the ionization parameter, , for 10 systems. However, we obtained for only four systems the (Al++)/(Al+) and/or (Fe++)/(Fe+) measurements, while for the six remaining systems we derived only (Al++)/(Al+) and/or (Fe++)/(Fe+) upper limits. The analysis of the ionization state of our sub-DLA systems is thus severely limited by the fact that i) we do not have a measurement of a column density ratio of adjacent ions of an element for all of the sub-DLAs, and ii) for the majority of sub-DLAs we have only a measurement of the Al++/Al+ ratio or even only an upper limit, and as has already been pointed out by Petitjean, Rauch & Carswell (1994), D’Odorico & Petitjean (2001) and Vladilo et al. (2001), the Al++/Al+ ratio is not a very reliable indicator of the ionization parameter. Indeed, the recombination coefficient of Al+ is likely overestimated (Nussbaumer & Storey 1986), and in this case the predicted Al++/Al+ ratio in the CLOUDY models is underestimated. This prevents us from obtaining a very accurate determination of the ionization parameter in our sub-DLA systems. In addition, with our set of data, we are not able to constrain the nature of the radiation field, since we cannot clearly differentiate which from the HM or SSP ionizing spectrum best represents the observations.
In this context we choose to extract from our analysis general conclusions on the ionization corrections in the sub-DLA systems studied, rather than a discussion on individual systems which is limited by the partial information we have. Several important general remarks can be inferred from our study. First, as can be observed in Figs. 31 and 32, the ionization corrections to apply to absolute and relative abundances are different ion to ion. Indeed, in the case of C+, O0, S+ or Cr+, for example, the ionization corrections [Xi/Fe+] increase smoothly with the ionization parameter, , and remain relatively small for all of the values, while for the Si+, Al+ and Zn+ ions they already become important at relatively low values. Similarly, for the metallicities, the [Xi/H0] corrections are not significant for Fe+ up to high values, while they are much higher for Zn+ at high values. Secondly, for 9 systems out of 10 for which we were able to constrain the ionization parameter the ionization corrections are lower than 0.2 dex for all of the elements but \textAl ii and \textZn ii (in some cases; mainly if we assume that the SSP radiation field is the dominant ionizing source in our systems) down to \textH i column densities of (\textH i) cm-2 (see Figs. 31 and 32). In the case of Al+ and Zn+ the ionization corrections may be overestimated, since the Al+ and Zn+ recombination coefficients and ionization cross sections are rather uncertain (see Nussbaumer & Storey 1986 and Howk, Savage & Fabian 1999, respectively). Only in the sub-DLA system at towards PSS J2155+1358 are the ionization corrections important (filled square in the upper left corner in Fig. 30). For three sub-DLAs in our sample we could not constrain the ionization parameter, .
5 Overview of the Chemical Abundances in Sub-DLAs
The constructed sample of 12 sub-DLA systems and one borderline case between the DLA and sub-DLA systems, and the homogeneous chemical abundance analysis of each system presented in this paper result in the first sub-DLA chemical abundance database ideal for the study of a number of important issues. Indeed, 16 different ions of low-, intermediate- and high-ionization and 11 different elements O, C, Si, N, S, Mg, Al, Fe, Ni, Zn and Cr have been detected in the 13 systems studied, showing a variety of elements as diverse as that observed in the DLAs. Tables 16 a) and b) present a summary of the column density measurements of the low-ion transitions and the intermediate-/high-ion transitions, respectively, obtained in the 13 systems analysed. These column densities were derived by summing the column densities of all of the detected velocity components in each ion as given in Tables 214. The cases in which we provide only lower limits correspond to the cases where the observed metal lines are saturated, and the cases in which we provide only upper limits correspond to cases where the observed metal lines are blended with Ly forest absorption lines. 4 upper limits were derived in the cases where the metal lines are not detected and are identified by an asterisk.
In Table 17 we provide a summary of the absolute abundance measurements of the 12 sub-DLA systems and one borderline case between the DLA and sub-DLA systems, defined with respect to the solar meteoritic abundances from Grevesse & Sauval (1998). No ionization correction has been adopted since, as was shown in Section 4 for all of the systems studied for which we were able to constrain the ionization parameter (10 systems out of 13) except one at towards PSS J2155+1358, the ionization corrections are almost negligible, being at the level of the errors. Indeed, they are lower than 0.2 dex for all of the elements except \textAl ii and \textZn ii (in some cases, but likely overestimated because the Al+ and Zn+ recombination coefficients are very uncertain) down to \textH i column densities of (\textH i) cm-2.
Fig. 33 shows the distribution of iron and silicon absolute abundances, [Fe/H] and [Si/H], as a function of redshift and \textH i column density for the 12 sub-DLAs in our sample. The studied sub-DLAs span a range of redshift from 1.8 to 4.3 and of [Fe/H] metallicities from to , which is very similar to that observed in DLAs. We observe a trend of increasing metallicity with redshift, but no correlation between metallicities and \textH i column densities is visible. An overall discussion on the chemical abundances of sub-DLAs, and a detailed comparison of the chemical, kinematic and clustering properties between the sub-DLAs and DLAs is given in Paper II.

The lower \textH i column densities of the sub-DLA systems relative to the DLA systems give us the opportunity to have access to some elements which absorption lines are usually saturated in DLAs, but prevent us from measuring abundances of some other elements whose lines are already weak in DLAs. As examples of the former case, one can quote the carbon and oxygen. Indeed, C is almost not accessible in DLAs, since the \textC ii 1036,1334 lines are heavily saturated. Only very few tentative measurements have been obtained (Lopez et al. 1999,2002; Levshakov et al. 2002; Songaila & Cowie 2002). The O abundance is also very difficult to measure in DLAs, since the most commonly detected \textO i line at Å is saturated and other \textO i lines are located in the Ly forest. On the contrary, in the sub-DLA systems one can more easily measure the abundances of these two important elements we obtained four O and six C abundance measurements which may provide insight into the understanding of the nature and the chemical evolution history of these systems (see Paper II). On the other hand, the useful Zn abundance used as an indicator of the dust depletion in DLAs is very hard to measure in sub-DLAs given the weakness of the \textZn ii lines. While numerous Zn abundance measurements exist in DLAs, we obtained only two Zn measurements in our sample of sub-DLAs.
6 Conclusion
The findings by Péroux et al. (2003a) that the ‘sub-DLA’ systems with \textH i column densities between (\textH i) cm-2 contain a large fraction of the neutral hydrogen gas mass especially at , have motivated us to investigate systematically quasar spectra in the ESO UVES-VLT archives searching for these absorbers. We have obtained the following results:
-
•
Out of 22 high-resolution quasar spectra available to us in July 2001 in the ESO UVES-VLT archives and suitable for the construction of a sample of sub-DLA systems, reduced and analysed with an identical approach, we have built the first sample of 12 sub-DLA systems in the redshift interval . These systems were identified in the quasar spectra both via an automated selection algorithm and visual criteria, like the presence of damping wings in the Ly absorption line. Ten of them constitute a sample that we believe to be homogeneous and unbiased.
-
•
The detailed metal line analysis of each of the 12 sub-DLA systems and one borderline case between the DLA and sub-DLA systems resulted in the column density measurements of 16 ions of low-, intermediate- and high-ionization \textO i, \textC ii, \textC iv, \textSi ii, \textSi iv, \textN i, \textS ii, \textMg i, \textMg ii, \textAl ii, \textAl iii, \textFe ii, \textFe iii, \textNi ii, \textZn ii and \textCr ii. The detection of adjacent ions of the same element, Fe++/Fe+ and Al++/Al+, allowed us to estimate the ionization parameters in 10 systems. Using the CLOUDY software package, we computed photoionization models and found that for all of the 10 systems except one at towards PSS J2155+1358, the ionization corrections are almost negligible, being at the level of the errors. Indeed, they are lower than 0.2 dex for all of the elements except \textAl ii and \textZn ii (in some cases, but likely overestimated because the Al+ and Zn+ recombination coefficients are very uncertain) down to \textH i column densities of (\textH i) cm-2.
-
•
We have obtained the first sub-DLA chemical abundance database which contains the abundance measurements of 11 different elements O, C, Si, N, S, Mg, Al, Fe, Ni, Zn and Cr. The lower \textH i column densities of sub-DLAs allowed us, in particular, to easily measure the O and C abundances, the \textO i and \textC ii lines being usually saturated in DLAs. We obtained O abundance measurements in four systems and C in six systems.
The constructed homogeneous and unbiased sample of the sub-DLA systems and the obtained sub-DLA chemical abundance database are ideal for the analysis of a number of important issues related both to the neutral gas mass and the metal content evolutions in the Universe. These issues are discussed in Paper II of this series, where we also present a detailed study of the sub-DLA kinematic, chemical and clustering properties, and their comparison with the properties of the well studied DLA systems. We plan to extend the current sample of sub-DLA systems in order to increase the statistical weight of the obtained results both from the newly accessible data in the ESO UVES archives and from observations of pre-selected high-redshift quasars, since it is at high redshift that the sub-DLAs are expected to contain a large fraction of the neutral hydrogen gas mass (Péroux et al. 2002a).
7 Acknowledgments
We are very grateful to Paolo Molaro and Miriam Centurión for providing us with the reduced and normalized spectrum of the quasar Q00002620. We particularly thank Miriam Centurión for her help in the computation of photoionization models. We express our gratitude to the ESO staff in charge of the VLT archive for their efficient work to the benefit of the community. We thank an anonymous referee for helpful comments. M.D.-Z. is supported by the Swiss National Funds and C.P. is funded by a European Marie Curie Fellowship.
| Name | (\textH i) | (\textO i) | (\textC ii) | (\textSi ii) | (\textN i) | (\textS ii) | (\textMg ii) | (\textAl ii) | (\textFe ii) | (\textNi ii) | (\textZn ii) | (\textCr ii) | |
|---|---|---|---|---|---|---|---|---|---|---|---|---|---|
| Q1101264a……….. | 1.838 | 19.50(0.05) | 14.55(0.09) | 15.06(0.07) | 14.00(0.01) | … | 13.66(0.11) | 14.07(0.03) | 12.85(0.06) | 13.51(0.02) | … | ∗ | ∗ |
| Q12231753………… | 2.557 | 19.32(0.15) | … | 14.38(0.02) | … | … | … | 13.20(0.03) | 13.98(0.03) | … | ∗ | ∗ | |
| Q1409095…………. | 2.668 | 19.75(0.10) | 15.31(0.11) | 14.13(0.03) | 13.54(0.06) | … | … | 14.02(0.13) | … | ∗ | 12.49(0.15) | ||
| Q1444014…………. | 2.087 | 20.18(0.10) | 14.83(0.02) | … | … | … | 13.42(0.03) | 14.41(0.03) | … | … | … | ||
| Q1451123…………. | 2.255 | 20.30(0.15) | … | … | … | … | … | … | 14.33(0.07) | 11.85(0.11) | 12.88(0.14) | ||
| Q1451123 ………… | 3.171 | 19.70(0.15) | 14.30(0.20) | 13.64(0.03) | … | … | … | 12.31(0.03) | 13.33(0.06) | … | ∗ | ∗ | |
| Q1511090 ………… | 2.088 | 19.47(0.10) | … | 14.05(0.10) | … | … | … | 12.93(0.14) | 13.26(0.03) | … | … | … | |
| Q2059360…………. | 2.507 | 20.21(0.10) | 15.54(0.21) | 14.87(0.19) | 13.73(0.11) | 12.66(0.18) | … | … | … | 13.47(0.03) | … | ∗ | ∗ |
| Q2116358…………. | 1.996 | 20.06(0.10) | … | 15.33(0.12) | … | … | 14.77(0.09) | 13.57(0.06) | 12.29(0.09) | 12.92(0.13) | |||
| PSS J21551358….. | 3.142 | 19.94(0.10) | 13.65(0.07) | … | … | … | 12.33(0.10) | 13.23(0.19) | … | … | … | ||
| PSS J21551358….. | 3.565 | 19.37(0.15) | … | 14.34(0.12) | 13.66(0.04) | … | … | … | 12.16(0.12) | ∗ | … | … | … |
| PSS J21551358….. | 4.212 | 19.61(0.10) | 14.50(0.05) | 13.95(0.06) | 13.25(0.04) | … | … | … | 11.92(0.17) | 12.93(0.23) | … | … | … |
| PSS J23440342b… | 3.882 | 19.50(0.10) | … | 14.74(0.05) | 13.96(0.06) | … | … | … | 12.62(0.11) | ∗ | … | … | … |
| a The \textMg i column density is also measured in this sub-DLA: (\textMg i) . | |||||||||||||
| b If the components 16 do not belong to the sub-DLA (see Section 3.11), then: (\textC ii) , (\textSi ii) and (\textAl ii) . | |||||||||||||
| b) Intermediate- and high-ion transition column density summary | ||||||
|---|---|---|---|---|---|---|
| Name | (\textH i) | (\textAl iii) | (\textFe iii) | (\textC iv) | (\textSi iv) | |
| Q1101264…………. | 1.838 | 19.50(0.05) | 12.34(0.04) | … | 14.22(0.04) | 13.84(0.05) |
| Q12231753………… | 2.557 | 19.32(0.15) | 12.32(0.13) | 14.31(0.13) | 14.44(0.04) | 13.99(0.02) |
| Q1409095…………. | 2.668 | 19.75(0.10) | 11.89(0.05) | 13.17(0.12) | … | … |
| Q1444014…………. | 2.087 | 20.18(0.10) | ∗ | ∗ | 13.22(0.05) | 12.94(0.04) |
| Q1451123…………. | 2.255 | 20.30(0.15) | 12.70(0.05) | … | … | … |
| Q1451123 ………… | 3.171 | 19.70(0.15) | ∗ | … | 13.48(0.13) | … |
| Q1511090 ………… | 2.088 | 19.47(0.10) | ∗ | ∗ | … | … |
| Q2059360…………. | 2.507 | 20.21(0.10) | ∗ | … | … | … |
| Q2116358…………. | 1.996 | 20.06(0.10) | 13.25(0.09) | 14.38(0.02) | ||
| PSS J21551358….. | 3.142 | 19.94(0.10) | … | … | … | |
| PSS J21551358….. | 3.565 | 19.37(0.15) | 12.71(0.09) | 14.38(0.10) | 14.05(0.04) | |
| PSS J21551358….. | 4.212 | 19.61(0.10) | … | … | … | 12.93(0.12) |
| PSS J23440342….. | 3.882 | 19.50(0.10) | ∗ | … | 14.19(0.05) | 13.64(0.07) |
| ∗ 4 upper limit (corresponding to non-detections). | ||||||
| Name | (\textH i) | [O/H] | [C/H] | [Si/H] | [N/H] | [S/H] | [Mg/H] | [Al/H] | [Fe/H] | [Ni/H] | [Zn/H] | [Cr/H] | |
| Q1101264………….. | 1.838 | 19.50(0.05) | (0.12) | (0.10) | (0.05) | … | (0.13) | (0.06) | (0.08) | (0.05) | … | ∗ | ∗ |
| Q12231753………… | 2.557 | 19.32(0.15) | … | (0.15) | … | … | … | (0.15) | (0.15) | … | ∗ | ∗ | |
| Q1409095…………. | 2.668 | 19.75(0.10) | (0.16) | (0.10) | (0.13) | … | … | (0.16) | … | ∗ | (0.18) | ||
| Q1444014…………. | 2.087 | 20.18(0.10) | (0.10) | … | … | … | (0.10) | (0.10) | … | … | … | ||
| Q1451123…………. | 2.255 | 20.30(0.15) | … | … | … | … | … | … | (0.17) | (0.19) | (0.20) | ||
| Q1451123 ………… | 3.171 | 19.70(0.15) | (0.26) | (0.15) | … | … | … | (0.15) | (0.16) | … | ∗ | ∗ | |
| Q1511090 ………… | 2.088 | 19.47(0.10) | … | (0.14) | … | … | … | (0.17) | (0.10) | … | … | … | |
| Q2059360…………. | 2.507 | 20.21(0.10) | (0.24) | (0.22) | (0.15) | (0.21) | … | … | … | (0.10) | … | ∗ | ∗ |
| Q2116358…………. | 1.996 | 20.06(0.10) | … | (0.16) | … | … | (0.13) | (0.12) | (0.14) | (0.16) | |||
| PSS J21551358….. | 3.142 | 19.94(0.10) | (0.12) | … | … | … | (0.14) | (0.21) | … | … | … | ||
| PSS J21551358c… | 3.565 | 19.37(0.15) | … | (0.20) | (0.16) | … | … | … | (0.19) | ∗ | … | … | … |
| PSS J21551358….. | 4.212 | 19.61(0.10) | (0.13) | (0.13) | (0.11) | … | … | … | (0.20) | (0.25) | … | … | … |
| PSS J23440342….. | 3.882 | 19.50(0.10) | … | (0.13) | (0.12) | … | … | … | (0.15) | ∗ | … | … | … |
| ∗ 4 upper limit (corresponding to non-detections). | |||||||||||||
| c This system is very likely affected by high ionization corrections (see Section 4). | |||||||||||||
| Abundances relative to the solar values of Grevesse & Sauval (1998). | |||||||||||||
References
- [1] Adam G., 1985, A&AS, 61, 225
- [2] Ballester P., Modigliani A., Boitquin O., Cristiani S., Hanuschik R., Kaufer A., Wolf S., 2000, The Messenger, 101, 31
- [3] Bechtold J., 1994, ApJS, 91, 1
- [4] Calura F., Matteucci F., Vladilo G., 2003, MNRAS, 340, 59
- [5] Carswell R. F., Morton D. C., Smith M. G., Stockton A. N., Turnshek D. A., Weymann R. J., 1984, ApJ, 278, 486
- [6] Cen R., Ostriker J. P., 1999, ApJ, 519, L109
- [7] Cen R., Ostriker J.P., Prochaska J.X., Wolfe A.M., 2003, ApJ, submitted [astro-ph/0203524]
- [8] Centurión M., Bonifacio P., Molaro P., Vladilo G., 2000, ApJ, 536, 540
- [9] Dessauges-Zavadsky M., D’Odorico S., McMahon R. G., Molaro P., Ledoux C., Péroux C., Storrie-Lombardi L. J., 2001a, A&A, 370, 426
- [10] Dessauges-Zavadsky M., D’Odorico S., McMahon R. G., Péroux C., 2001b, in Ferlet R., Lemoine M., Desert J.-M., Raban B., eds, XVIIth IAP Colloquium, Frontier Group
- [11] Dessauges-Zavadsky M., Prochaska J. X., D’Odorico S., 2002, A&A, 391, 801
- [12] D’Odorico S., Cristiani S., Dekker H., et al., 2000, in Bergeron J., ed, Proc. SPIE 4005, Bellingham: SPIE, 121
- [13] D’Odorico V, Petitjean P., 2001, A&A, 370, 729
- [14] Ellison S. L., Ryan S. G., Prochaska J. X., 2001, MNRAS, 326, 628
- [15] Ferland G.J., 1997, Hazy, a brief introduction to CLOUDY 94.00, http://www.pa.uky.edu/gary/cloudy
- [16] Foltz C. B., Chaffee F. H. Jr., Hewett P. C., MacAlpine G. M., Turnshek D. A., Weymann R. J., Anderson S. F., 1987, AJ, 94, 1423
- [17] Fontana A., Ballester P., 1995, The Messenger, 80, 37
- [18] Grevesse N., Sauval A.J., 1998, Space Science Reviews, 85, 161
- [19] Haardt F., Madau P., 1996, ApJ, 461, 20
- [20] Haehnelt M. G., Steinmetz M., Rauch M., 1998, ApJ, 495, 647
- [21] Hazard C., Morton D. C., McMahon R. G., Sargent W. L. W., Terlevich R., 1986, MNRAS, 223, 87
- [22] Hewett P. C., Foltz C. B., Chaffee F. H., et al., 1991, AJ, 101, 1121
- [23] Howk J. C., Savage B. D., Fabian D., 1999, ApJ, 525, 253
- [24] Howk J. C., Sembach K. R., 1999, ApJ, 523, L141
- [25] Izotov Y. I., Thuan T. X., 1999, ApJ, 511, 639
- [26] Izotov Y. I., Schaerer D., Charbonnel C., 2001, ApJ, 549, 878
- [27] Jimenez R., Bowen D. V., Matteucci F., 1999, ApJ, 514, L83
- [28] Kim T.-S., Cristiani S., D’Odorico S., 2001, A&A, 373, 757
- [29] Kim T.-S., Cristiani S., D’Odorico S., 2002, A&A, 383, 747
- [30] Lanzetta K. M., Wolfe A. M., Turnshek D. A., 1987, ApJ, 322, 739
- [31] Lanzetta K. M., McMahon, R. G., Wolfe, A. M., Turnshek, D. A., Hazard, C, Lu L., 1991, ApJS, 77 1
- [32] Ledoux C., Petitjean P., Bergeron J., Wampler J., Srianand, R., 1998, A&A, 337, 51
- [33] Levshakov S. A., Dessauges-Zavadsky M., D’Odorico S., Molaro P., 2002, ApJ, 565, 696
- [34] Levshakov S. A., Agafonova I. I., D’Odorico S., Wolfe A. M., Dessauges-Zavadsky M., 2003, ApJ, 582, 596
- [35] Lopez S., Reimers D., Rauch M., Sargent W. L. W., Smette A., 1999, ApJ, 513, 598
- [36] Lopez S., Reimers D., D’Odorico S., Prochaska J. X., 2002, A&A, 385, 778
- [37] Lu L., Wolfe A. M., Turnshek D. A., Lanzetta K. M., 1993, ApJS, 84, 1
- [38] Lu L., Savage B. D., Tripp T. M., Meyer D. M., 1995, ApJ, 447, 597
- [39] Lu L., Sargent W. L. W., Womble D. S., Barlow T. A., 1996a, ApJ, 457, L1
- [40] Lu L., Sargent W. L. W., Barlow T. A., Churchill C. W., Vogt S. S., 1996b, ApJS, 107, 475
- [41] Madau P., Haardt F., Rees M. J., 1999, ApJ, 514, 648
- [42] Matteucci F., Molaro P., Vladilo G., 1997, A&A, 321, 45
- [43] Møller P., Jakobsen P., Perryman M. A. C., 1994, A&A, 287, 719
- [44] Nussbaumer H., Storey P. J., 1986, A&AS, 64, 545
- [45] Pei Y. C., Fall S. M., 1995, ApJ, 454, 69
- [46] Pei Y. C., Fall S. M., Hauser M. G., 1999, ApJ, 522, 604
- [47] Péroux C., Storrie-Lombardi L. J., McMahon R. G., Irwin M., Hook I. M., 2001, AJ, 121, 1799
- [48] Péroux C., Irwin, M., McMahon R. G., Storrie-Lombardi L. J., 2002a, Fusco-Femiano R., Matteucci F., eds, ASP Conf. Proc. 253, 501
- [49] Péroux C., Petitjean P., Aracil B., Srianand R., 2002b, New Astronomy, 7, 577
- [50] Péroux C., McMahon R. G., Storrie-Lombardi L. J., Irwin, M., 2003a, MNRAS, submitted (astro-ph/0107045)
- [51] Péroux C., Dessauges-Zavadsky M., D’Odorico S., Kim T.-S., McMahon R. G., 2003b, MNRAS, accepted [Paper II]
- [52] Petitjean P., Rauch M., Carswell R. F., 1994, A&A, 291, 29
- [53] Petitjean P., Srianand R., Ledoux C., 2000, A&A, 364, L26
- [54] Pettini M., Smith L. J., Hunstead R. W., King D. L., 1994, ApJ, 426, 79
- [55] Pettini M., Ellison S. L., Steidel C. C., Bowen D. V., 1999, ApJ, 510, 576
- [56] Pettini M., Ellison S. L., Bergeron J., Petitjean P., 2002, A&A, 391, 21
- [57] Prochaska J. X., Wolfe A. M., 1996, ApJ, 470, 403
- [58] Prochaska J. X., Wolfe A. M., 1997, ApJ, 474, 140
- [59] Prochaska J. X., Wolfe A. M., 1998, ApJ, 507, 113
- [60] Prochaska J. X., Wolfe A. M., 1999, ApJS, 121, 369
- [61] Prochaska J. X., Wolfe A. M., 2000, ApJ 533, L5
- [62] Prochaska J. X., Gawiser E., Wolfe A. M., 2001, ApJ, 552, 99
- [63] Prochaska J. X., Wolfe A. M., Tytler D., Burles S. M., Cooke J., Gawiser E., Kirkman D., O’Meara J. M., Storrie-Lombardi L. J., 2001, ApJS, 137, 21
- [64] Prochaska J. X., Wolfe A. M., 2002, ApJ, 566, 68
- [65] Prochaska J. X., Howk J. C., O’Meara J. M., Tytler D., Wolfe A. M., Kirkman D., Lubin D., Suzuki N., 2002, ApJ, 571, 693
- [66] Sargent W. L. W., Steidel C. C., Boksenberg A., 1988, ApJS, 68, 539
- [67] Savaglio S., 2000, IAUS, 204, 24
- [68] Songaila A, Cowie L. L., 2002, AJ, 123, 2183
- [69] Storrie-Lombardi L. J., Wolfe, A. M., 2000, ApJ, 543, 552
- [70] Storrie-Lombardi L. J., Irwin M. J., McMahon R. G., Hook I. M., 2001, MNRAS, 322, 933
- [71] Viegas S. M., 1995, MNRAS, 276, 268
- [72] Vladilo G., Bonifacio P., Centurión M., Molaro P., 2000, ApJ, 543, 24
- [73] Vladilo G., Centurión M., Bonifacio P., Howk J. C., 2001, ApJ, 557, 1007
- [74] Wampler E. J., Bergeron J., Petitjean P., 1993, A&A, 273, 15
- [75] Warren S. J., Møller P., Fall S. M., Jakobsen P., 2001, MNRAS, 326, 759
- [76] Warren S. J., Hewett P. C., Osmer P. S., 1991, ApJS, 76, 23
- [77] Wolfe A. M., Turnshek D. A., Smith H. E., Cohen, R. D., 1986, ApJS, 61, 249
- [78] Wolfe A. M., Lanzetta K. M., Foltz C. B., Chaffee F. H., 1995, ApJ, 454, 698