A peculiar type-I X-ray burst from GRS 1747-312
We report the serendipitous detection with the Rossi X-ray Timing Explorer of a long and peculiar X-ray burst whose localization is consistent with one known X-ray burster (GRS 1747-312) and which occurred when that source was otherwise quiescent. The peculiar feature concerns a strong radius expansion of the neutron star photosphere, which occurred not within a few seconds from the start of the burst, as is standard in radius-expansion bursts, but 20 s later. This suggests that two different layers of the neutron star may have undergone thermonuclear runaways: a hydrogen-rich and a hydrogen-poor layer. The reason for the delay may be related to the source being otherwise quiescent.
Key Words.:
accretion, accretion disks – globular clusters: individual: Terzan 6 – X-rays: binaries – X-rays: bursts – X-rays: individual: GRS 1747-3121 Introduction
GRS 1747-312 is a transient X-ray source that is located in the core of the 9.5 kpc distant globular cluster Terzan 6 (Predehl et al. 1991; Pavlinsky et al. 1994; Verbunt et al. 1995; In ’t Zand et al. 2003). The heart of the source is a neutron star in a binary system with a low-mass, Roche lobe filling star. X-ray outbursts occur every 4.5 months and last 1 month; the neutron star is completely eclipsed by the companion star every 12.4 hrs (In ’t Zand et al. 2000, 2003). The neutron star nature was established through the detection of seven type-I X-ray bursts. Such bursts are clear markers of thermonuclear runaway processes on the surfaces of neutron stars (for reviews, see Lewin et al. 1993 and Strohmayer & Bildsten 2003). All bursts were short-lived and occurred while the source was otherwise X-ray active. In April 2002 GRS 1747-312 happened to be in the field of view of the Proportional Counter Array (PCA) on the Rossi X-ray Timing Explorer (RXTE) while it was pointed at another target, and a long type-I X-ray burst was detected with peculiar features that may add to the understanding of unstable nuclear burning on neutron star surfaces. Here we discuss this event.
2 Observations
The PCA (for a detailed description, see Jahoda et al. 1996) on RXTE comprises 5 co-aligned Proportional Counter Units (PCUs) that are sensitive to 2 to 60 keV photons. The total collecting area is 6500 cm2. The spectral resolution is 18% full-width at half maximum (FWHM) at 6 keV and the field of view is 1o FWHM. During April 4 through 30, 2002, the PCA was employed in a target-of-opportunity (ToO) program on the newly discovered accreting millisecond pulsar and transient source XTE J1751-305 (Markwardt et al. 2002) which is located 40′ from GRS 1747-312. The program accumulated 398 ks of net exposure time. GRS 1747-312 was not in outburst during these serendipitous observations. On the very last day of observations an X-ray burst was detected. Figure 1 shows the result of the localization of this burst following a method (Strohmayer et al. 1997) that employs the small misalignments of the three PCUs that were active during the burst (PCUs 0, 2 and 3). While XTE J1751-305 is excluded as the origin of the burst at the % confidence level, the error region is consistent with GRS 1747-312 being the origin. Furthermore, no other X-ray burster is known within the 90% confidence contour. It should be mentioned that the light curve of XTE J1751-305 (see Fig. 1 in Markwardt et al. 2002) shows a small outburst to a level of 0.3 mCrab starting three days before the burst. Given the collimator response to GRS 1747-312 in these observations, this translates to a level of 1.1 mCrab if the outburst would have been due to GRS 1747-312. Since this level is excluded by independent observations of GRS 1747-312 (see Fig. 5 in which 1.1 mCrab is equivalent to 12 phot s-1 per 5 PCUs), GRS 1747-312 is ruled out as the source of the outburst.

3 Time-resolved spectroscopy and timing analysis
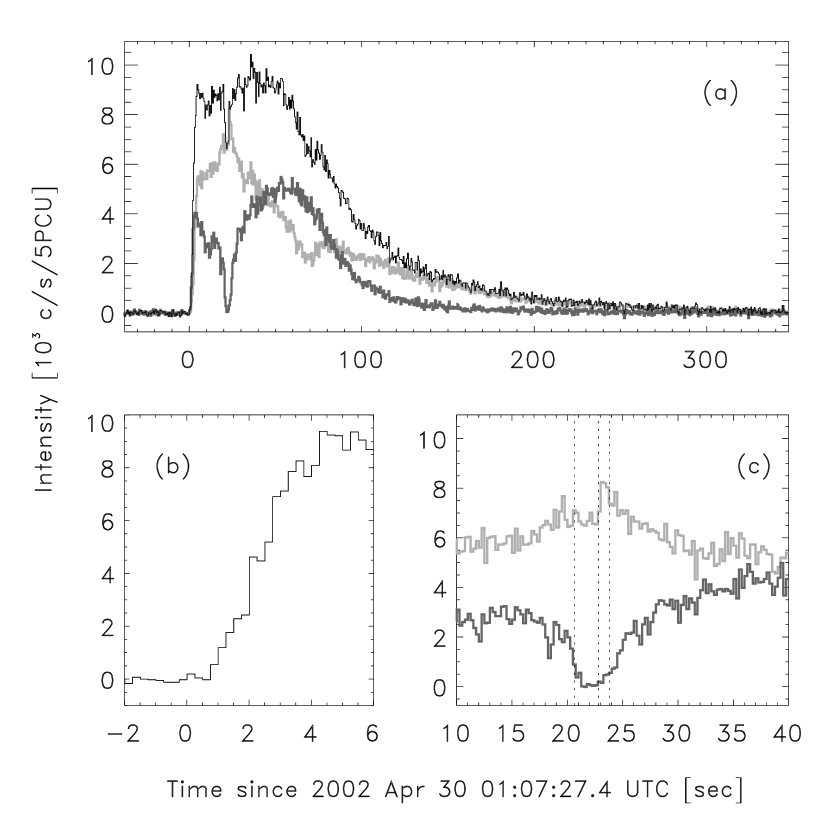
Figure 2 shows the light curve of the burst in various bandpasses. It is characterized by a duration of 320 s and a rise time of 3 s. The full-bandpass light curve shows a plateau for the first 70 s strongly suggesting that the Eddington limit is reached. There is one particularly peculiar feature about this burst: from 18 to 27 s after burst onset, the 10 keV intensity shows a sharp drop, indicating a strong softening of the spectrum.
We generated time-resolved spectra for the burst, from event mode data that have a resolution of 2-13 sec, 64 energy channels, and no layer resolution. The time resolution of the spectra was chosen to vary over the burst, in order to keep the statistical quality of the spectra at an approximately constant level. The time resolution varied from 0.5 to 4.0 s. A background spectrum was determined from data preceding the burst from to s, and a correction was applied for the deadtime. The spectra were, between 3 and 20 keV, fitted with an absorbed single-temperature black body model with varying temperature and normalization. The absorption was modeled following Morrison & McCammon (1983), leaving free one value for the hydrogen column density for all spectra. Furthermore, spectral channels were combined so that each spectral bin contained at least 15 photons, to ensure Gaussian statistics and the applicability of the statistic. The fitted model is satisfactory for all time intervals, except during the brief episode of strong softening. The fit results are presented in Fig. 3. The residuals of the data with respect to the model are shown in Fig. 4 for the two time intervals specified in Fig. 2. In these intervals there is a strong hint of a feature peaking at 5 keV. The residual may be fitted by a broad Gaussian function ( reduces from 11.6 [22 dof] to 1.9 [19 dof]). The model fits to a centroid of 4.9 keV, a FWHM of 1.2 keV, and an intensity of 0.18 phot s-1cm-2. At its peak, approximately 30% of the bolometric flux is predicted to be due to this component. The sudden increase of the keV photon rate at 23 s (see panel (c) in Fig. 2) can be explained by a sudden temperature rise from to keV. Although the Gaussian fit is best, considerable improvement may also be achieved by allowing to vary; reduces to 2.9 (21 dof) and goes to cm-2. However, the inferred radius then becomes excessively large at 1.7 km at 9.5 kpc.
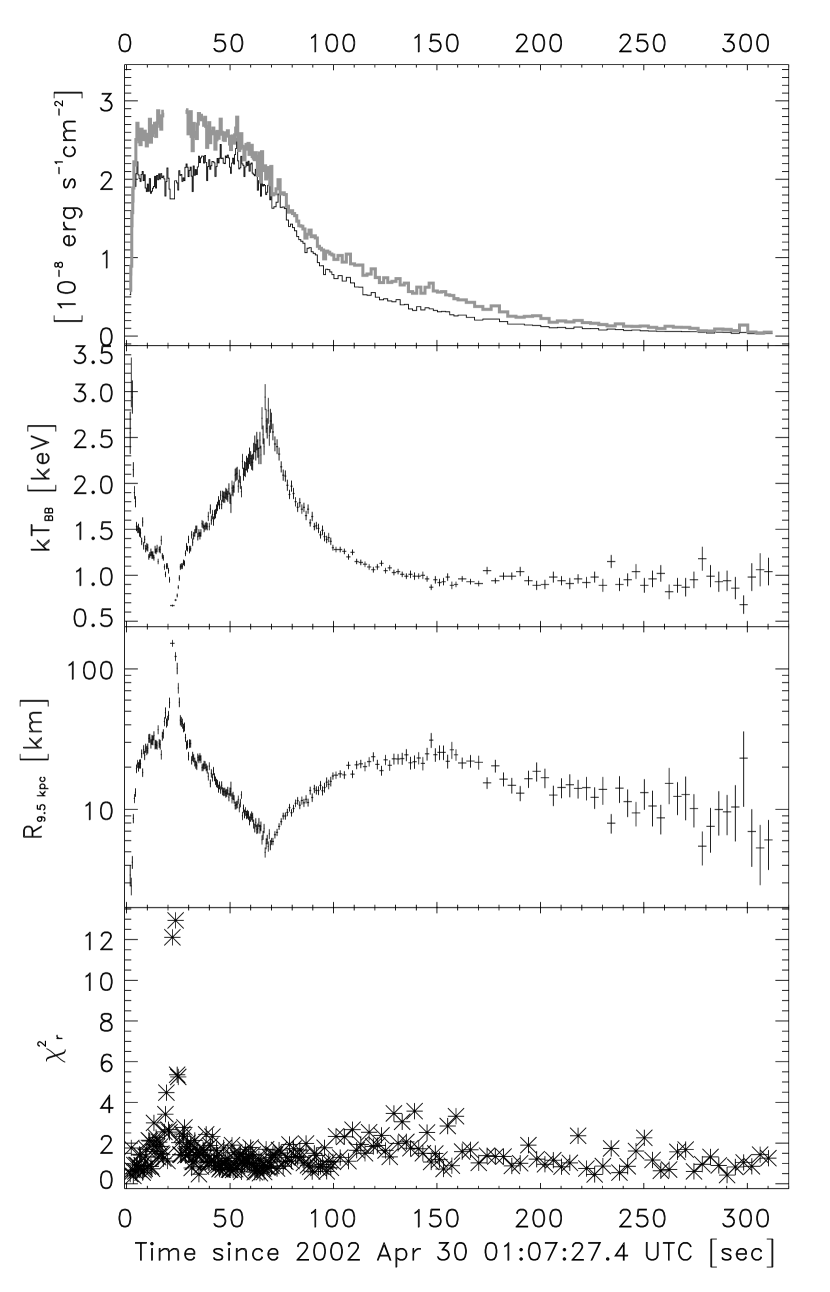

The fit results show a strongly varying blackbody radius, with a peak-to-peak variation of at least a factor of 40, that is anti-correlated with the temperature variation. During the first 70 s this is accompanied by a fairly constant luminosity. This is a clear detection of photospheric radius expansion (PRE) due to near-Eddington luminosities. The radius increase beyond 70 s goes with a decay in luminosity. This is often seen in PRE bursts and is assumed to be related to non-Planckian spectra (e.g., Kaptein et al. 2000, van Straaten et al. 2001). It is not thought to be related to true radius expansion. At the end of the burst, the radius decreases to a similar level as in the bursts that have been detected with the PCA when GRS 1747-312 was active (In ’t Zand et al. 2003).
During the brief episode of strong softening, the expansion is strongest. Given the fact that this appears to be an isolated event, the suggestion is strong that in fact we are dealing with two different phases of radius expansion: the slow 70 s lasting expansion with a factor of a few, and the fast 8 s lasting expansion with a factor of a few tens.
During the fast radius expansion, the temperature drops significantly below the low-energy threshold of the instrument and a significant fraction of blackbody radiation escapes detection. Consequently, measurements of the radius and bolometric flux become rather inaccurate, particularly if one would chose to leave free (which was not done in the analysis shown in Fig. 3). The bolometric flux saturates during the first 70 s of the burst at a level of about 2.5 erg cm-2s-1 (bolometric), disregarding the fast radius expansion phase during which bolometric corrections are too inaccurate.
We note that no burst oscillations were detected during this burst. The upper limit to the amplitude is 16% on a timescale of 4 s (combining the data from PCUs 0, 2 and 3; for details on the method, see In ’t Zand et al. 2003).
The burst lasted at least ten times longer ( s to reach the background level) than the other four bursts that were detected from GRS 1747-312 with the PCA (durations between 10 and 32 s; In ’t Zand et al. 2003). However, the peak flux is, within 20%, identical to the brightest PRE burst of the other four. This supports the association of the burst with GRS 1747-312, as does the fact that its longevity is expected for low accretion rates from hydrogen-rich donors (e.g., Fujimoto et al. 1981). GRS 1747-312 was not in outburst during the burst. The prior outburst was last detected above 1 mCrab 26 days earlier and the following outburst started 28 days afterwards (see Fig. 5). The accretion rate is suggested to have been a factor of at least 40 smaller than during the peak of the outbursts. Similar behavior was observed in other bursters as well, for instance SAX J1808.4-3658 (In ’t Zand et al. 2001) and 2S 1711-339 (Cornelisse et al. 2002).
4 Discussion
The burst has a relatively strong photospheric radius expansion. Such bursts, with forty-fold or more expansion, are rather rare. We are aware of four other bursters that exhibit such strong radius expansion and, remarkably, three are located in globular clusters: 2S 1715-321 (Hoffman et al. 1978; Tawara et al. 1984), 4U 2129+11 in M15 (Van Paradijs et al. 1990; Smale 2001), 4U 1724-307 in Terzan 2 (Molkov et al. 2000) and 4U 1820-303 in NGC 6624 (Strohmayer & Brown 2002). The bursts from 4U 1724-307 occur much more frequently than in the other sources, about once every 4 days (Kuulkers et al. 2003). Additionally, one burst with a strong expansion was observed from an ill-determined position and identification with a particular source was impossible (Hoffman et al. 1978; Lewin et al. 1984). The expansions seen with the PCA in 4U 1724-307 and 4U 1820-303 were so strong that no radiation remained in the bandpass, not even the persistent emission otherwise present for these sources.
What sets the burst from GRS 1747-312 apart from the other aforementioned bursts is that the strong expansion phase did not occur at the start of the burst, but is delayed by 20 s. It lasted less than 10 s while (Eddington-limited) fluxes appear to remain at the same level within 30% from 20 s before to 35 s after the strong radius expansion. Thus, the suggestion is strong that there must have been an extra radiation pulse for 10 s whose energy was immediately transformed to kinetic energy of a quickly expanding photosphere. We propose that this extra energy is due to a thermonuclear flash which occurred in a separate and deeper layer than the one where the long flash originated. The duration suggests that this separate layer consisted of hydrogen-poor material. The layer may have formed either through stable hydrogen burning during the previous outburst or (invisible) unstable hydrogen burning after that (Fujimoto et al. 1981). In the latter case, low-level accretion must have been going on after the outburst.
What physical process or circumstance is responsible for the unprecedented delay? A strong hint is provided by one characteristic which sets GRS 1747-312 apart from the others: GRS 1747-312 is in quiescence, while the other sources are persistently bright. The difference in luminosity is at least a factor of 10 (ranging from an upper limit of erg s-1 in GRS 1747-312, see Fig. 5, through erg s-1 for 4U 1724-307 [Molkov et al. 2000] and 4U 2129+11 [Van Paradijs et al. 1990] to erg s-1 for 4U 1820-303 [Strohmayer & Brown 2002]). The lower accretion rate in GRS 1747-312 implies that the temperature in the upper neutron star layers is lower. This may delay the ignition conditions for the helium layer. Perhaps this is related to a relatively slow onset of the second convection stage that is predicted to occur in these types of X-ray bursts following the growth of 3 reactions in the accreted layer (Hanawa & Fujimoto 1986).
The results on GRS 1747-312 put the other bursts with strong expansion phases into a new perspective. The strong radius expansion phases that were detected in 4U 2129+11 (Van Paradijs et al. 1990) and 4U 1724-307 (Molkov et al. 2000) are accompanied by a prolonged but smaller expansion afterwards. Thus, there is the suggestion that also in these bursts two separate layers may be ignited. This was perhaps not recognized previously in the literature, because in those cases the two layers ignited near-to simultaneously.
We note that long flashes (i.e., longer than 2 min) without strong radius expansion have been observed in several low-luminosity systems (e.g., Kaptein et al. 2000, In ’t Zand et al. 2002). Perhaps in these systems the accretion rate never becomes high enough to induce stable hydrogen burning in the upper layers. Thus, a pure helium layer is less likely to be present in these systems, precluding the potential of a strong radius expansion.

The burst from GRS 1747-312 is fundamentally different from another peculiar burst from 4U 1636-536 which was observed in August 1985 (Van Paradijs et al. 1986). This 1-min long burst was triple peaked with the third peak occurring 13 s after the first peak and the peak fluxes of similar magnitude but at least a factor of four below the Eddington limit. No photospheric radius expansion was detected. Van Paradijs et al. speculate that this behavior is due to recurrent energy release in quick succession at different locations on the surface of the neutron star.
Another interesting detail about this burst is that it apparently exhibited broad line emission. The nature of this feature is unclear; the centroid energy of 4.8 keV is not coincident with that of any known transition of an abundant element, Also, it requires unexplainable redshifts from the Fe-K complex, particularly since the photosphere radius is large when this feature was present, and we are apprehensive to attribute it to Fe-K emission although such emission was occasionally seen in other bursts (e.g., in the superburst of 4U 1820-303, see Strohmayer & Brown 2002). Interestingly, this is not the first time that such a broad emission feature has been seen in a burst at this energy. The analysis by Van Paradijs et al. (1990) of the burst from 4U 2129+11 in M15 showed severe expansion of at least a factor of 80 and during the strongest phase of the expansion, a broad emission feature was apparent that extended from 4 to 8 keV. They exclude explanations that involve a broad emission line, reflection and Comptonization.
Acknowledgements.
We thank Ed Brown and Walter Lewin for useful discussions.References
- (1) Cornelisse, R., Verbunt, F., in ’t Zand, J.J.M., et al. 2002, A&A, 392, 885
- (2) Fujimoto, M.Y., Hanawa, T., & Miyaji, S. 1981, ApJ, 247, 267
- (3) Hanawa, T., & Fujimoto, M.Y. 1986, PASJ, 38, 13
- (4) Hoffman, J.A., Lewin, W.H.G., Doty, J., Jernigan, J.G., Haney, M., & Richardson, J.A. 1978, ApJ 221, L57
- (5) In ’t Zand, J.J.M. 2001, In Proc. 4th INTEGRAL workshop (Sep. 2000, Alicante, Spain), eds. A, Giminez, V. Reglero & C. Winkler, 463
- (6) In ’t Zand, J.J.M., Kuulkers, E., Bazzano, A., et al. 2000, A&A, 355, 145
- (7) In ’t Zand, J.J.M., Verbunt, F., Kuulkers, E., et al. 2002, A&A, 389, L43
- (8) In ’t Zand, J.J.M., Hulleman, F., Markwardt, C.B., et al. 2003, A&A, in press (astro-ph/0302417)
- (9) Jahoda, K., Swank, J.H., Stark, M.J., et al. 1996, Proc. SPIE, 2808, 59
- (10) Kaptein, R.G., In ’t Zand, J.J.M., Kuulkers, E., Verbunt, F., Heise, J., & Cornelisse, R. 2000, A&A, 358, L71
- (11) Kuulkers, E., den Hartog, P.R., In ’t Zand, J.J.M., Verbunt, F.W.M., Harris, W.E., & Cocchi, M. 2003, A&A, 399, 663
- (12) Lewin, W.H.G., Vacca, W.D., & Basinska, E.M. 1984, ApJ 277, L57
- (13) Lewin, W.H.G., van Paradijs, J., & Taam, R.E. 1993, Space Sci. Rev., 62, 223
- (14) Markwardt, C.B., Swank, J., Strohmayer, T.E., In ’t Zand, J.J.M. & Marshall, F.E. 2002, ApJ, 575, L21
- (15) Markwardt, C.B., & Swank, J. 2002, presented at the April 2002 meeting of the High-Energy Astrophysics Division meeting in Albuquerque, abstract X11.007
- (16) Molkov, S.V., Grebenev, S.A., & Lutovinov, A.A. 2000, A&A, 357, L41
- (17) Morrison R., & McCammon D. 1983, ApJ 270, 119
- (18) Pavlinsky, M.N., Grebenev, S.A., & Sunyaev, R.A. 1994, ApJ, 425, 110
- (19) Predehl, P., Hasinger, G., & Verbunt, F. 1991, A&A, 246, L21
- (20) Smale, A. 2001, ApJ, 562, 957
- (21) Strohmayer, T.E., Jahoda, K., Giles, A.B., & Lee, U. 1997, ApJ, 486, 355
- (22) Strohmayer, T.E., & Brown, E. 2002, ApJ, 566, 1042
- (23) Strohmayer, T.E., & Bildsten, L. 2003, in Compact Stellar X-Ray Sources, eds. W.H.G. Lewin and M. van der Klis, Cambridge University Press, in press (astro-ph/0301544)
- (24) Swank, J., & Markwardt, C. 2001, In Proc. “New Century of X-ray Astronomy”, eds. H. Inoue & H. Kunieda, PASP Conf. Ser., p. 94
- (25) Tawara, Y., Hayakawa, S., & Kii, T. 1984, PASJ 36, 845
- (26) Van Paradijs, J., Sztajno, M., Lewin, W.H.G., Trümper, J., Vacca, W.D., & van der Klis, M. 1986, 221, 617
- (27) Van Paradijs, J., Dotani, T., Tanaka, Y., & Tsuru, T. 1990, MNRAS, 42, 633
- (28) Van Straaten, S., van der Klis, M., Kuulkers, E., & Méndez 2001, ApJ, 551, 907
- (29) Verbunt, F., Bunk, W., Hasinger, G., & Johnston, H.M. 1995, A&A, 300, 732