Host Galaxies of low z Radio-loud Quasars: A search of HST archives.111Based on observations with the NASA/ESA Hubble Space Telescope, obtained at the Space Telescope Science Institute, which is operated by the Association of Universities for Research in Astronomy, Inc., under NASA contract NAS 5-26555
Abstract
We searched the HST archives for unpublished WFPC2 images of low redshift (z 0.5) radio loud quasars (RLQ). This led to the identification of 11 objects. We present here the results of the analysis of these images from which we derive the properties of their host galaxies. All objects are clearly resolved and their surrounding nebulosity is consistent with an elliptical galaxy model. These new data, together with previous published HST observations, form a sample of 34 sources which significantly expands all previous studies of low redshift RLQ based on HST data. For this full sample we derive the average absolute magnitude of the host galaxies , and the effective radius kpc. No significant correlation is found between the nucleus and the host galaxy luminosity. Using the relationship between black hole mass () and bulge luminosity we investigate the relation between and total radio power for RLQ and compare with other classes of radio sources. The overall distribution of AGN in the plane -Pradio exhibits a trend for increasing with increasing Pradio but with a substantial spread. RLQ occupy the region of most powerful sources and most massive BH. The quasars appear to emit over a wide range of power with respect to their Eddington luminosity as deduced by the estimated .
1 Introduction
Extended nebulosities around quasars were investigated by several groups using various facilities from the ground (e.g. Hutchings et al, 1989, Veron-Cetty & Woltjer, 1990, McLeod & Rieke, 1994, Taylor et al, 1996, Kotilainen & Falomo, 2000). All together these works have confirmed the presence of the host galaxies. However their full characterization has been always problematic because the extreme luminosities of quasars tended to outshine the surrounding faint nebulosity. In fact the ability to measure the global parameters of the host galaxy depends on the shape of the point spread function (PSF), throughput of the instrument, also on the distance and on the nuclear-to-host ratio of the sources. A significant gain to cope with these problems was obtained from high quality (sub-arcsec) imaging secured in the near-IR where the contrast between nucleus and host become more favorable. Nevertheless, the non-homogeneity of ground based data and the modest number of studied sources have prevented to produce a satisfactory picture of the properties of the quasar hosts. In particular the issue of distinguishing between elliptical and spiral/disc galaxies remained unsettled.
A major impetus in this field came from the observations obtained with Hubble Space Telescope (HST). This is because its narrow PSF allows one to distinguish with unprecedented clearness the host galaxy from the nucleus. The advantage is especially important for low redshift (z 0.5) objects where the signal from the host galaxy is sufficiently high, while at high redshift, in spite of the excellent PSF, the small throughput of the 2.5m aperture telescope becomes the main limitation for these studies. This kind of programs was indeed among the original scientific motivations of the HST project.
Thus far a number of projects aimed at the study of QSO hosts at low redshift have been performed with HST (Bahcall et al, 1997; Hooper et al, 1997; Boyce et al, 1998; Kirhakos et al 1999; Dunlop et al, 2003). These images indicate that Radio Loud Quasars (RLQs) hosts are giant ellipticals, while Radio Quiet Quasars (RQQs) are hosted both in ellipticals and spirals. Although the samples of investigated RLQ and RQQ are still small and rarely defined in a homogeneous way there is a clear tendency for RLQ hosts to be more luminous (by 0.5 mag) with respect to the RQQ hosts (Veron-Cetty & Woltjer, 1990; Dunlop et al, 2003; Falomo et al 2003b, ).
Because of the association of RLQ with massive spheroids these sources have received particular attention since from the properties of their host galaxy one can estimate the mass of the central black hole () using the relationship between and bulge luminosity (e.g. Kormendy & Gebhardt, 2001) derived from nearby galaxies with measured BH masses and assuming that the relations holds unchanged up to z 0.5.
In order to improve the size of the sample and to explore a wider range of properties of RLQs we searched the HST archive for unpublished images of low redshift quasars, finding images for 11 objects. In this work we present the results of the image analysis of these objects and in particular derive the properties of their host galaxies. The new data on RLQ host galaxies are then combined with previous published results in order to form the largest (34 sources) and homogeneous data set of RLQ hosts investigated by HST. We discuss here the properties of the full sample. In order to be consistent with our previous papers we choose H0=50km sec-1 Mpc-1, q0=0.
2 Object selection and data analysis
We carried on a search for non-proprietary images of RLQ obtained with WFPC2 from the HST Archive. To this aim the AGN catalogue of Veron-Cetty & Veron, 2001 was cross correlated with the HST-WFPC2 pointings using Multi mission Archive at Space Telescope (MAST, http://archive.stsci.edu/index.html) to find out all possible observed sources which were unpublished at the time of the search or where the issue of the host galaxy properties was not examined. We considered only objects with , MB -23.0 and exposures longer than 200 sec. The result of this search produced a total of 11 objects satisfying the above criteria (see Table 1).
These objects are distributed in the redshift range z= 0.184 to z=0.425 (average = 0.346 0.083). The distribution of the objects over the plane – MB is shown in Fig. 1 and compared with previous published objects. The 11 objects span a range in nuclear luminosity from MB = -23.1 to MB = -26.9.
For each object HST archive observations include typically 3-4 individual images of the quasar calibrated using the HST-WFPC2 pipeline. These were combined with the IRAF task CRREJ to remove cosmic rays and improve the signal to noise ratio. The analysis of the QSO images followed the procedures described in Scarpa et al, 2000 for the study of host galaxies of BL Lac objects. In particular we have extracted the azimuthally averaged radial profile of each object after masking any region that are contaminated by companion objects. This procedure offers the advantage to improve significantly the S/N, allowing to extend the photometry to larger radii but on the other hand two dimensional information is lost. Since our main aim here is to derive the global properties (morphology, luminosity and scale length) of the host galaxies this approach is appropriate.
The key ingredient for the optimal decomposition of the QSO profiles is the choice of the point spread function (PSF). It is well known that while the inner part (radius 2 arcsec) of the PSF can be properly modeled by a specific software (Tiny Tim, hereafter TT; Krist & Hook, 1999) the external fainter halo produced by the scattered light cannot. Therefore as in Scarpa et al, 2000 we adopted here a composite PSF, adding to the TT PSF an additional smooth component to take into account the effect of the scattered light. The latter component gives a significant contribution to the wings of the PSF at radii larger than 2-3 arcsec. Since the signal from our targets may extend up to 5 arcsec from the nucleus, neglecting this contribution for the wings of the PSF may produce spurious host galaxy images (see an example in Pian et al, 2002). The smooth component is modelled by an exponential law and has been adjusted in such a way to yield a good representation of the radial brightness profiles of stars observed by WFPC2. Since the original observations refer to different filters and cameras we adopted the above procedure to obtain a representative PSF for each camera/filter combination. In Figure 2 we show an example of the adopted PSF, compared with that derived solely from TT model and with the average radial profiles of stars.
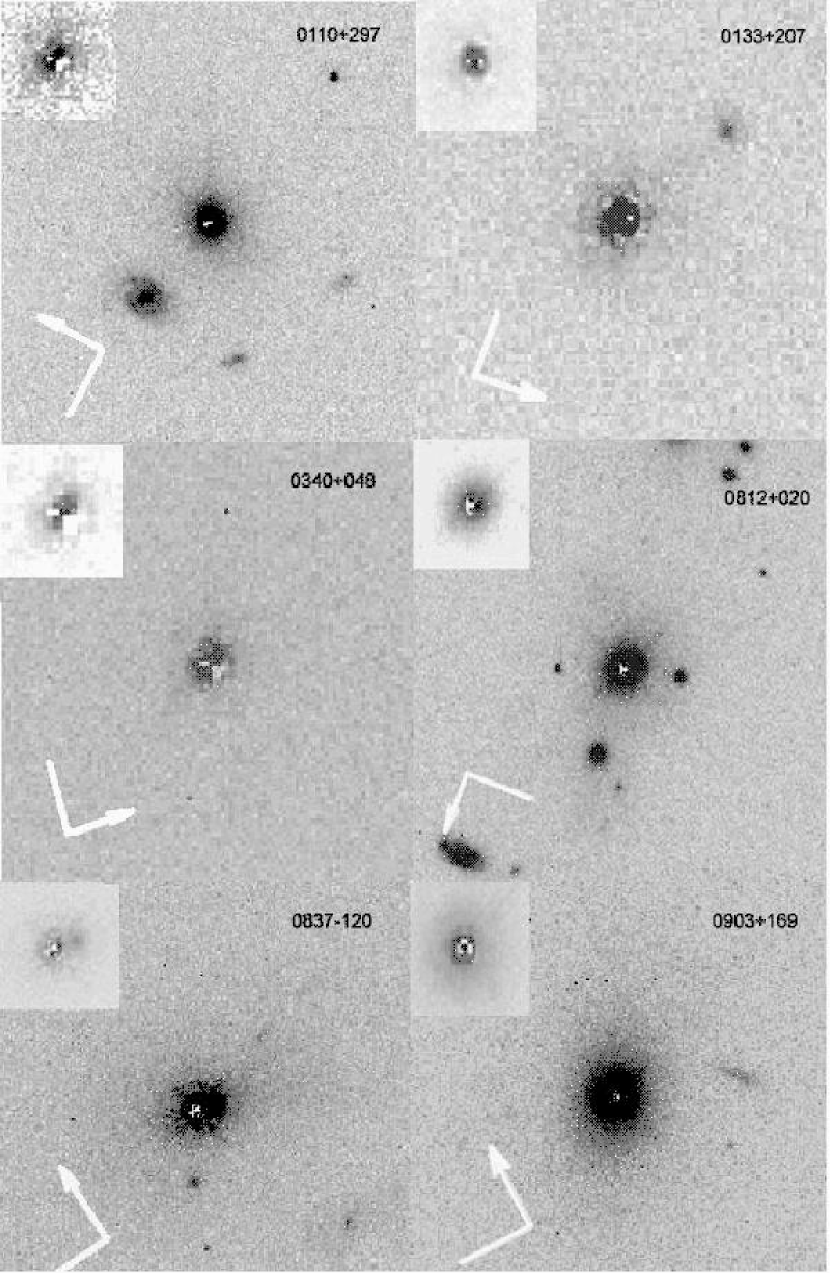
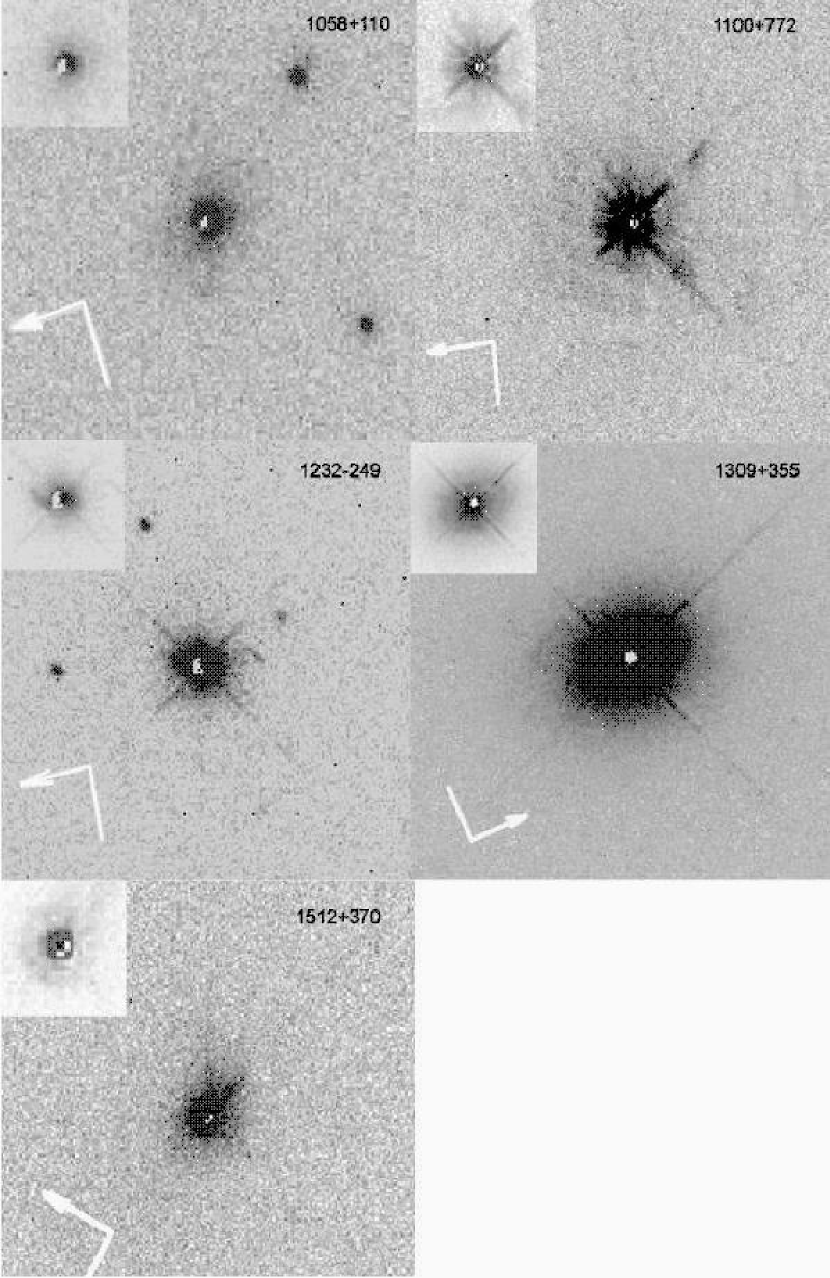
In Figure 3 we show the images of the quasars after subtraction of a scaled PSF. The normalization of the PSF was set to match the flux of the observed target in an annulus of external radius 0.4 arcsec and excluding the pixels within 0.1 arcsec from the center of each object. These PSF subtracted images give an idea of the extended component and the immediate environment of the quasars. In most cases the nebulosity appears smooth and with a round shape. No clear signature of spiral structures is detected in agreement with previous HST studies of RLQ hosts.
To determine the parameters of the quasar hosts we modelled the observed radial brightness profile of each quasar image by superposing a central point source (modelled by the PSF) to a galaxy model (an elliptical or an exponential disk) convolved with its proper PSF. The fit implies three free parameters (normalization of the PSF and galaxy model plus the scale length of the host galaxy). The best decomposition was obtained by a minimization algorithm varying the three parameters (see Table 2). We applied this procedure for both models (elliptical and disk galaxies) and found that in all cases the fit with an elliptical is better or very close to that of a disk model. In no case a significantly better fit with a disk model was obtained. Therefore, in agreement with previous studies of RLQ and with appearance of the sources in the images, we adopt the parameters of an elliptical galaxy model in the following discussion.
The results of the fit are reported in Table 2. Since the observations pertain to different filters we have transformed all apparent magnitudes into the R (Cousins) standard band. To do this we used the prescription reported by Holtzman et al., 1995 where the magnitudes in the HST filters (F555W, F606W, F702W, F814W) are converted into the Johnson-Cousin system in the V, R and I band. We also applied a correction () to make the zero points, obtained within arcsec radius aperture, applicable for surface photometry (Holtzman et al., 1995. To obtain uniform and comparable results apparent magnitudes are then converted to R(Cousin) filter assuming V-R=0.61 R-I=0.70 (Fukugita et al, 1995).
The uncertainty on each parameter has been evaluated from its variation within the map of two parameters and assuming a = 2.7. The typical uncertainty for the host and nucleus luminosity is 0.3 mag. On the other hand, consistently with previous works (e.g. Urry et al, 2000; Dunlop et al, 2003; Falomo et al 2003b, ) we find that the magnitude of the hosts are much better constrained than their effective radii, for which the uncertainty can be as large as 50%.
3 Results
All the quasars in the considered sample (see Table 1) are well resolved. In Figure 4 we show for each object the radial brightness profile together with its best fit with the elliptical model.
To check the consistency of our adopted procedure with that of previous studies using a two dimensional fitting procedure, we have analyzed some RLQ observed with HST by Dunlop et al, 2003. Of the 10 RLQ examined by these authors we randomly chose 5 objects (1020-103, 1217+023, 2135-147, 2141+175, 2247+140) and found the apparent magnitude of the host galaxy always agrees within m =0.2 and the effective radii within 30%.
Using the parameters of the fit reported in Table 2 we derived the absolute magnitudes and effective radii of the host galaxies (see Table 3). These absolute magnitudes have been corrected for galactic extinction (Schlegel et al, 1998), and k-corrected following Poggianti, 1997. Nuclear luminosities have been k-corrected using the relationship ( = 0.3) and color corrected using data from Cristiani & Vio, 1990.
3.1 The average properties of the host galaxies of RLQ
In order to investigate the properties of the host galaxies of low redshift RLQ we have combined the new 11 objects discussed in this paper with previous data already published in the literature. The whole data set has been treated homogeneously in terms of cosmology, k - correction, filter and galactic extinction as specified above.
To the objects presented here we added the 18 RLQ observed by Bahcall et al, 1997, Boyce et al, 1998 and Dunlop et al, 2003 which were treated homogeneously by Falomo et al 2003a. Moreover we included the five RLQ at z 0.5 studied by Hooper et al, 1997. For the latter we used the reported R apparent magnitudes and transformed them into absolute quantities following our procedure.
The final combined sample consists of 34 objects which is up to now the largest sample of RLQ observed by HST. The main properties of these sources are given in Table 3. Although the sample cannot be considered complete because original selections were not homogeneous and in some cases not well defined, we belive that there is no significant bias as far as the host galaxy properties are concerned. Therefore we are confident that these sources can yield a trusty picture of the general properties of RLQ hosts at low redshift.
We find that the average absolute mag of the full sample of RLQ is , and the effective radius = 10.53.7 kpc. The distributions of the absolute magnitudes and of the effective radii of the host galaxies are shown in Fig 5. This result confirms that on average the host of RLQ are large and massive ellipticals the luminosity of which is in the range between 2 to 5 L∗ where L∗ is the characteristic luminosity of a Schechter function for ellipticals (Metcalfe et al, 1998)
3.2 Host versus nuclear luminosity
The ratio between the nucleus and host galaxy luminosity in the R band ranges between 0.3 and 16 with an average value of 3 (see also Figure 5). A controversial issue concerning a possible relation between nuclear and host galaxy luminosities has emerged from the analysis of resolved quasars. This relation could be expected if one assumes that the nucleus is emitting at a fixed ratio of the Eddington luminosity and that the mass of the central black hole is linked with the host luminosity. Claims of a positive correlations between the two quantities have been proposed by Hooper et al, 1997 on the basis of HST quasar images of both RLQ and RQQ. However, this was not confirmed by other authors using different (but still small) samples (e.g. Dunlop et al, 2003). Moreover it is worth to note that part of the correlation found by Hooper et al, 1997 is due to the systematic difference of absolute magnitudes between RLQ and RQQ hosts.
Using our data set for 34 RLQ hosts, that covers a wide range of data in the plane Mnuc - Mhost, we have investigated this issue. In Figure 6 we report the points for the full sample of RLQ. The luminosity of the nucleus is distributed over 4 magnitudes while that of the host galaxies remains confined within 1 mag around 3L∗. We do not find a significant correlation between Mnuc and Mhost as indicated by the Spearman rank correlation test that yields RS=0.24.
Using the relationship between and the bulge luminosity by Bettoni et al, 2003 we have computed the of each quasar (and therefore its Eddington luminosity) and compared it with the bolometric luminosity of the nucleus. To transform the observed nuclear luminosity in the R band into bolometric luminosity we adopted a fixed correction of L LR where LR is the monochromatic luminosity of the nuclei in the R band (Laor & Draine, 1993). The of RLQ covers the interval between to (). In Figure 7 we report the estimated bolometric luminosity of the quasars in the sample versus . It turns out that these objects are emitting with a wide range of Eddington factor (), from to values very close () to L=LEdd. The dispersion of is larger than that expected from the uncertainties of determination of BH masses . Therefore if the scatter of the bolometric correction is small, this suggests that the lack of correlation between nucleus and host luminosity is due to an intrinsic spread of .
3.3 Relation between and radio power
Basing on a small number of nearby galaxies with known BH masses it was suggested by Franceschini et al, 1998 that scales with the total radio luminosity at 5 GHz ( ). This correlation appears to hold over 3 order of magnitudes for and, given its steepness, it was proposed as a tool to predict from the radio flux. A similar link between and in various types of active galaxies was claimed by Laor, 2001 and Lacy et al, 2001. However, a recent analysis by Ho, 2002 of this relationship indicated that is only loosely related with the radio power.
In Figure 8 we show the data for our sample of RLQs in the plane (total) together with other samples of galaxies at various levels of nuclear activity investigated by Ho, 2002 and Oshlack et al, 2002 and low redshift radio-galaxies (Bettoni et al, 2003). For RLQs we found no correlation between the two quantities (Spearman correlation coefficient RS=0.21). The overall distribution of the AGN in the plane -Prad exhibits a trend of larger radio power for increasing but with a very large spread (4–5 orders of magnitude). The FSRQ data (Oshlack et al, 2002), which appear to deviate from the overall plot, may become consistent with the above trend if the nuclear flux is corrected for Doppler boosting. Since these BH masses have been inferred from Hβ width the possible effects of orientation, related to a disk geometry of the line emitting region, could shift the FSRQ points in Figure 8 to the right (Jarvis & McLure, 2002).
4 Conclusions
We have presented the results from the analysis of 11 unpublished WFPC2 images of low redshift RLQ retrieved from HST archive. These data, together with previous HST observations allow us to construct a homogeneous data set of 34 RLQ for z0.5.
The main conclusions of this study are:
1) all RLQ are hosted in massive elliptical galaxies with luminosity in the range 2 to 5 L∗. The average absolute magnitude in the R band .
2) converting the host galaxy bulge luminosity into BH masses it is found that RLQ contain supermassive BH of 108.6 to 109.6
3) no significant correlation is present between the host and nucleus luminosities; this suggests that the nuclei are emitting in a large range of regimes, from 1% to 100% of their Eddington luminosity.
4) the radio power of RLQ is not correlated with the central BH mass; the objects occupy the region of most powerful sources and most massive BH in the overall trend of AGN in the - plane.
Acknowledgments
This work was partly supported by the Italian Ministry for University and Research (MURST) under COFIN 2001/028773, ASI-IR 115 and ASI-IR 35, ASI I/R/086/02. This research has made use of the NASA/IPAC Extragalactic Database (NED) which is operated by the Jet Propulsion Laboratory, California Institute of Technology, under contract with the National Aeronautics and Space Administration.
References
- Bahcall et al (1997) Bahcall, J.N., Kirhakos, S., Saxe, D.H., Schneider, D.P. 1997, ApJ, 479, 642
- Bettoni et al (2003) Bettoni, D., Falomo, R., Fasano, G., Govoni, F. 2003, A&A, 399, 869
- Boyce et al (1998) Boyce, P.J., Disney, M.J., Blades, J.C. et al. 1998, MNRAS, 298,121
- Cristiani & Vio (1990) Cristiani, S., Vio, R. 1990, A&A, 227, 385
- Dunlop et al (2003) Dunlop, J.S., McLure, R.J., Kukula, M.J., Baum, S.A., O’Dea C.P., Hughes, D.H. 2003, MNRAS, 340, 1095
- Falomo et al (2001) Falomo, R., Kotilainen, J.K., Treves, A. 2001, ApJ, 547, 124
- (7) Falomo, R., Carangelo, N., Treves, A. 2003a, MNRAS, in press
- (8) Falomo, R., Kotilainen, J.K., Pagani, C., Scarpa, R., Treves, A. 2003b, ApJ, submitted
- Franceschini et al (1998) Franceschini, A., Vercellone, S., Fabian, A. C. 1998, MNRAS, 297, 817
- Fukugita et al (1995) Fukugita, M., Shimasaku, K., Ichikawa, T. 1995, PASP, 107, 945
- Ho (2002) Ho, L.C. 2002, ApJ, 564, 120
- Holtzman et al. (1995) Holtzman, J.A., Burrows, C.J., Casertano, S., Hester, J.J., Trauger, J.T., Watson, A.M., Worthey, G. 1995, PASP, 107, 1055
- Hooper et al (1997) Hooper, E.J., Impey, C.D., Foltz, C.B. 1997, ApJ, 480, L95
- Hutchings et al (1989) Hutchings, J.B., Janson, T., Neff, S.G. 1989, ApJ, 342,660
- Jarvis & McLure (2002) Jarvis, M.J., McLure, R.J. 2002, MNRAS, 336, L38
- Kirhakos et al (1999) Kirhakos, S., Bahcall, J.H., Schneider, D.P., Kristian J., 1999, ApJ 520, 67
- Kotilainen & Falomo (2000) Kotilainen, J.K., Falomo, R. 2000, A&A, 364, 70
- Kormendy & Gebhardt (2001) Kormendy J. & Gebhardt K. 2001, AIP conference proceedings, 586, 363
- Krist & Hook (1999) Krist, J., Hook, R. 1999, “The Tiny Tim Users’Guide”
- Lacy et al (2001) Lacy, M., Laurent-Muehleisen, S. A., Ridgway, S. E., Becker, R.H., White, R.L. 2001, ApJ, 551, L17
- Laor (2001) Laor, A. 2001, ApJ, 553, 677L
- Laor & Draine (1993) Laor, A., Draine, B.T. 1993, ApJ, 402, 441
- McLeod & Rieke (1994) McLeod, K.K., Rieke, G.H. 1994, ApJ, 454, L77
- McLure et al (1999) McLure, R.J., Kukula, M.J., Dunlop, J.S., Baum, S.A., O’Dea, C.P., Huges, D.H. 1999, MNRAS, 263, 560
- Metcalfe et al (1998) Metcalfe, N., Ratcliffe, A., Shanks, T., Fong, R. 1998, MNRAS, 294, 147
- Oshlack et al (2002) Oshlack, A. Y. K. N., Webster, R. L., Whiting, M. T. 2002, ApJ, 576, 810
- Pian et al (2002) Pian, E., Falomo, R., Hartman, R. C., Maraschi, L., Tavecchio, F., Tornikoski, M., Treves, A., Urry, C. M., Ballo, L., Mukherjee, R. 2002, A&A, 392, 407
- Poggianti (1997) Poggianti, B.M., 1997, A&AS, 122, 399
- Scarpa et al (2000) Scarpa, R., Urry, C.M., Falomo, R., Pesce, J.E., Webster, R., O’Dowd, M., Treves, A. 2000, ApJ, 532, 740
- Schlegel et al (1998) Schlegel, D. J., Finkbeiner, D. P., Davis, M. 1998, ApJ, 500, 525
- Taylor et al (1996) Taylor G.L., Dunlop J.S., Hughes D.H., Robson E.I. 1996, MNRAS, 283, 930
- Urry et al (2000) Urry, M., Scarpa, R., O’Dowd, M., Falomo, R., Pesce, J.E., Treves, A. 2000, ApJ, 532, 816
- Veron-Cetty & Woltjer (1990) Veron-Cetty M.P., Woltjer L. 1990, A&A, 236, 69
- Veron-Cetty & Veron (2001) Veron-Cetty M.P., Veron P. 2001, A&A, 374, 92
| Name | Alias | z | RA | DEC | aaQSO magnitudes in V filter from the Veron-Cetty & Veron, 2001 catalogue; | Filter | CAMbbPosition of the QSO on the WFPC2: PC1=Planetary Camera, WF2=Camera 2, WF3=Camera 3; | Texp | PIccPrincipal Investigator (PI) of the HST program: DU=Dunlop, J.S.; EL=Ellingson, E.; SP=Sparks, W.B.; ST=Stockton, A.; BA=Bahcall, J.N. |
|---|---|---|---|---|---|---|---|---|---|
| (h m s) | (d m s ) | (s) | |||||||
| 0110+297 | 0.363 | 01 13 24 | +29 58 15 | 17.0 | F814W | WF2 | 1900 | DU | |
| 0133+207 | 3C47 | 0.425 | 01 36 24 | +20 57 27 | 18.1 | F555W | PC1 | 600 | SP |
| 0340+048 | 3C93 | 0.357 | 03 43 30 | +04 57 49 | 18.14 | F555W | PC1 | 600 | SP |
| 0812+020 | 0.402 | 08 15 22 | +01 54 59 | 17.10 | F814W | WF2 | 1200 | DU | |
| 0837-120 | 3C206 | 0.198 | 08 39 50 | -12 14 34 | 15.76 | F702W | PC1 | 600 | SP |
| 0903+169 | 3C215 | 0.412 | 09 06 31 | +16 46 11 | 18.27 | F814W | PC1 | 5000 | EL |
| 1058+110 | 4C10.30 | 0.423 | 11 00 47 | +10 46 13 | 17.10 | F814W | WF2 | 1200 | DU |
| 1100+772 | 3C249.1 | 0.315 | 11 04 13 | +76 58 58 | 15.72 | F555W | PC1 | 600 | SP |
| 1232-249 | 0.355 | 12 35 37 | -25 12 17 | 17.18 | F814W | WF2 | 1800 | DU | |
| 1309+355 | 0.184 | 13 12 17 | +35 15 21 | 15.64 | F606W | WF3 | 200 | BA | |
| 1512+370 | 0.370 | 15 14 43 | +36 50 50 | 16.27 | F814W | PC1 | 640 | ST |
| Name | z | RhostaaHost apparent magnitude in R(Cousins) filter, adapted from WFPC2 filters using Holtzman et al., 1995 calibration (see text); | Re | RnuclbbNuclear apparent magnitude in R band; | kcorrccK-correction of the host galaxy from Poggianti, 1997; | ArddGalactic reddening from Schlegel et al, 1998; | ee ratio from best fit minimization for a model with disk host and with elliptical host. |
|---|---|---|---|---|---|---|---|
| (arcsec) | |||||||
| 0110+297 | 0.363 | 17.01 | 0.24 | 0.12 | 3.72 | ||
| 0133+207 | 0.425 | 17.73 | 1.42 | 0.20 | 0.97 | ||
| 0340+048 | 0.357 | 18.44 | 1.11 | 0.79 | 1.30 | ||
| 0812+020 | 0.402 | 16.21 | 0.28 | 0.06 | 3.04 | ||
| 0837-120 | 0.198 | 16.09 | 0.22 | 0.11 | 1.43 | ||
| 0903+169 | 0.412 | 17.30 | 0.29 | 0.08 | 2.60 | ||
| 1058+110 | 0.423 | 17.53 | 0.30 | 0.05 | 1.66 | ||
| 1100+772 | 0.315 | 15.72 | 0.39 | 0.11 | 0.90 | ||
| 1232-249 | 0.355 | 16.16 | 0.24 | 0.19 | 1.40 | ||
| 1309+355 | 0.184 | 15.90 | 0.38 | 0.02 | 7.82 | ||
| 1512+370 | 0.370 | 16.09 | 0.25 | 0.04 | 0.97 |
| Name | z | MR(host)aaAbsolute magnitues are in R(Cousin) filter, k-corrected and corrected for galactic extinction using Schlegel et al, 1998; | RebbHooper et al, 1997 do not report values of the effective radius. | MR(nucl) | LogP5GHz | |
|---|---|---|---|---|---|---|
| (kpc) | ||||||
| 0110+297∗ | 0.363 | -23.56 | 13.4 | -24.82 | 26.40 | 3.19 |
| 0133+207∗ | 0.425 | -24.41 | 15.5 | -24.91 | 27.20 | 1.59 |
| 3C48 | 0.367 | -25.08 | 8.1 | -26.08 | 27.67 | 2.51 |
| PHL1093 | 0.258 | -24.34 | 15.0 | -23.82 | 26.38 | 0.62 |
| PKS0202-76 | 0.389 | -23.30 | 4.9 | -24.20 | 26.97 | 4.83 |
| 0312-77 | 0.223 | -24.28 | 17.7 | -23.84 | 26.25 | 0.67 |
| 0340+048∗ | 0.357 | -24.09 | 5.9 | -24.13 | 26.85 | 1.04 |
| 0736+017 | 0.191 | -24.18 | 13.3 | -24.50 | 26.53 | 1.34 |
| 0812+0202∗ | 0.402 | -24.24 | 11.4 | -25.95 | 26.85 | 4.83 |
| 0837-120∗ | 0.198 | -23.23 | 13.1 | -24.46 | 26.14 | 3.10 |
| 0903+169∗ | 0.412 | -23.80 | 6.9 | -24.94 | 26.64 | 2.86 |
| 1004+130 | 0.240 | -24.34 | 8.2 | -25.98 | 26.13 | 4.53 |
| 1020-103 | 0.197 | -23.68 | 7.1 | -23.75 | 25.94 | 1.07 |
| 1058+110∗ | 0.423 | -23.17 | 15.4 | -24.71 | 26.47 | 4.13 |
| 1100+772∗ | 0.315 | -24.47 | 10.0 | -26.22 | 26.65 | 5.01 |
| 1138+000 | 0.500 | -24.36 | *** | -24.69 | **** | 1.35 |
| 1217+023 | 0.240 | -24.08 | 11.1 | -24.64 | 26.34 | 1.67 |
| 1218+175 | 0.444 | -23.66 | *** | -23.59 | 25.81 | 0.94 |
| 1222+125 | 0.415 | -24.20 | *** | -24.36 | 25.74 | 1.15 |
| 3C273 | 0.158 | -24.39 | 8.5 | -27.40 | 27.74 | 16.00 |
| 1230-0015 | 0.470 | -24.50 | *** | -24.97 | 26.11 | 1.54 |
| 1232-249∗ | 0.355 | -23.31 | 8.2 | -25.70 | 26.75 | 9.04 |
| 1302-102 | 0.286 | -23.91 | 7.0 | -26.47 | 26.55 | 10.57 |
| 1309+355∗ | 0.184 | -24.41 | 5.4 | -24.70 | 24.85 | 1.301 |
| B21425+267 | 0.366 | -24.37 | 10.1 | -26.49 | 25.96 | 7.06 |
| 1512+370∗ | 0.370 | -23.66 | 8.2 | -25.61 | 26.48 | 6.03 |
| 3C323.1 | 0.264 | -23.33 | 8.2 | -24.82 | 26.51 | 3.95 |
| 3C351 | 0.371 | -24.67 | 7.8 | -25.33 | 27.02 | 3.84 |
| 2135-147 | 0.200 | -23.50 | 11.6 | -24.40 | 26.45 | 2.29 |
| OX169 | 0.213 | -24.04 | 8.2 | -25.00 | 26.41 | 2.42 |
| 2247+140 | 0.237 | -24.19 | 13.5 | -24.09 | 26.56 | 0.91 |
| 2349-014 | 0.173 | -24.51 | 19.2 | -24.21 | **** | 0.75 |
| 2351-0036 | 0.460 | -23.33 | *** | -24.53 | 26.73 | 3.02 |
| 2355-082 | 0.210 | -23.97 | 10.4 | -23.29 | 25.58 | 0.53 |