Kinematics of Ten Early-Type Galaxies From HUBBLE SPACE TELESCOPE and Ground-Based Spectroscopy1
Abstract
We present stellar kinematics for a sample of 10 early-type galaxies observed using the Space Telescope Imaging Spectrograph (STIS) aboard the Hubble Space Telescope, and the Modular Spectrograph on the MDM Observatory 2.4-m telescope. These observations are a part of an ongoing program to understand the co-evolution of supermassive black holes and their host galaxies. Our spectral ranges include either the calcium triplet absorption lines at 8498, 8542, and 8662 Å, or the Mg b absorption at 5175 Å. The lines are used to derive line-of-sight velocity distributions (LOSVDs) of the stars using a Maximum Penalized Likelihood method. We use Gauss-Hermite polynomials to parameterize the LOSVDs and find predominantly negative values (boxy distributions) in the central regions of our galaxies. One galaxy, NGC 4697, has significantly positive central (high tail weight). The majority of galaxies have a central velocity dispersion excess in the STIS kinematics over ground-based velocity dispersions. The galaxies with the strongest rotational support, as quantified with /, have the smallest dispersion excess at STIS resolution.
The best-fitting, general, axisymmetric dynamical models (described in a companion paper) require black holes in all cases, with masses ranging from 106.5 to . We replot these updated masses on the relation, and show that the fit to only these 10 galaxies has a slope consistent with the fits to larger samples. The greatest outlier is NGC 2778, a dwarf elliptical with relatively poorly constrained black hole mass. The two best candidates for pseudobulges, NGC 3384 and 7457, do not deviate significantly from the established relation between and . Neither do the three galaxies which show the most evidence of a recent merger, NGC 3608, 4473, and 4697.
1 Introduction
The wealth of new data from the Space Telescope Imaging Spectrograph (STIS) aboard the Hubble Space Telescope (HST) is dramatically improving our understanding of the central regions of early-type galaxies. Its long-slit design allows for more efficient measurement of galaxy kinematics than the previous Faint Object Spectrograph. The 01 spatial resolution of STIS resolves the influence of a 108 black hole (BH) in an galaxy (velocity dispersion km s-1) out to 25 Mpc.
Our team has observed a sample of 10 nearby elliptical or lenticular galaxies using STIS in order to address many questions concerning the demographics of supermassive black holes. Are BHs present in the centers of all early-type galaxies? With which properties of the host galaxy does the BH mass correlate? What can this tell us about the evolution of BHs and galaxies, and the relationship of inactive BHs in nearby galaxies to more distant active galactic nuclei? Our data can also address several issues in the evolution of galaxies. For example, why is there a dichotomy between power-law and core surface brightness profiles (Faber et al. 1997)? Were cores created by the scouring action of merging black holes? Why do a few ellipticals not fit well into either category (Rest et al. 2001)? Why are the properties of BH in bulges and pseudobulges so similar, when these two types of stellar systems probably formed in quite different ways (Kormendy et al. 2002). Our sample contains galaxies with both core and power-law profiles. It also contains two possible pseudobulges: the low-luminosity S0 NGC 7457 and the S0 NGC 3384.
The dataset presented in this paper has already been instrumental in establishing a new, fundamental correlation between the BH mass and stellar velocity dispersion (, Gebhardt et al. 2000 (G00); Ferrarese & Merritt 2000). By combining our data with other published results, G00 demonstrate that the new correlation has less scatter than the one between BH mass and bulge luminosity (see Kormendy & Richstone 1995; Magorrian et al. 1998; Richstone et al. 1998; and van der Marel & van den Bosch 1998). Here we give the details of data reduction leading to this result. In a companion paper (Gebhardt et al. 2003), we discuss the modeling technique used to determine the BH masses, while Tremaine et al. (2002) discusses the slope of the relation.
The present paper complements the modeling paper by parameterizing the stellar line-of-sight velocity distributions (hereafter LOSVDs) with a Gauss-Hermite (GH) expansion. The parameterization of LOSVDs with GH polynomials has become common practice over the last decade as increasing importance has been placed on the precise shape of the stellar LOSVD (van der Marel & Franx 1993; Bender et al. 1994). High-quality galaxy spectra have demonstrated that stellar LOSVDs deviate significantly from a Gaussian distribution (Bender 1990; Gerhard 1993; van der Marel & Franx 1993). For edge-on, rapidly rotating galaxies, the LOSVD is often asymmetric. In other cases it has longer or shorter tails compared to a Gaussian. In the GH expansion, the first term measures the mean velocity and velocity dispersion. The second term measures asymmetric deviations from a Gaussian, while the third term measures symmetric deviations from a Gaussian. Measuring the entire LOSVD, rather than just its first two moments (mean velocity and velocity dispersion), constrains the phase-space distribution of the stars and thus helps to reduce the ambiguities in the mass distribution derived from stellar kinematics. Although the fully general LOSVD is used in our BH modeling, the GH parameters are a convenient means of describing an LOSVD. They provide a check on the orbital anisotropies determined by the modeling, and a means of comparison to previously published results.
The GH parameters can also be combined with photometric and kinematic parameters to provide insight into elliptical galaxies. For example, Bender, Saglia & Gerhard (1994, hereafter BSG) define mean parameters and and find correlations between these and , , , and for 44 ellipticals. The greater generality of the GH parameterization has been exploited in deriving mass profiles from ground-based spectroscopy for NGC 4342 (Cretton & van den Bosch 1999), NGC 3115 (Emsellem et al. 1999), NGC 1399 (Saglia et al. 2000), NGC 2974 (Cinzano & van der Marel 1994), and NGC 2434 (Rix et al. 1997). In the case of M87, ground-based GH parameters have even been used to constrain the mass of the central BH (van der Marel 1994a). Many papers present GH parameters derived from ground-based spectroscopy for large samples of galaxies (e.g., Kaprolin & Zeilinger 2000; Kronawitter et al. 2000; Fisher 1997). Checks and comparisons to our ground-based GH parameters come largely from the samples of BSG and Halliday et al. (2001), which have 5 and 3 galaxies in common, respectively. STIS now enables us to examine the GH parameters at sub-arcsecond resolution. For NGC 1023 (Bower et al. 2001) and M32 (Joseph et al. 2001), STIS has clearly revealed the influence of a BH on the stars.
This paper proceeds as follows. We describe our galaxy sample in §2, and the observations in §3. Section 4 details the reduction of STIS and complementary ground-based data. In §5, we first describe how LOSVDs and GH parameters are derived from our spectra, and then we present our kinematics for individual galaxies. In §6 we will discuss our results.
2 Sample Description
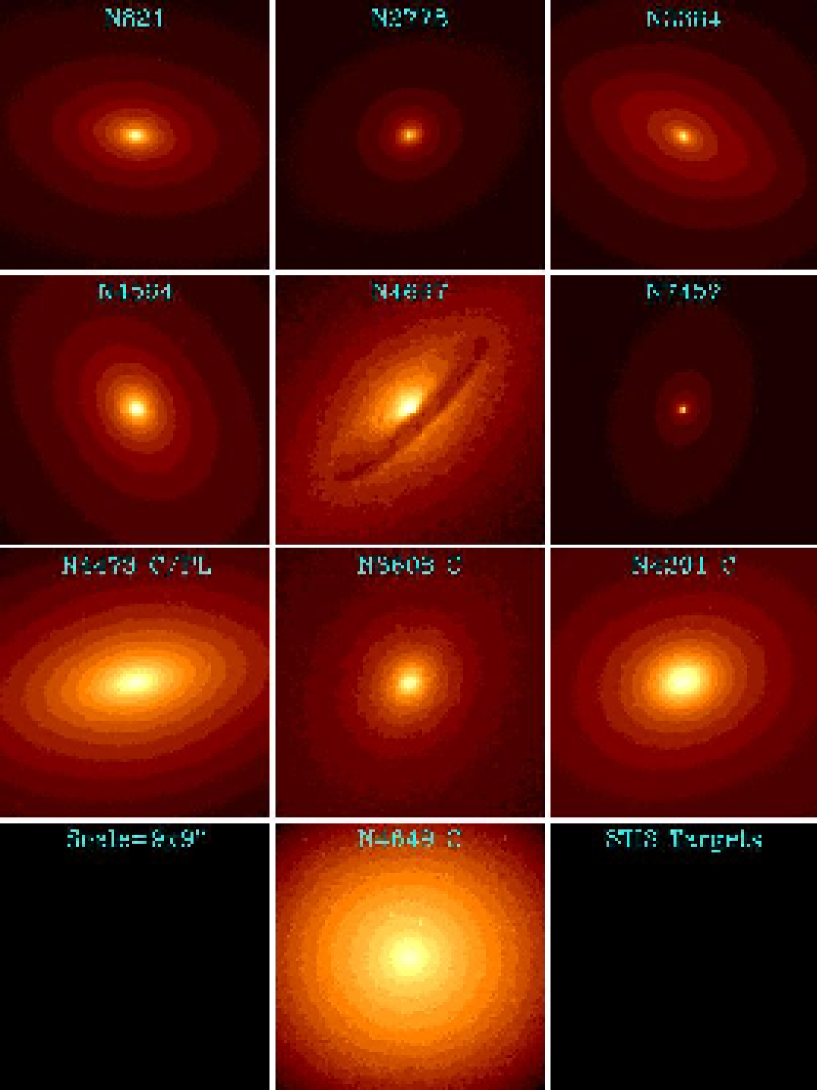
A collage of all 10 target galaxies is shown in Figure 1. The galaxies were chosen from those with reliable surface-brightness distributions at HST resolution. We attempted to include a large range of luminosity and to exclude problematic objects such as those containing obscuring dust. (The galaxy NGC 4697 shows a dust disk which extends out to 34, but the inner 10 does not appear to be seriously obscured.)
The stepped grayscales are used in Figure 1 to show the variety of isophote shapes. Some galaxies, like NGC 821, have “disky” isophotes that will produce positive parameters , where is the fourth cosine coefficient in the Fourier expansion of the radial deviations, and is the semimajor axis of the isophote (Lauer 1985; Bender 1988). Others, like NGC 4291, have “boxy” isophotes that will produce negative . Boxy isophotes are typically found in galaxies with “core” surface brightness profiles (Faber et al. 1997). A “core” profile has a break between inner and outer slopes and the inner logarithmic slope, , must be less than 0.3. Similarly, “disky” isophotes are found in “power-law” galaxies, which have no significant break and have steeper slopes. Our sample has six power-law and four core galaxies. We count NGC 4473 as a core because of its surface brightness profile, but it shares many properties with power-law galaxies (see §5). The core galaxies are grouped on the bottom of Figure 1.
The most luminous core galaxies tend to have a large velocity dispersion and low surface brightness, making measurement of the LOSVDs difficult. Thus, we selected three core galaxies with relatively high surface brightness (NGC 3608, 4291, and 4473). However, we selected one example of a relatively low surface brightness core galaxy, NGC 4649, which has 15.9 mag arcsec-2 at 01. It is comparable to M87 in luminosity, and it serves as a test case for measuring absorption-line kinematics in low surface brightness giants.
3 Observations
3.1 STIS Observations
Table 2 gives specifications for the spectrograph/grating combinations used. Our STIS observations used only the G750M grating and the STIS CCD detector. The STIS CCD is a 10241024 pixel CCD with readout noise around 3.8 at a gain of 1.0. We binned the CCD by a factor of 2 along the dispersion axis in all of our observations to improve the signal-to-noise ratio (S/N). This raised our reciprocal dispersion to 1.1 Å pix-1. STIS has a spatial scale of 00507 pix-1 in all of the configurations used here.
Table 3 gives the details of the HST observations. Typically, 6 orbits were devoted to each galaxy ( 2700 seconds per orbit). However, the galaxies NGC 821, 3384, and 4697 had 11 orbits, and the galaxy NGC 4649 had 18 orbits because of its low surface brightness. Each orbit was divided (CR-split) into two, 1350-s exposures except the first orbit of a visit, which had shorter exposures. For the first 2 visits of the program (NGC 4473 and 821), the galaxy center was only dithered slightly (at the sub-pixel level) on the chip between orbits. Partway through the program we learned that the CCD had a rapidly varying population of hot and warm pixels. We then requested wider separations between dithers (20 pixels) so that a dark frame could be constructed from the data. Five dither positions were used. The second visit to NGC 821 used wide dithers, so only NGC 4473 did not receive any wide-dither observations.
For one galaxy, NGC 4697, two 1050 s exposures were taken with the G750M in setup 3 (Table 2). Here, the spectral range is centered near = 6581 Å. We see H+[N II] emission lines which allow a useful comparison of gas and stellar kinematics. The reduction and analysis of these data is described elsewhere (Pinkney et al. 2003).
Table 3 includes a K3 III and a G8 III star observed by us. We use these as LOSVD-fitting templates, for assessing aperture illumination corrections, and for measuring the STIS point spread function (PSF). We also used HR7615 from Bower et al. (2001). The spectrum of the G8 III star (HR6770) is shown in Figure 2. The template stars were observed through the same slits that we used for our galaxies. We used two slit apertures in our STIS setups: 52″0.1″ and 52″0.2″. The aperture point-source throughputs are 64% and 77.8%, respectively, at 8500 Å. The 01 slit required a PEAKUP while the 02 slit did not. We used the 02 slit for the four core galaxies (NGC 3608, 4291, 4473, and 4649) and the 01 slit for the six power-law galaxies.
3.2 Ground-Based Observations
We used the Modular Spectrograph (hereafter, Modspec) on the 2.4-m Hiltner Telescope at MDM Observatory for longslit spectroscopy (Table 4). The camera was equipped with either a thick, frontside illuminated LORAL 20482 CCD (“Wilbur”), or a thinned, backside illuminated SITE 10242 CCD (“Charlotte”). The LORAL chip had 4.7 readout noise, while the SITE had 5.45 . The Modspec Ca II setup produces comparable spectral resolution to our STIS + G750M setups (Table 2). Its spatial resolution is worse, of course, varying with seeing in the range 06–20. Our CCDs had pixel scales of 0371 pix-1 (Wilbur) and 059 pix-1 (Charlotte).
Multiple exposures were taken of each galaxy, with lower surface brightness galaxies receiving more exposures. The slit was placed along the major axis and at least one other position angle (Table 4). Small dithers of the galaxy along the slit were used to remove CCD defects. The galaxy observations were bracketed by star observations to help monitor the seeing, and to build a library of template stars for defining the broadening functions in the galaxy spectra. Template exposures were generally 1 minute. Calibration frames included Ar comparison lamp spectra, continuum lamp spectra, and twilight sky spectra. Guiding used either starlight that was reflected off of the slit jaws or direct guiding from stars outside of the slit-viewing area. The root-mean-square (rms) deviations on the sky during the guiding were typically around 0.3″. We often have a star in the slit along with the galaxy. We can compare the FWHM of the star during a long exposure with the FWHM of a star during a short exposure to check the guiding stability. For a 20–minute exposure, the guiding added about a 10–20% increase in the FWHM.
4 Data Reduction
4.1 G750M Ca II Spectra
The STIS data reduction was done with our own FORTRAN programs and FITSIO subroutines (Pence 1998). Our primary reasons for not using CALSTIS (Hodge et al. 1998) within IRAF are 1) a better dark frame can be created out of the data than the weekly darks used by CALSTIS, 2) many features of CALSTIS were not important to us, such as heliocentric correction, 3) we did not want 2D rectification to be unnecessarily complex.
We began by extracting the raw spectra from the multi-dimensional FITS file. To remove the bias level, we subtracted a constant fit to the overscan region. The overscan was about 1110 data numbers (DN) for galaxy spectra, and 1505 DN for flats and comparison lamps, with little variation from one visit to the next.
Subtraction of an accurate dark current was important because the STIS CCD has warm and hot pixels which evolve on timescales of 1 day. The mean dark current was about 0.007 s-1 pix-1 and this produced about 10 DN pix-1 in our exposures. We used an archival dark only for the 2 visits that were not dithered (NGC 4473 and 821); for the rest, we created a dark out of the data. This self-dark required many iterations. The first dark was a biweight combination (see Beers et al. 1990) of the individual exposures after masking the pixels within 25 rows of the galaxy peak. The first dark, although imperfect, was subtracted from each spectrum. We proceeded with the flat-fielding, bad-pixel flagging, and un-dithering, until a 2D spectrum can be made by combining the exposures. This 2D galaxy spectrum was then de-flattened, dithered, and subtracted from the raw spectra. The results contained the dark current, cosmic rays, and some residuals from the first, rough, dark subtraction. These were again biweight combined to form an improved dark. We then repeated reduction with this dark frame to form a second 2D spectrum which was again subtracted from the raws for a third self-dark iteration. At least 5 such iterations were performed to remove residual galaxy signal from the dark. A slice along the spatial axis showed the galaxy profile to dwindle to zero if low-level dark current was correctly subtracted from the final galaxy 2D spectrum. This dark also corrected for any bias pattern on the chip. The final galaxy spectrum was typically more free of deviant pixels than if an archival dark was used.
![[Uncaptioned image]](/html/astro-ph/0306464/assets/x2.png)
The ratio of two CCD flats compared with the original. The wavy line is an average of 6 rows across the middle of the combined flat for NGC 3384. It was taken with the 52″x0.1″ aperture and the G750M 8561 Å setup. The relatively flat line is the result of dividing this flat by another taken 9 months later with the same setup.
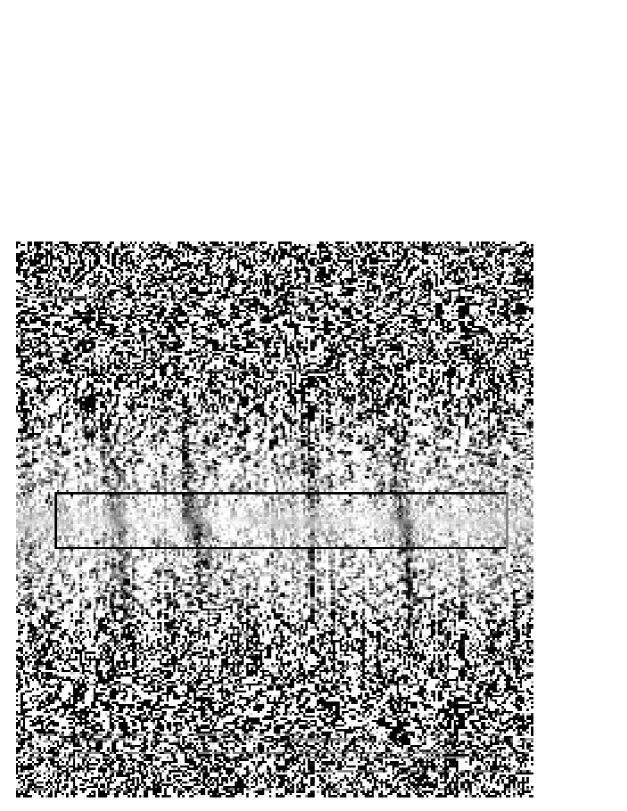
Within our self-dark iteration loop, the dark subtraction was followed by flat-fielding. The flat-fielding was important because interference fringes become strong for 7500 Å. Our raw data had about 10% peak-to-peak variations due to fringing (Fig. 4.1). We used a flat which was a combination of the contemporaneous tungsten flats. These are intended to reduce fringe effects to the 0.9% level (Leitherer et al. 2001). It was difficult to measure fringe residuals in our galaxy spectra, but ratios of flats taken within a visit showed no detectable fringe pattern. Also, a ratio of flats taken 9 months apart through the 52″0.1″ aperture contained a residual fringe pattern at the 1.0% level (Fig. 4.1). The stability of these tungsten flats is one clue to their effectiveness in our reduction. Another is the shape of the final spectra (Figures 2 and 3), especially for standard stars, which tend to show a linear continuum with only familiar features superimposed. The overall slope of the galaxy continuum does not have to be perfectly accurate for our purposes, so any color mismatch between the tungsten flat and our galaxies is not problematic.


After flat-fielding, the spectra had to be vertically shifted to a common dither, combined, and rotated. The shifting was done by measuring the peak of the galaxy profile in a 100-column wide region at the center of the CCD. The peak was measured with 1/9 pixel precision for each frame using a cubic spline interpolation. The spectra were shifted vertically to the same row of pixels, y=511.0. Fractional pixel shifts were allowed in order to provide an accurate superposition, but this created smearing (redistribution of counts to neighboring pixels) along columns. The aligned spectra were then combined using the biweight to filter cosmic-ray hits. Since there were five dither positions, every final pixel value was a combination of at least five distinct pixels on the CCD chip. The resulting spectrum has a dispersion with a 0.6° clockwise tilt relative to the CCD rows. This was removed in the last step using a rotation about the chip center. The rotation adds additional smearing which is spatially periodic, i.e., regions of minimal smearing occur every 95 pixels. The center of the spectrum, =8559 Å, was a smearing minimum which happens to fall near the Ca II 8542 Å line for our galaxies.
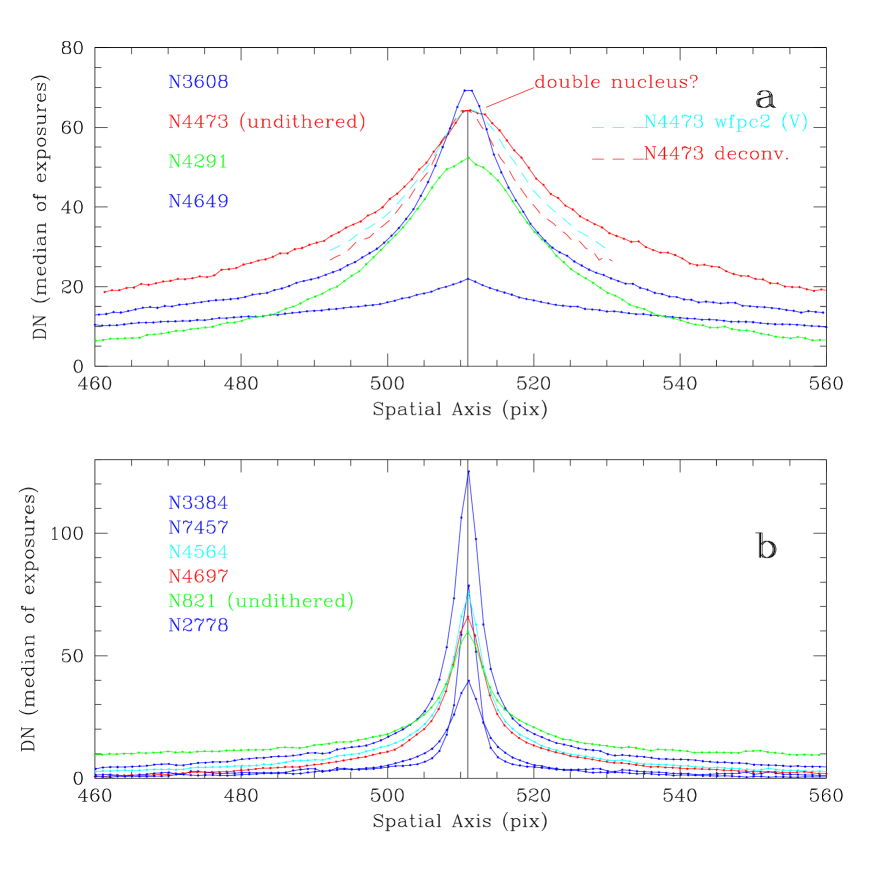
The final 2D spectra contain imperfections. Figure 4 is an example of a final unsharp-masked, dithered dataset for NGC 3384. The box overlay on NGC 3384 shows the extent of our 1D extractions from the galaxy center. There is a low-level ( DN) pattern noise apparent on Figure 4. It is possibly caused by residuals from dark-subtraction and/or flat-fielding which are then spatially repeated when the 5 dithers are combined. The dark contains charge trails along columns which become more numerous toward the bottom of the chip. These features do not all subtract well leaving linear features on the spectrogram. Other imperfections are not easily visible. There are typically a dozen bright features between the fiducial bars for an average of ten, 1350-s exposures. These are 1-2 pixel events smeared by shifting to cover an area of pixels. They probably originate in pixels that contain cosmic rays in many of the exposures. (Cosmic ray hits occur on about 5% of pixels on the raw frames.)
We extracted 1–dimensional (1D) spectra from the final spectrogram using a biweight combination of rows. Our standardized binning scheme (Table 6) used 1-pixel wide bins near the galaxy center to optimize spatial resolution. All of the bins were contained within 10 (20 pixels) of the galaxy center. Our dither pattern positioned the galaxy center on the rows y=471, 491, 511, 531 and 551, so that the residuals of the fiducial bars fell as near as 92 to the galaxy center. These bars did not interfere with our spectroscopy because the S/N generally becomes too poor to measure kinematics by =15 for our galaxies. Since our spectral extractions went out 20 pixels from the galaxy center and our maximum dithers were 40 pixels, all of our spectra originate between y=450 and 570 on the chip. This simplified several other aspects of the reduction, including wavelength calibration.
A wavelength solution was obtained for the final galaxy spectra by summing the rows between y=450–550 on each of the Pt-Cr/Ne comparison lamp frames. There were typically six unique comparison spectra per visit. The final solution was an average of these six solutions. For each solution, we fitted a line to wavelength vs. pixel for 12 lamp lines and got residuals with rms0.12 Å. The lines were the 12 brightest after omitting a close double. A typical solution was y(Å)=1.10896x + 8276.26, the errors are the standard deviation from the six solutions. Over the region occupied by the galaxy spectra (y=450–570), the lamp lines exhibit a slight bowing on the CCD which is asymmetric with respect to the central row. We considered errors caused by this bowing. The top dither at y=551 has a zeropoint that differs by about +0.17 Å from that of the central dither (y=511), and the bottom dither at y=471 differs by about Å. Thus, by combining vertically shifted dithers we artificially broaden the lines. The width of the lines increases by less than 0.5% as a result of this co-addition. Since the Ca absorption lines are broader than the lamp lines, their fractional change in width should be even less. The errors in the lamp-line centroids caused by the co-addition are small because the shift caused by the top dither will be nearly compensated by the shift from the bottom dither. Any remaining zeropoint error from the asymmetry is 0.05 Å. Finally, the galaxy spectrum was rotated by 0.6° while the comparison spectrum was not. This introduced only negligible errors (0.01 Å) in line positions.
4.2 Template Spectra
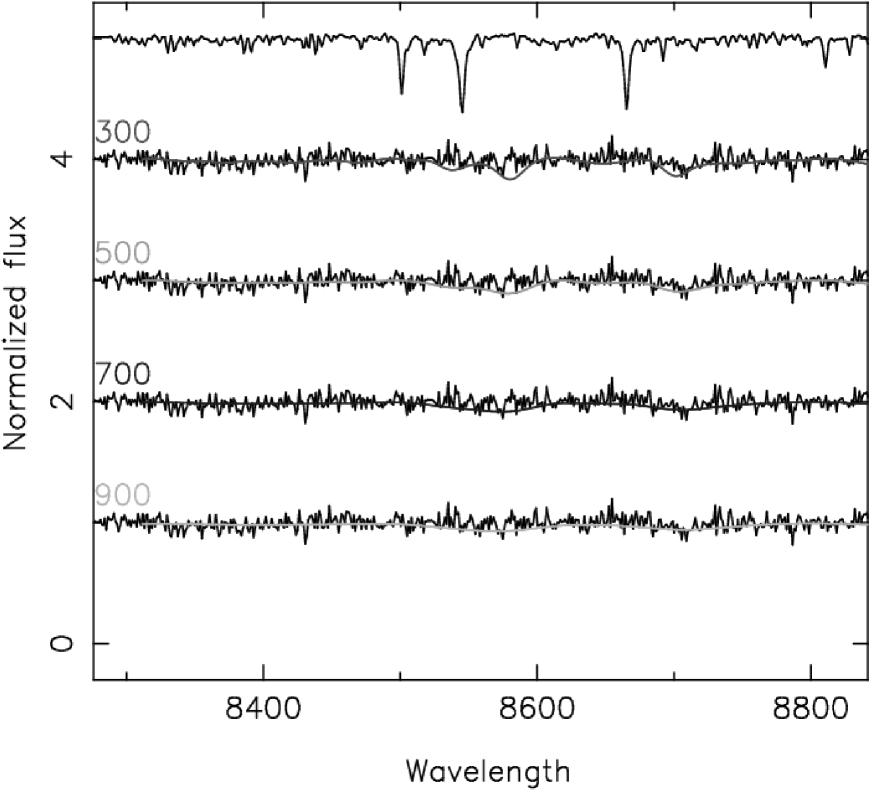
The template-star observations required a different reduction than the galaxies. Five exposures were taken through each of the 52″x0.2″ and 52″x0.1″ slits. The exposure times were 2.2 s, so dark subtraction was unnecessary. Between exposures, the star was stepped across the slit by 004 and 0025 for the 02 and 01 slits, respectively. Combining each set of five spectra allowed us to simulate the observation of a diffuse source through both slits. The combined spectrum was then rotated by 0.6°. Two lamp flats were obtained with exposure times of 142 s (01 slit) and 84 s (02 slit). The flats were also combined and rotated. Next, 1D spectra were extracted from both the star and flatfield spectrograms by averaging the 6 central rows. The extracted flat was normalized and then divided into the extracted stellar spectrum. The resulting spectra (e.g., HR6770 in Fig. 2) appear to be corrected of fringing.
The stepping of the stars across the slits allowed us to measure the instrumental broadening of the Ca II triplet absorption lines. The first and last exposures in the 02 slit had the star positioned at opposite extremes in the slit, a pointing difference of 016 implying a 1.6 Å centroid shift. However, the measured difference in centroids was only 1.07 Å (38 km s-1) in line centroids. The difference presumably originates in asymmetric vignetting of the stellar PSF by the slit. The Ca lines had widths of about 3.4, 5.5 and 3.9 Å, for 8498 Å, 8542 Å and 8662 Å, respectively, in the individual 2.2-s exposures. The combined spectra showed only 0.1 Å broadening when summed in the 02 aperture. Thus, there is a broadening of the narrowest stellar Ca line due to the wider of the two slit widths. The broadening of Ca lines in our target galaxies will be even less. Finally, the STIS PSF was also derived from the template star exposures. The method and results are identical to those described by Bower et al. (2001).
4.3 Ground-Based Spectra
The Modspec data were also reduced with FITSIO routines. The CCD frames were overscan corrected, bias subtracted, and trimmed. The flat frames were constructed out of the twilight sky frames and the continuum-lamp frames as follows. We derived a small-scale structure flat from the continuum lamp. The large-scale structure along the dispersion axis was also taken from the continuum lamp. The structure along the spatial axis, however, was taken from the twilight frames. The final flat was the product of these three individual flats.
After flat-fielding, the spectra were rectified. We used wavelength solutions from neon and argon comparison lamps and the traces of several standard-star spectra to define our geometric transformations. Pixel smearing was not as much of a concern with the Modspec data as with STIS because we do not rely on Modspec for high spatial resolution. Therefore, nonlinear transformations were used and spectral images were shifted, aligned, and dispersion-corrected as needed before combining into final 2D spectra. Sky spectra were defined on the edges of the chip, where galaxy light was minimal, and subtracted from the 2D spectra.
Table 4 shows our exposure times for each position angle (PA) for each galaxy. We took between 2 and 23 exposures for a given PA to reach the desired S/N. As an example, a 1200-s exposure of an elliptical galaxy (NGC 4564 is used here) with an HST-measured surface brightness at 10 of =16.0 mag arcsec-2 will have a Ca spectrum with about S/N20.0 per Å for a spectrum extracted from a 037-wide bin (one pixel on the Wilbur CCD). For such a galaxy, 7 exposures will allow a S/N 50 per Å to be reached in the central extraction. This is easily sufficient for measuring the and parameters of the LOSVD. The outer parts of the galaxy can be measured with adequate S/N by using broader extraction bins (see Table 6). In the case of NGC 4564, to reach S/N 25 (giving uncertainties in and of 0.05) at a radius where =19 mag arcsec-2, a 4-pixel wide bin and 7 exposures are sufficient.
4.4 Imaging
A luminosity density distribution is needed for the modeling of each galaxy’s mass distribution (see Gebhardt et al. 2003). A non-parametric fit is made to the surface brightness profile, and this is deprojected into luminosity density following Gebhardt et al. (1996). We used primarily WFPC2 images in filters F555W () and F814W () from HST proposals PID 5512, 6099, 6587, and 6357. For NGC 4697, we used pre-COSTAR WFPC1 data in F555W. The images were typically sums of 4 or more exposures. Starting with PID 6587, we used sub-pixel dithers for improved spatial sampling. All WFPC2 images were deconvolved with 40 iterations of Lucy-Richardson deconvolution, while 80 iterations were applied to the WFPC images. Our images are shown out to in Figure 1 and surface brightness profiles are shown in Gebhardt et al. (2003). The profiles are actually a composite of HST and ground-based data, where the ground-based profile is shifted by a constant to match HST at a radius where seeing effects are minimal. The ground-based CCD photometry was taken primarily from Peletier (1989).
For reference, the parameters of the best fit of the photometry to the five-parameter Nuker law (Lauer et al. 1995) are given in Table 5. We show published values from Rest et al. (2001), Ravindranath et al. (2001), and Faber et al. (1997), or, if these are not available, our own fits to the and band WFPC2 images. The Nuker law is a double power law given by
| (1) |
where is the slope as , is the slope at large , and determines the sharpness of the break between the two power laws at . These parameters are correlated (see Byun et al. 1996), and the slippery nature of the 5-parameter fit allows for occasional sporadic values. These are fits to the major axis surface brightness distribution. If two sets of parameters are given for a galaxy, we adopt the average for each parameter for the purpose of plotting (§6).
4.5 STIS Light Profiles
Our STIS spectra also provide information on the near-infrared surface brightnesses of our galaxies. Figure 5 shows intensity as a function of slit position. The slits were approximately aligned with the major axes (Table 3). We produced intensity profiles in order to check the shifts of our galaxy peaks to a common position, row 511.0. The profiles are slices along the spatial axis of the 2D spectrum, which are each a biweight of at least 10 exposures. The slices are 101 pixels wide (columns 200-300). The peak was defined as the maximum of a smooth, cubic spline fitted to the profile, thus allowing sub-pixel interpolation. The final 2D spectra were always peaked within 0.4 pixels of row 511.0. For the creation of Figure 5, the fitted peaks were shifted to fall exactly on 511.0 to best demonstrate any asymmetry in the galaxies.
It is worth noting that these STIS datasets are valuable as probes of surface brightness features because total exposure times are over 10 times greater then typical WFPC2 surveys, the near-IR wavelengths are less dust sensitive, and saturation is avoided by dispersing the light. The ordinate of Figure 5 gives the counts obtained in 1350 seconds (“DN” are equivalent to the number of electrons because gain = 1). However, at least 1010 pixels are averaged to determine each point so that the Poisson errors are actually very small: at 60 DN, the 68% error is only 0.2 DN, or about one-half the size of the plotted points. The kinematics are derived only out to 20 pixels (10). A point is labelled “double nucleus?” in reference to the note given in Table 1 of Byun et al. (1996). Here we find a significant asymmetry in the two sides of NGC 4473: one side is DN higher than the other at 2 pixels. Also, the labelled point deviates from a line connecting the adjacent points by 1 DN, which is also marginally significant. As can be seen in the steep profiles of the power-law galaxies (Figures 5b), the asymmetric PSF of STIS does not create asymmetries in these light profiles as strong as the one in NGC 4473.
5 Kinematics From Stars: LOSVD Fitting
The modeling of stellar kinematics requires the derivation of LOSVDs at numerous positions on the galaxy. The STIS spectra are used to sample only 10 along the major axis, while our Modspec observations sample to 1–2 half-light radii (ranging from 10-70″) along the major axis, and other position angles. After some experimentation, the binning shown in Table 6 was chosen. It provides the best spatial resolution while maintaining adequate S/N. The first three bins are each 1 STIS pixel wide.
Obtaining internal kinematic information requires a deconvolution of the observed galaxy spectrum using a template spectrum composed of several representative stellar spectra. Both the deconvolution process and the template library are significant issues for obtaining the LOSVD. We deconvolve each spectrum using two different techniques: a maximum-penalized likelihood (MPL) estimate that obtains a non-parametric LOSVD, and a Fourier correlation quotient technique (FCQ; Bender 1990). MPL proceeds as follows. We choose an initial velocity profile in bins (the choice of initial profile has no effect on the result). The initial velocity profile convolved with a weighted-average template (discussed below) provides a galaxy spectrum that is used to calculate the residuals to the observed spectrum. The program fits the shape of the losvd by subdividing it into 13 velocity bins, and varying the counts in these bins while adjusting the template weights to provide the best match to each galaxy spectrum. The exact number of bins has little influence on the final results. Thus, the template mixture can vary from one radius to the next, just as the velocity, velocity dispersion, etc. can. The MPL technique is similar to that used by Saha & Williams (1994) and Merritt (1997). However, our method differs from theirs in that we fit simultaneously for the velocity profile and template weights.
We continuum-divide all template and galaxy spectra. We use a local continuum for the estimate as opposed to a global -parameter fit to the full spectrum. The continuum is estimated by dividing the spectrum up into about 10 wavelength windows, estimating a robust mean (the biweight; see Beers, Flynn, & Gebhardt 1990) in each window, and interpolating between these values. This mean is measured from the highest 1/3 of the points to compensate for absorption features. We have tried a variety of continuum estimates (varying the number of local windows and number of points used in the local averaging) and find insignificant differences in the kinematic results.
We use Monte Carlo simulations to measure the uncertainties on the velocity profile bins. For each realization, we generate a simulated galaxy spectrum based on the best-fit velocity profile and an estimate of the rms residual of the initial fit. The initial galaxy spectrum comes from the template star convolved with the measured LOSVD. This provides a galaxy spectrum with essentially zero noise (the noise in the template is insignificant for our purposes). From that initial galaxy spectrum, we then generate 100 realizations and determine the velocity profile, and hence the velocity dispersion, each time. Each realization contains flux values at each wavelength that are chosen from a Gaussian distribution, with the mean given by the initial galaxy spectrum and the standard deviation given by the rms of the initial fit. The 100 realizations of the velocity profiles provide a distribution of values from which we estimate the 68% confidence bands. These velocity profiles and their 68% confidence bands are used directly in the dynamical modeling (Gebhardt et al. 2003).
We wish to compare the MPL-derived LOSVD with those derived using FCQ (see above). To do this, we must convert the non-parametric LOSVDs into Gauss-Hermite polynomials. We use the least-squares estimator MRQMIN from Press et al. (1992) to find the best fit to this parameterization:
| (2) |
where the mean velocity and velocity dispersion are contained within . is the amplitude of the LOSVD at . The coefficient multiplies the asymmetric deviations from a Gaussian (i.e., skewness), while parameterizes symmetric deviations from a Gaussian (kurtosis). The definitions of and are given in BSG. The first and second moments of the LOSVD will differ from and when and are non-zero. For example, the is 10% smaller than the second moment about the mean when , and 5% smaller for . Similarly, will be 15% larger than the first moment for (BSG).
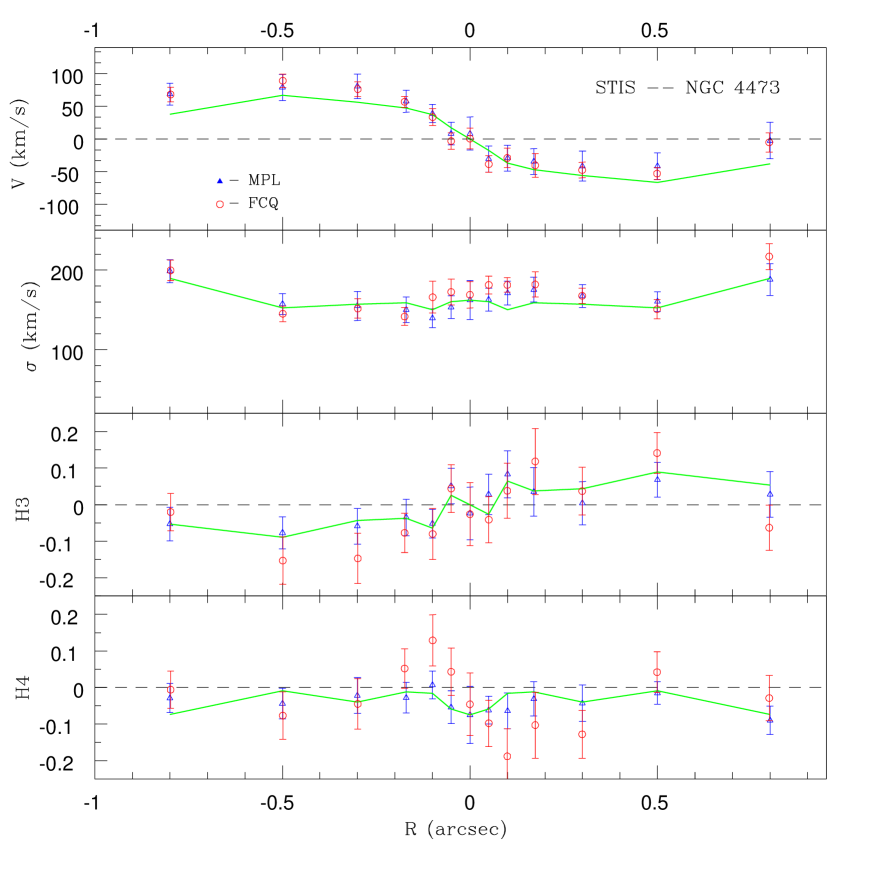
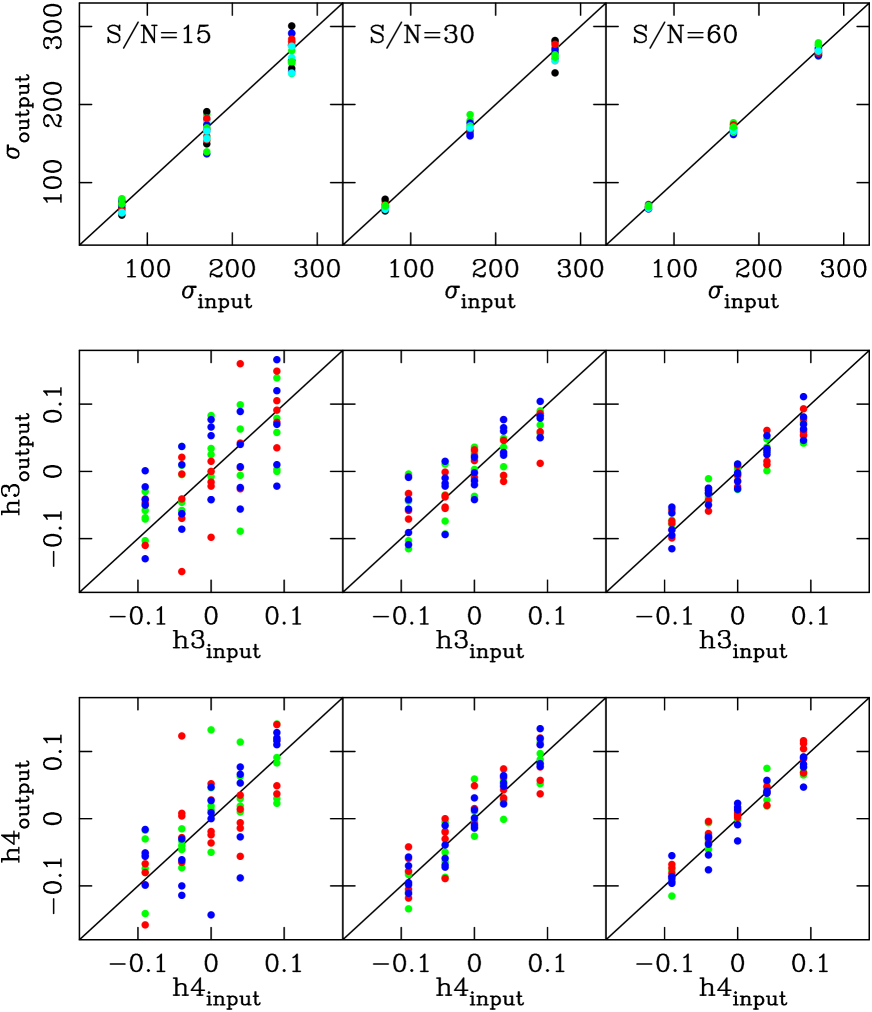
We tabulate the first four terms of the Gauss-Hermite expansion of the LOSVD for each galaxy in Tables 9 and 10. We use and rather than corrected values (e.g., and used in Joseph et al. 2001) for reasons listed in BSG, and for the most direct comparison to published results. Hereafter, we refer to and as and . We found that FCQ and MPL gave consistent profiles and errors. Figure 6 plots the first four Gauss-Hermite moments for both FCQ and MPL for NGC 4473. FCQ showed more scatter than MPL in galaxies with poorly defined lines (e.g., NGC 4649). We plot only the MPL-derived , , , and against in Figures 8-19.
The Monte Carlo simulations used to measure the uncertainties also provides an estimate of the estimator biases. This bias may be important for the dynamical models since the shape of the velocity profile at some level determines the internal orbital structure. Furthermore, Joseph et al. (2001) argue that estimated from FCQ is biased to lower values when the galaxy dispersion is low (less than 100 km/s). The Monte Carlo simulations provide the most accurate estimate of any biases since they simulate the exact instrumental setup and spectral sampling. We find little to no bias in our MPL estimates of the first four Gauss-Hermite moments. Another way to check biases and confidence bands is to fit to simulated datasets. We have done this for both FCQ and MPL. The FCQ results are similar to what is discussed in Joseph et al. (2001); that is, for galaxies with dispersion below 100 km/s, is biased to lower values by about 0.04 for S/N=30 per angstrom, which is typical for these data. Figure 7 shows the results for MPL run on simulations using the same setup we used on the STIS galaxies, and for S/N ratios of 15, 30 and 60 per angstrom. The MPL results show no bias in either the or . Also, the uncertainties determined from the simulated datasets agree with those determined from the galaxy spectra at the same S/N. I.e., at S/N=40 per angstrom, we obtain MPL uncertainties on and to around 0.02. After correcting for the bias in FCQ, the uncertainties on and are similar.
While we report the first four Gauss-Hermite moments in Table 10, we use the non-parametric velocity profile for the dynamics. These moments are reported only to provide a simple parameterization of the velocity profile for comparison and correlation studies. An important difference is that the non-parametric velocity profiles are not allowed to be negative at any point. Using only the first four moments of a Gauss-Hermite expansion will allow negative portions of the velocity profile. This is unphysical, but the effect should be small (at least when and are small). Thus, the optimal comparison for the dynamical models is to use non-negative velocity profiles.
We now discuss each individual galaxy. We will include special points of interest, and a comparison to published kinematics, where available.
5.1 NGC 821
NGC 821 is classified as .E.6.$. (de Vaucouleurs et al. 1991,
hereafter, RC3). The uncertainty is likely to originate from its
resemblance to an S0. NGC 821 is a clear example of an elliptical
with disky isophotes (Lauer 1985; Bender et al. 1988 (BDM); Nieto et al. 1991). As is typical of such galaxies, it has a power-law surface
brightness profile at HST resolution Ravindranath et al. (2001).
NGC 821 is not detected in X-rays (Pellegrini 1999), or in H (Macchetto et al. 1996). It also does not appear to contain dust (Forbes 1991) although it is detected by IRAS in 100 m (Roberts et al. 1991). Trager et al. (2000) estimate the average age of its stellar population to be 8 Gyr.
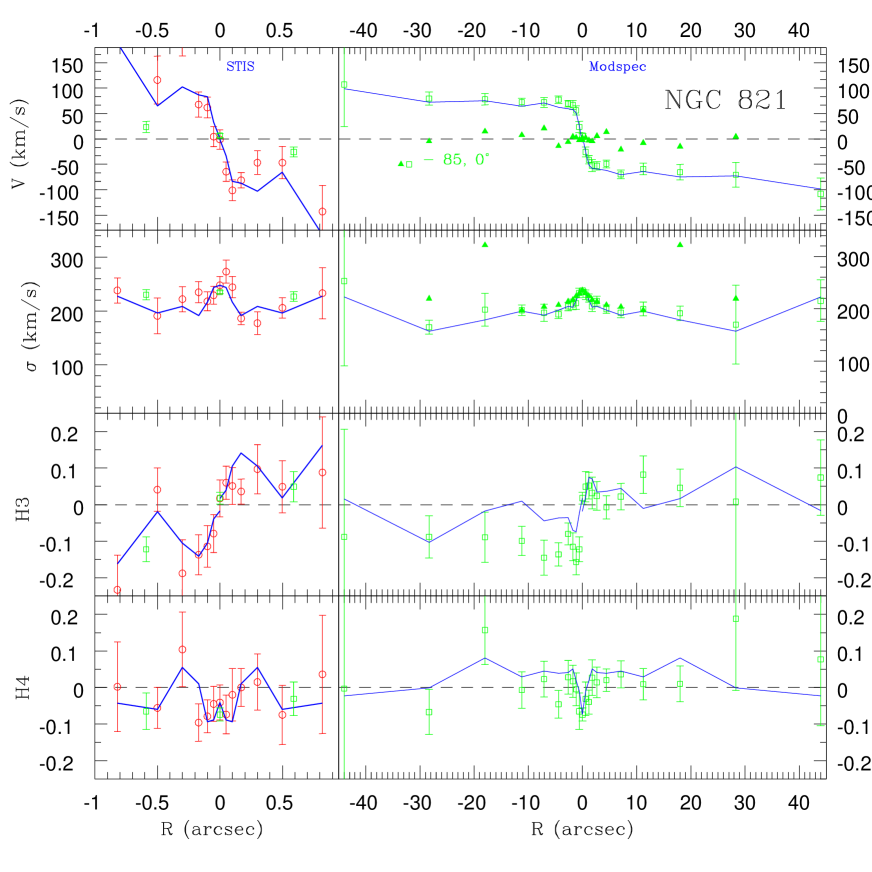
Kinematics show NGC 821 to be a fairly rapid rotator; Nieto et al. (1988, 1994) measure (/) 0.71 and we find 0.54 for our ground-based data (Table 8) and 0.75 using our higher STIS (Table 7). We get / 0.4 (Tables 7 and 8) which is lower than previous values (0.49 in Bender 1988; 0.65 in Busarello et al. 1992).
Our kinematic profiles from Modspec are similar to those of BSG. Both show that the rotation rises quickly to 60 km s-1 at 2″. The STIS kinematics show the largest velocity gradient at 017 in the sample (Table 7). nicely mirrors the velocity profile, as is typical in a rotating, edge-on elliptical. Our ground-based shows a different behavior than in BSG: we find positive values at 2″and negative values in the central bin, whereas BSG finds only . Our values are probably more reliable in this case because we have a longer effective exposure time. The main difference between our data and others is the central rise in velocity dispersion. We measure a higher ground-based value, 2352 km s-1. McElroy’s (1995) weighted average of published velocity dispersions was 207 km s-1, and Hypercat Prugniel et al. (1998) gives the average of 12 velocity dispersions to be 209 km s-1. Our Modspec value does not exceed our central STIS measurement (248 km s-1), and may simply be a result of good seeing. When we measure the rms dispersion within a slit aperture of length 2 (i.e., ), we find 209 km s-1, in agreement with the published averages.
5.2 NGC 2778
NGC 2778 is the second least luminous elliptical in the sample with mag. It is located close to NGC 2779 in a group. Trager et al. (2000) estimate the ages of its stars to be only 6.0 Gyr. Its isophotes indicate an E2 morphology with a power-law profile (Peletier 1990; Lauer 2002, private communication).
Our STIS observations for this galaxy were the only ones taken in Backup Guiding Mode during the HST visit. During galaxy acquisition, only one of the two guidestars was found so that drifting about the roll axis was only constrained by gyros. Our parallel observations with the WFPC2 show virtually no change in the centroid of a galaxy image between the first and last (6th) orbit. Since the PC chip is about as far from the guide star as the STIS slit, there was probably no significant error in the STIS guiding.
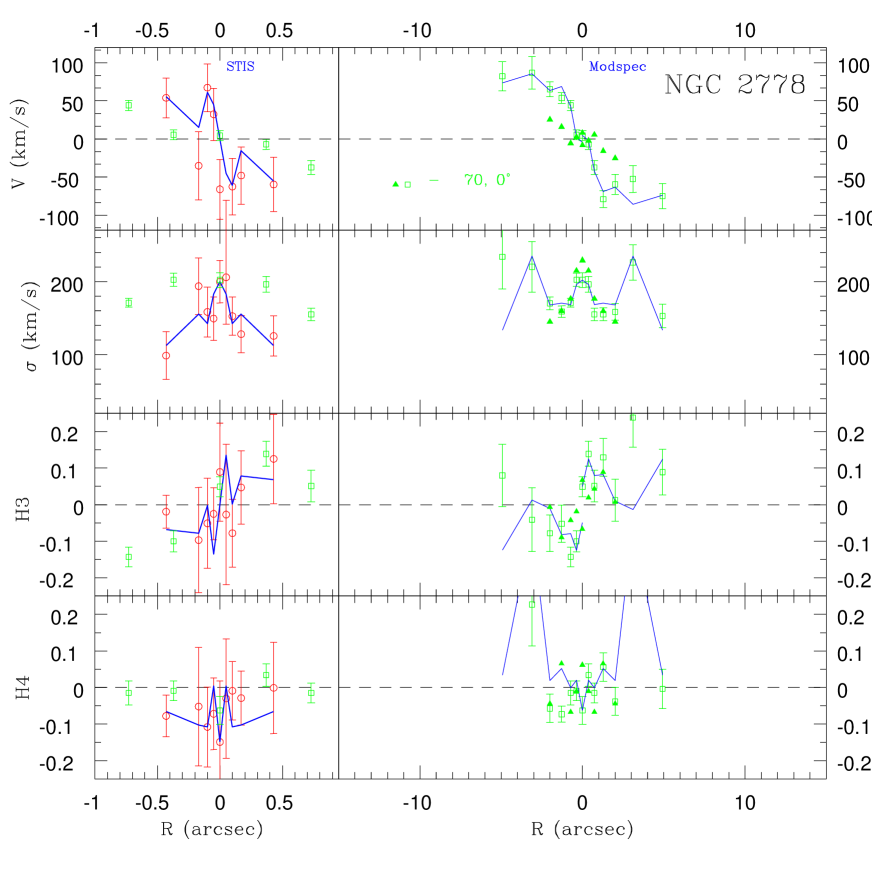
Davies et al. (1983), González (1993) and Fisher et al. (1995) all provide kinematic profiles for NGC 2778. These rotation curves extend beyond ours to 250. The maximum rotation velocity, 100 km s-1, is reached by about 5″. No rotation was observed along the minor axis; the galaxy is approximately an oblate, rapid rotator (Jedrzejewski & Schechter 1989). All dispersion profiles show a steep rise from 100 to 200 km s-1in the inner 5″. This galaxy has the greatest deviation from the relation in our sample: it has a small BH mass for its effective dispersion. The low surface brightness (see Fig. 5) and poorly resolved sphere of influence ( 0.02″) make the BH detection in NGC 2778 relatively uncertain (Gebhardt et al. 2003).
5.3 NGC 3384
NGC 3384 is classified as SB(s)0-: (RC3). It is in the Leo-I
group,
neighbored closely by the elliptical
M105 (NGC 3379) and the spirals M95 and M96. It appears to have
been named redundantly in the NGC as NGC 3371.
Several H I clouds orbit around NGC 3384 and 3379
in a 200 kpc diameter ring formation (Schneider 1985).
The H I has been interpreted as gas stripped during an encounter
between NGC 3384 and the spiral NGC 3368 (Rood & Williams 1985).
The inner regions of NGC 3384 appear largely free of interstellar matter (ISM):
Tomita et al. (2000) find no dust in WFPC2 color-excess images.
In the WFPC2 V and I images (Fig. 1), NGC 3384 appears consistent with a lenticular morphology. The Nuker-law profile shows a rapid transition () between inner cusp region () and the outer power-law () at the break radius = 29 (Lauer 2002, private communication). There also appears to be light in excess of the Nuker law at 03. Tomita et al. (2000) use the V and I images to search for dust and blue nuclei. They suspect a blue nucleus in NGC 3384, but claim that it is uncertain because the center is saturated on the PC. High resolution, ground-based imaging also hints at a nucleus (Kormendy 1985). Our deconvolved surface brightness profiles show a nearly flat V-I profile. Our near-infrared light profile along the STIS slit (which is not saturated) shows a strong central peak, but not necessarily a stellar nucleus (Figure 5). Also, we do not see Paschen absorption in our Ca II spectra which would indicate a young stellar population.
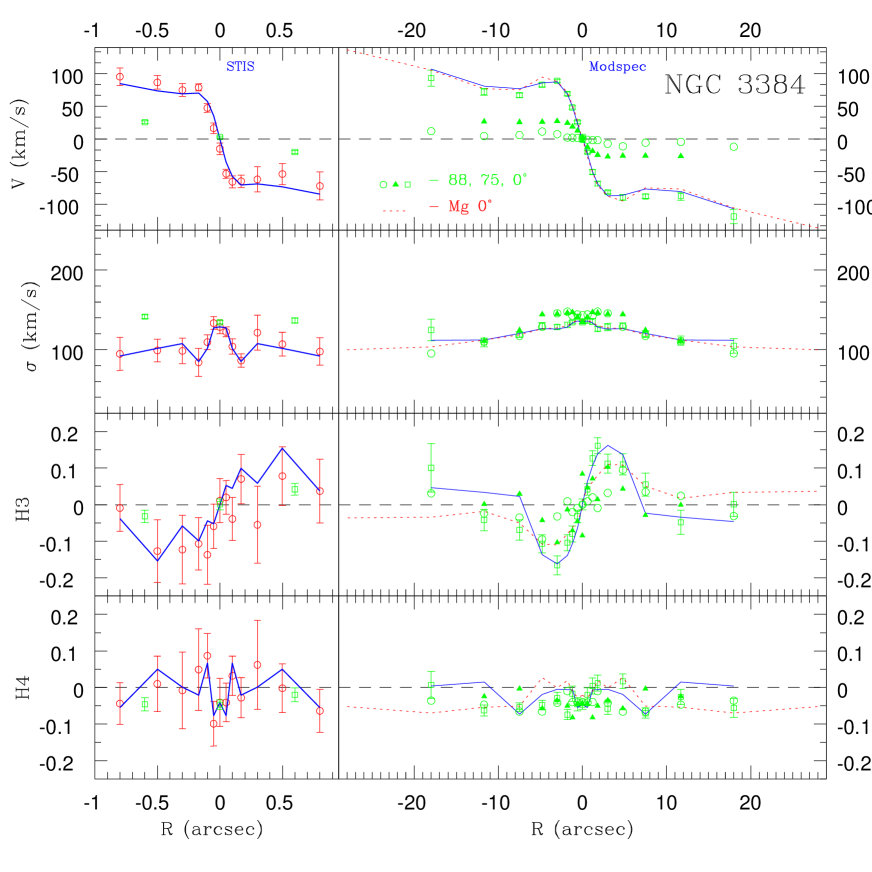
NGC 3384 has the highest S/N ( 40 in central bins) among our STIS datasets owing to its high surface brightness (=13.7 mag arcsec-2) and 11 orbits of exposure (Table 3). Our ground-based kinematics are also of high quality (Fig. 10). We have both Ca II triplet (solid line) and Mg b (dashed line) data along the major axis. The results we obtain from these two wavelength ranges are consistent.
Our Modspec kinematics for NGC 3384 can be compared to the integral field spectroscopy of de Zeeuw et al. (2002), and to long-slit spectroscopy by Fisher (1997), and Busarello et al. (1996). All rotation velocity curves peak at 30 followed by a decrease. Then, beyond 10″, the rotation climbs again. Such an “overshoot” is seen in other S0 galaxies, most notably NGC 4111, and in about 5-10 of the 18 S0 galaxies studied by Fisher (1997) display some sort of overshoot or kink in their rotation at 5″. De Zeeuw et al. and Fisher plot minor-axis profiles which indicate that the rapidly rotating disk component has a lower velocity dispersion than the bulge. This is also seen in our 75° and 88° rotation curves which show a higher dispersion beyond 2″ than the major axis data (Fig. 10). Thus, it appears that a cold stellar disk contributes differentially to the total light, increasing the fitted rotation velocity and decreasing the dispersion at small radii. At STIS resolution, however, the major axis dispersion profile shows a distinct peak at 02. The stellar disk also contributes to the strongly asymmetric LOSVDs: our data show a peak value of 0.15 along the major axis, the highest in our sample after NGC 4697. Our ground-based values are systematically lower than those of de Zeeuw et al. and Fisher, but all show a dip at .
NGC 3384 has some of the observed characteristics of a pseudobulge, i. e., a high-density central mass component that resembles a bulge but that is thought to have been built by the inward transport of disk gas by (in the present case) a bar. This secular process is qualitatively different from the classical picture in which bulges form on approximately a collapse timescale by violent relaxation and dissipation in a galaxy merger. Pseudobulge characteristics of the present galaxies are discussed in Kormendy et al. (2002), and more general reviews of pseudobulges are given in Kormendy (1993) and Kormendy & Gebhardt (2001). In essence, pseudobulges are left with some memory of their origin – they have disky structural properties. In NGC 3384, the pseudobulge dominates the light at radius , i. e., interior to the bar, which is most important at to 20′′ (Busarello et al. 1996; Jungwiert et al. 1997). In NGC 3384, the evidence for a pseudobulge includes the highest value in Table 7, an unusually high value in Table 8, and the observation that the “bulge” is almost as flattened as the disk (its ellipticity in Table 8 as compared with for the outer disk (Davoust et al. 1981; Busarello et al. 1996). Consistent with this, Bureau et al. (2002) and de Zeeuw et al. (2002) find evidence for a “disk embedded in the bulge” (high rotation and a flattened light distribution) from SAURON observations.
5.4 NGC 3608
NGC 3608 is a core galaxy in the Leo Group, separated by only 5.8′ (39 kpc) from NGC 3607. It is undetected at 6 cm (Wrobel & Heeschen 1991) but contains extended X-ray emission (, Pelligrini 1999). Surface photometry shows an E2 elliptical with slightly boxy isophotes beyond 5′′. Nuker-law parameter fits are published for the WFPC1 data in Lauer et al. (1995) and Faber et al. (1997), and we tabulate the parameters for the WFPC2 V image in Table 5. NGC 3608 has a definite “core” profile with 0.06. There is evidence for patchy dust in the WFPC2 data. Carollo et al. (1997) note an elongated dust feature in the innermost 0.′′6 (67 pc for Mpc) that looks like an off-centered ring. Tomita et al. (2000) estimate the dust feature to be 190 pc across. Singh et al. (1994) suggest that the interacting neighbor, NGC 3607, has acquired gas and dust from NGC 3608.
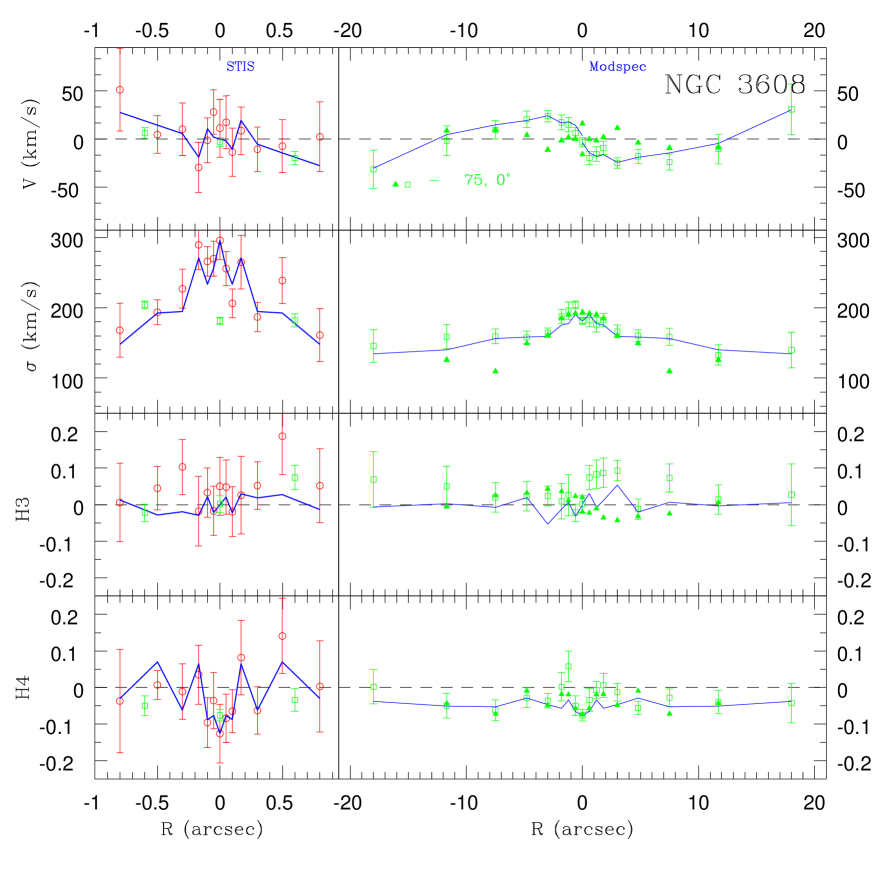
Our ground-based kinematics can be compared to those in Jedrzejewski & Schechter (1988, 1989). Our mean velocity and velocity dispersion profiles are consistent with those published by these authors, although they plot a few more points beyond 20″. The outstanding feature of NGC 3608 is the kinematically distinct core. The slope of the rotation curve changes sign at about 5′′ (coincident with the onset of boxy isophotes), and the rotation itself changes sign at . The maximum rotation is only 24 km s-1, giving NGC 3608 the lowest in our sample. Our STIS velocity dispersion profile shows a central peak which is higher than the ground-based value by about 100 km s-1. Also notable is the significantly negative central values in the ground-based data.
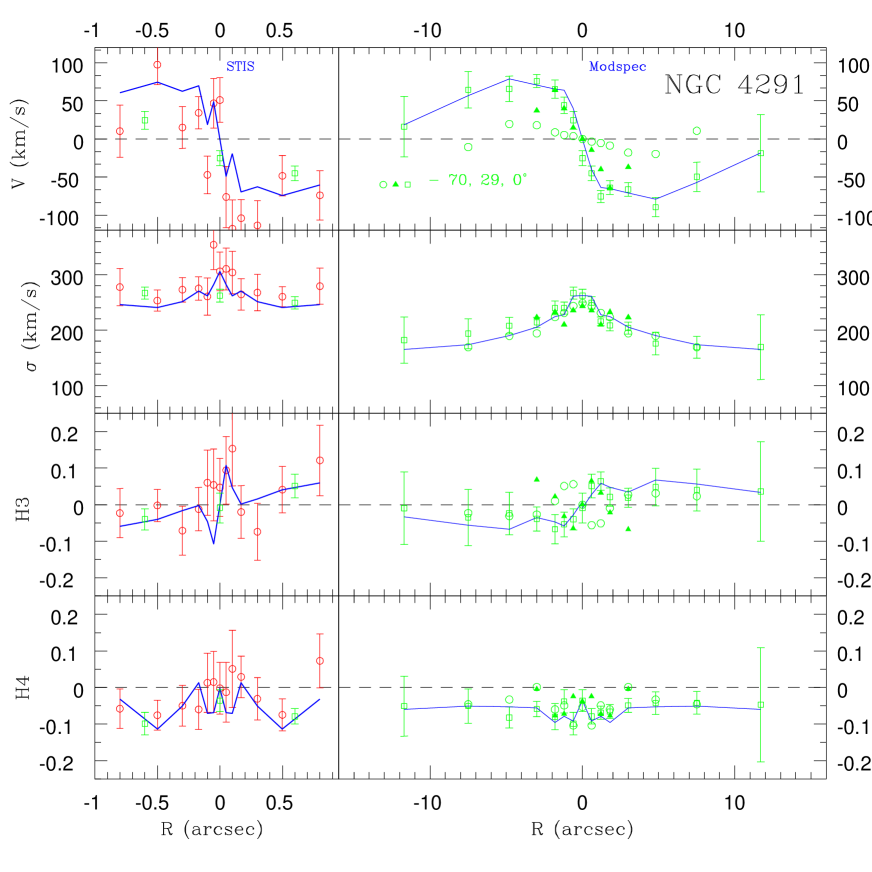
5.5 NGC 4291
NGC 4291 has a low luminosity for a core galaxy, M mag. Michard & Marchal (1994) suspected a peculiar asymmetric envelope, but it is difficult to distinguish because of nearby stars. It is neighbored by NGC 4319 only 7.4′ (56 kpc at Mpc) away, but does not appear to be interacting (RC3). Like other core galaxies, it has slightly boxy isophotes ( = , BSG), and an excess of X-ray emission above that expected from binary stars alone (Pellegrini 1999).
Our STIS light profile for NGC 4291 (Figure 5) shows a slight excess at 01. No strong evidence exists for a central excess in the light profile of the WFPC2 images.
Our major axis kinematics for NGC 4291 can be compared to those of BSG and Jedrzejewski & Schechter (1989). All datasets show a centrally rising velocity dispersion which peaks at 270-300 km s-1. The rotation peaks at 80 km s-1 at about 5″ and then declines to about 40 km s-1 by 12″. This overshoot is reminiscent of disky galaxies like N3384, but there is no photometric evidence for a disk in NGC 4291. The other authors also show minor axis spectra, whereas we have a spectrum offset by 29°. NGC 4291 shows very little minor axis rotation (e.g., km s-1; Jedrzejewski & Schechter 1989; BSG). The velocity profile shows an asymmetric “overshoot” at 5″ suggestive of a co-rotating core. We find lower values in our ground-based data than do BSG. The BH mass estimate from the 2-integral modeling of Magorrian et al. (1998) is 1.9 , while 3-integral modeling applied to the data herein give 3.1 (Gebhardt et al. 2003). This is the largest such discrepancy in our sample. We believe it results from the Magorrian et al. (1998) assumption of isotropy. Wrobel & Herrnstein (2000) observed NGC 4291 in 8.5 GHz and placed an upper limit on its ADAF accretion rate using the Magorrian et al. (1998) BH mass estimate.
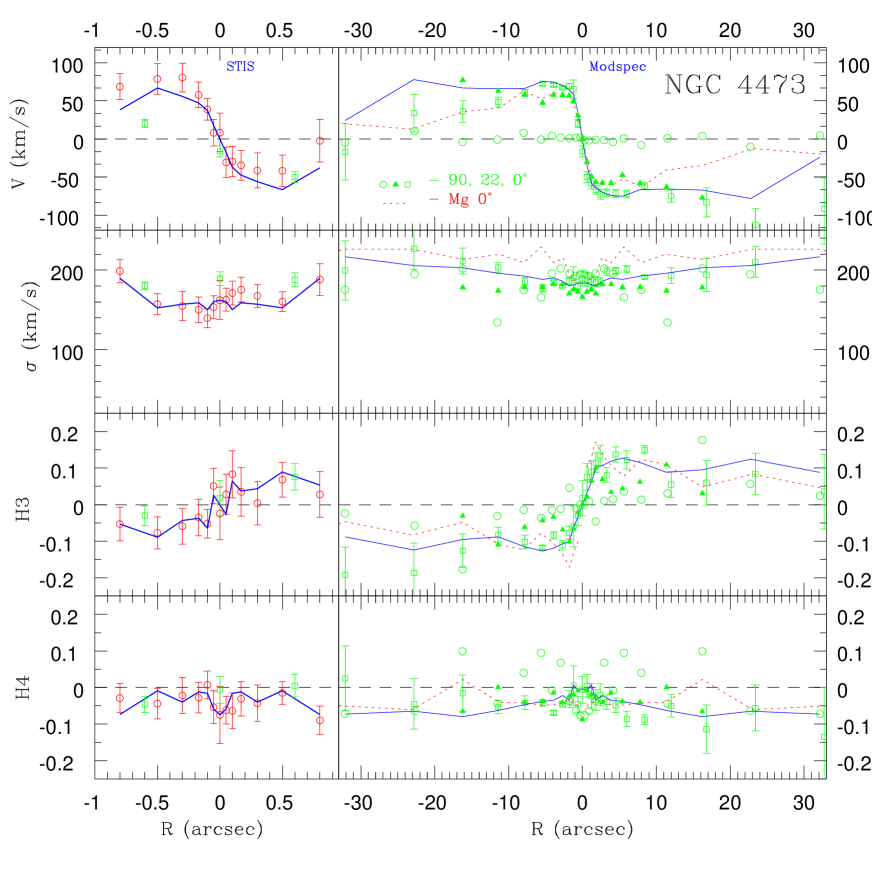
5.6 NGC 4473
NGC 4473 is an E5 galaxy in the Virgo Cluster. As seen in other E5 galaxies, the isophotes are primarily disky (BDM; Michard & Marchal 1994). Van den Bosch et al. (1994) note some irregularities in the higher-order deviations from ellipses between 2″ and 4″. But ground-based surface photometry generally reveals an ordinary, disky elliptical.
Some searches for an ISM, dust, and emission-line gas have found none (Roberts et al. 1991; Michard & Marchal 1994; Ho et al. 1997), while Macchetto et al. (1996) detect a small amount (1200 ) of excited gas in H, and Ferrari et al. (1999) report a similarly sized dust disk at their limit of detection.
Our kinematic measurements are very good for NGC 4473 because of its relatively high surface brightness (see Fig. 5). In particular, the signal in the higher-order moments, and , is relatively strong (Figure 13). Our ground-based values of are in good agreement with BSG, but our and values are systematically lower. We find to be negative at most radii and gradually increasing toward the center. then shows a central dip at STIS resolution. Our profile shows a gradual decrease toward the center where our ground-based values are about 10 km s-1 lower than those of BSG. However, our central, Modspec dispersion (183 km s-1) agrees with the average of 11 sources in Hypercat, 179 km s-1. Young et al. (1978) published long-slit spectroscopy out to 45′′. They measure a of 60 km s-1 and = 180 km s-1. Morton & Chevalier (1973) measured a higher rotation velocity, 100 km/s at . Our ground-based is 75 km s-1. Michard & Marchal (1994) point out that this rotation is surprisingly small for a disky elliptical.
![[Uncaptioned image]](/html/astro-ph/0306464/assets/x15.png)
Top: deconvolved, WFPC2, V and I surface brightness profiles of NGC 4473. Bottom: () color profile.
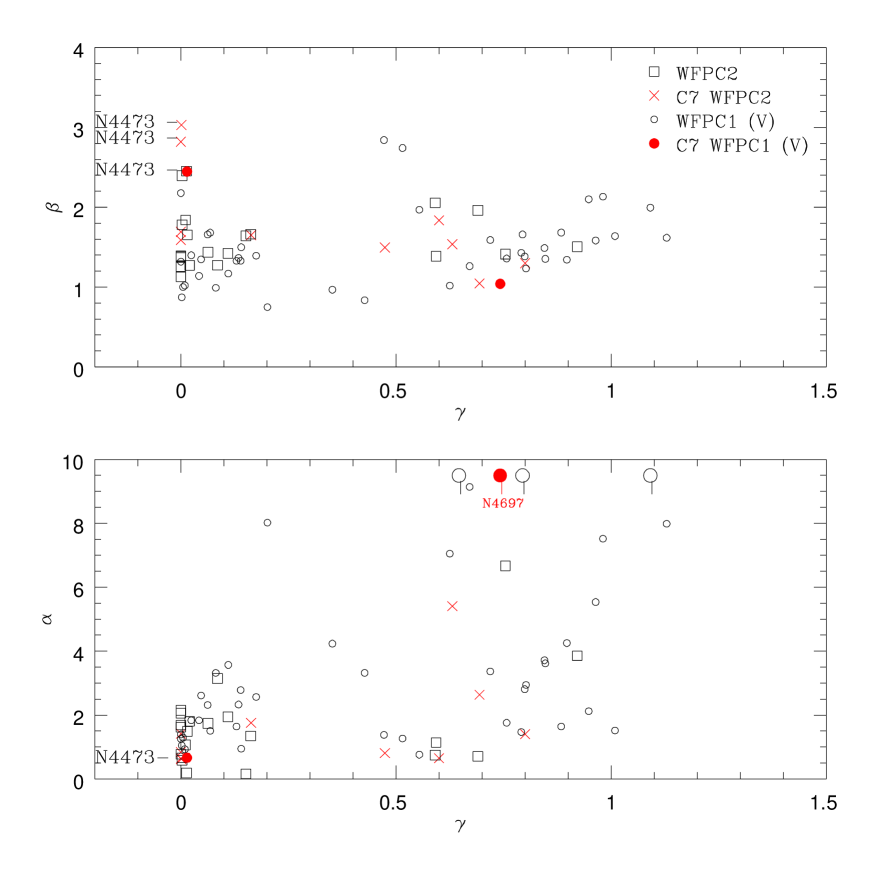
The high-resolution HST imaging reveals NGC 4473 to be an unusual galaxy (see Byun et al. 1996 for WFPC1 results, Table 5 for WFPC2 and results). Its surface brightness profile (Fig. 5.6) has an asymptotic inner slope, (WFPC2 -band, in WFPC1). This makes it a core galaxy, by definition (; Faber et al. 1997). However, the transition between the inner and outer slopes is very gradual ( for WFPC1; 0.70 for WFPC2), while all the other cores have = 1.0-8.0 (the next smallest being NGC 3608, with the counter-rotating core). Furthermore, the outer slope of the profile ( and 2.7 for WFPC1 and WFPC2 -band, respectively) is very steep – it has the highest among the cores in Byun et al. (1996). Figure 14 demonstrates how NGC 4473 has unusual Nuker parameters. Finally, the absolute magnitude, M mag, is consistent with power-law galaxies, falling faintward of the region of overlap between power laws and cores (Faber et al. 1997). Why does a relatively faint, E5, disky elliptical have the central profile of a core galaxy?
A recent merger can provide several explanations for these peculiarities. First, the merger could contribute a secondary nucleus which could artificially flatten the inner surface brightness profile and account for the gradual transition between the inner and outer slopes. Second, the merger could deposit dust which masks the central surface brightness peak. Third, the merger may be accompanied by an inflow of gas which forms into a stellar disk or torus which, in turn, makes the original peak less distinct.
There is some evidence for each of these scenarios. For example, a disky stellar structure at ″ is suggested by the increasing ellipticity of isophotes towards the center; WFPC1 surface photometry shows isophotes increasing in ellipticity from 0.36 at 15″ to 0.5 at 05 (van den Bosch et al. 1994). Evidence for the recent formation of a stellar disk includes the blue color of the stellar disk detected in ground-based images (Goudfrooij et al. 1994). The presence of dust is supported by the aforementioned observation of central dust and gas (Ferrari et al. 1999). Finally, in support of double nuclei or tori, Byun et al. (1996) noted “double nucleus?” for NGC 4473 in their Table 1. Perhaps it is no coincidence that NGC 4473 also shows the most conspicuous asymmetry in its STIS light profile for our entire sample – a shoulder located 0.2″ from the peak (see §4.5, Fig. 5).
The above conclusions that dust, blue colors, and secondary nuclei are present are all based on only marginal detections. Thus, we have inspected the deconvolved WFPC2 images for corroborating evidence. The and band images (Figure 15) have 2000 s and 1800 s total exposure, respectively. They provide higher resolution than the WFPC1 data used by van den Bosch et al. (1994). Our HST () color profile in Figure 5.6 does not confirm the blue color of the disk, although blue and red light may be mixed within each elliptical isophote. A double nucleus is not present in the form of two, distinct maxima. However, the contours appear compressed along the minor axis so as to make isophotes “peanut” shaped at 0.2″. Ellipse fitting reveals that the strong diskiness in isophotes at 1.6″ (peaking at 100 = at 4.3″) suddenly gives way to very strong boxiness at ″; the 100 drops below at 0.23″ and then returns to values consistent with 0 at the resolution limit (). The noisiness of the deconvolution process should be taken into consideration; the peak pixel is not in the same position in the two bottom images and the minimally-smoothed contours are noisy. However, the position of the boxiest isophotes is robust, occurring at 0.2″ in both the and band deconvolved images and reaching magnitudes as low as 100 = -5 in both datasets. The top panels of Figure 15 shows that subtracting a purely elliptical model leaves behind an ””–shaped residual in both cases. The offset of the peak residual from the best-fit ellipse centroids is also robust, suggesting an asymmetric enhancement about 0.1″ from those centroids. At ″ (not shown), the residual pattern inverts to a dark “+”, indicating the diskiness previously reported by others.
-band WFPC2 data shown with the STIS slit overlayed to match the observation. The circle is 02 wide. North is 173° clockwise from up, and the position along the slit used elsewhere in this paper increases towards the left.
The asymmetry we see in the residuals after subtracting an elliptical model are one way to explain the shoulder in the light profile along the STIS slit. A more direct test is to simulate the STIS slit aperture on the WFPC2 data and create light profiles. These profiles are shown in Fig. 5. The light is more concentrated near the center because of the greater spatial resolution in the WFPC2 data, especially in the deconvolved data. Nevertheless, the profiles are higher to the right of the center than to the left under the “double nucleus” label. Figure 5.6 is an overlay of the 02 STIS slit onto the -band WFPC2 image. Notice that the STIS slit is skewed with respect to the major axis by 20°, more than any other galaxy in our sample (this was necessary to acquire the guide stars). Nevertheless, the position of the slit allows the passage of some light from the region which created the ””–shaped residuals.
There are no obvious signs of a recent merger in the kinematics. No counter-rotation is seen in the velocity profile, and the velocity “overshoot” seen at 5″ is typical of ellipticals with embedded disks. The photometry and STIS light profile (Fig. 5) suggest a possible secondary nucleus at , so a kinematic deviation might be expected at STIS resolution. The unsymmetrized STIS dispersion in Figs. 13 and 6 does, in fact, show a smooth gradient across the center, but it is only marginally significant. NGC 4473 , like NGC 3384, has a lower central dispersion in the STIS data than in the ground-based data, indicating a kinematically cold stellar population near the center. These two galaxies are interesting to contrast: both show kinematic and photometric evidence for a cold stellar disk all the way into the center, yet NGC 4473 has much lower than NGC 3384. Moreover, NGC 4473 has a core profile with an indistinct center, while NGC 3384 has a power-law profile with the strongest central peak in our sample.
We conclude that NGC 4473 is a peculiarity – a disky galaxy lacking a strong central cusp – and that its peculiarities probably originated with a merger. The occurrence rate of such ‘disky cores’ is low, judging by the study of Rest et al. (2001) which classifies only 1 of 9 cores as “disky” (within a sample of 57 galaxies). Any obvious evidence for a recent merger is absent; there is no counter-rotating stellar or gas system, no erratic dust, and no multiple nuclei. But current work on the formation of cores (e.g., Faber et al. . 1997; Milosavljević & Merritt 2001; Makino 1997) involves the merger and coalescence of two galactic nuclei with BH, and these scenarios predict that observability of the merger will diminish continuously. Some cores have been identified with easily resolved double nuclei (e.g., NGC 4486B, Lauer et al. 1996), and recently, six cores have been identified with subtle “central inversions” in their surface brightness profile which are likely to be toroidal stellar systems (Lauer et al. 2002). NGC 4473 may be another case of subtle central structures resulting from coelescing binary nuclei. Like most of those in Lauer et al. (2002), it has a poorly defined central peak and “peanut”-shaped isophotes. NGC 4473 differs in that it has disky isophotes at 1″. Alternatively, no BHs were contributed by the last merger, only gas which has subsequently formed a substantial disk at 1.5″and a non-cuspy structure (possibly a torus) near the limits of resolution. Future imaging at slightly higher resolution should clarify the central structure.
5.7 NGC 4564
NGC 4564 is classified by Sandage & Tammann (1980) as an E6, but it has characteristics of an S0. First, its isophotes show disky deviations from an ellipse at large radii. The parameter begins to climb at 10″, reaching about 0.025 at 20″ and then tapering down to 0.01 (BDM). Such diskiness at intermediate radii is also seen in NGC 821. Second, its ellipticity increases gradually from 0.2 at ″ to 0.6 at 30″ (BDM). Sahu et al. (1996) decompose their band image into an elliptical bulge (obeying a de Vaucouleurs law) and a disk. Their scale length for the disk is with axial ratio . Third, Sil’chenko (1997) finds a younger stellar population in the center of the disk (8 Gyr) compared to the rest of the galaxy.
High-resolution images were obtained with WFPC1 (PID 2607, Byun et al. 1996) and WFPC2 (Jaffe, PID 6357; Faber et al. 1997). In the center, NGC 4564 appears more bulge-dominated, with rounder isophotes and boxy deviations from ellipses. For example, van den Bosch et al. (1994) find that the ellipticity is only 0.16 at 05 and that is significantly negative around 20. They also find sharp variations in PA and near 20. This is indicative of dust; however, Roberts et al. (1991) do not find evidence for an ISM.
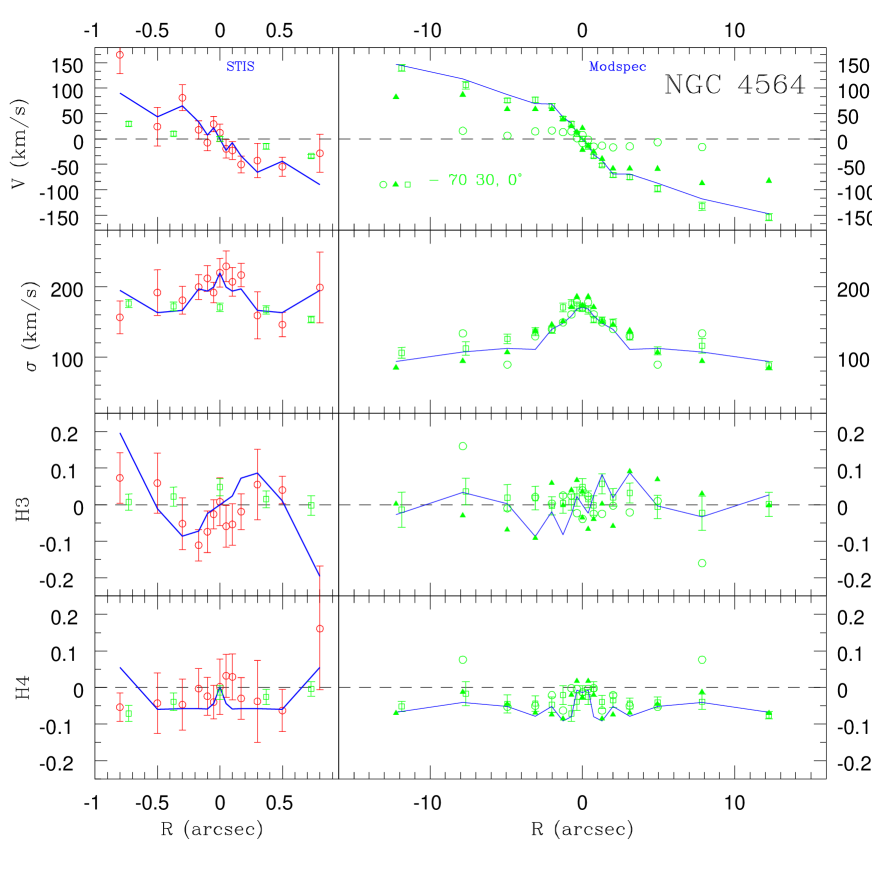
Our ground-based kinematics for NGC 4564 (Figure 16) can be compared to those of BSG and Halliday et al. (2001). Our spectra have relatively low S/N (Figure 2). The published profiles are in good agreement with ours, but are plotted to greater radii (r = 35″and 40″, respectively). The velocity dispersion declines by a factor of 2 from 0″to 10″, so one should expect large variations in published values of -dependent quantities. For example, Bender 1988 give a / of 1.11 (5 km s-1, =1355 km s-1) while we have 1.3 (4 km s-1, = 11217 km s-1, see Table 8 ). The average of 6 central velocity dispersions in Hypercat is 158 km s-1, while we measure 170 km s-1 in all of our Modspec PAs. Asymmetric () deviations of the LOSVDs from a Gaussian are not significant, but appears to be negative at 10″. Halliday et al. (2001) show becoming negative beyond 10″, coincident with an increase of above 0. The sudden changes in the PA, ellipticity, , and coefficients at 20 (van den Bosch 1994) are coincident with subtle bends in our profiles of symmetrized , , and .
The STIS kinematics feature a central velocity dispersion peak of 22020 km s-1, well above the ground-based result. The higher resolution also reveals rotation of 50 km s-1 in the inner 10. and are fairly noisy, but the symmetrized curves indicate a gradient in across the inner 05, and predominantly negative . The kinematics allow a secure detection of a BH (Gebhardt et al. 2003), but little evidence for nuclear activity is found in X-rays (Pellegrini 1999) or radio continuum (Wrobel & Herrnstein 2000).
5.8 NGC 4649
NGC 4649 (M60) is a giant elliptical in the Virgo cluster, comparable in luminosity to M87. NGC 4649 stands out in our sample as the galaxy with the lowest central surface brightness (Fig. 5) and highest luminosity. It is the only galaxy with a large enough dispersion so that the crowding of the Ca II triplet absorption lines becomes problematic. This will be discussed further in §6.
We find a BH in NGC 4649 (Gebhardt et al. 2003), only about 30% less massive than the BH in M87 (Macchetto et al. 1997). Fortunately, it has far weaker nuclear activity than M87, thus simplifying a BH search. Nuclear activity is detected in the radio (Fabbiano et al. 1987) and but not in the optical or X-rays (Byun et al. 1996; Di Matteo & Fabian 1997). Stanger & Warwick (1986) also find only low-level extended radio emission out to 30. Di Matteo & Fabian (1997) estimate that the total measured core flux from radio to X-ray is lower than 1041 erg s-1.
NGC 4649 is separated by only 2.5′ ( kpc for a distance of 16 Mpc) from the spiral NGC 4647. Many studies report that they are non-interacting (e.g., Sandage & Bedke 1994), although the spiral is clearly asymmetric (see Koopman et al. 2001). It is given an E2 morphology in the RC2 (de Vaucouleurs et al. 1976), but Sandage & Bedke (1994) think it is an S01 because of its “prominent extended envelope.” NGC 4649 has an extended X-ray halo (Bohringer et al. 2000), and it has been identified with its own compact subgroup within the Virgo cluster (Mamon 1989).
CCD surface photometry has been performed by Peletier et al. (1990), Caon et al. (1990), and Michard & Marchal (1994). There are no significant deviations from ellipses in the isophotes between 1″and 8″, and then they become mildly boxy (). The maximum ellipticity measured by Peletier et al. (1990) is which suggests a nearly face-on inclination ( °). This makes difficult the detection of disky isophotes (Michard & Marchal 1994). Instead, support for the S0 classification is found in the surface brightness profiles which show an outer envelope above the -law bulge. There is no strong evidence for a tidal influence from nearby NGC 4647. HST WFPC2 -band photometry is discussed by Byun et al. (1996) and Faber et al. (1997). NGC 4649 has a core profile with a break radius of 3.58″.
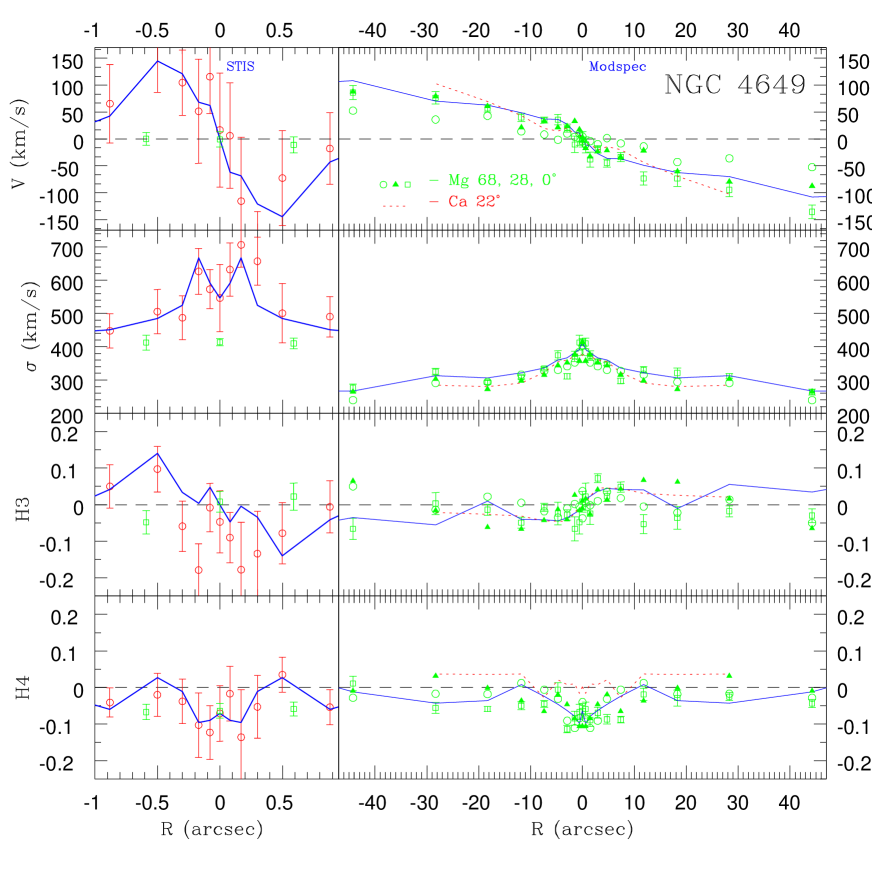
Our ground-based kinematics can be compared to Fisher et al. (1995; hereafter FIF), De Bruyne et al. (2001), and BSG. FIF report an average rotation of 87 km s-1, and their rotation curve climbs from 60 to 120 km s-1 between 20 to 60″. Similarly, our rotation curve is climbing at 45″ where it is 110 km s-1 (symmetrized). In general, NGC 4649 has strong rotational support compared to other giant ellipticals. Its large ()* stands apart from the brightest cluster galaxies in the study of FIF. Our unsymmetrized rotation curve is also fairly asymmetric with respect to the galaxy center. The data of De Bruyne et al. (2001) demonstrate this even better with a rotation curve out to 90″, showing an 70 km s-1 maximum difference in rotation between the two sides. This asymmetry along the major axis provides some support for the idea of an interaction with NGC 4647.
Our velocity dispersion profile is consistent with that of BSG and De Bruyne et al. , but FIF has systematically lower values. Most dispersion profiles peak at 400 km s-1and then rapidly decline to 300 km s-1 by ; they show nearly a factor of two decrease from the center to the effective radius (r). De Bruyne measures positive values within 10 whereas we measure negative here at all of our PAs.
The STIS Ca II triplet data reveal an enormous central velocity dispersion. The entire inner 10 is above 450 km s-1, and it appears to rise to over 600 km s-1. However, the uncertainties are high because of the ill-defined absorption lines (§6). This differs from the case of IC 1459 (Cappellari et al. 2002), another giant elliptical (), which has 350 km s-1 in both STIS and ground-based observations. Another unusual (but uncertain) feature is the strong rotation within 10. The maximum STIS rotation, 150 km s-1, exceeds the maximum ground-based rotation.
5.9 NGC 4697
This is an E6 galaxy with a stellar disk along the apparent major axis (Carter 1987; Goudfrooij et al. 1994a ). NGC 4697 has more dust and gas than the other galaxies in this sample. Molecular gas was detected by Sofue & Wakamatsu (1993), and the high IRAS 100 flux densities also imply cool gas. The radial color gradient is larger than the metallicity gradient from the Mg2 index (Peletier 1990). HST WFPC1 imaging reveals an organized dust disk (Lauer et al. 1995). This dust was not successfully imaged from the ground (Véron-Cetty & Véron 1988; Kim 1989), but was suggested by the red nucleus in (Goudfrooij et al. 1994a). The H+[N II] emission proved difficult to detect (Trinchieri & di Serego Alighieri 1991; Kim 1989). Long-slit spectroscopy by Goudfrooij et al. (1994b) gives an H+[N II] flux of 2.4 erg s-1 cm-2. The narrowband imaging by these authors shows H+[N II] emission extending out to 35″. Ground-based imaging (e.g., Peletier 1990) indicates embedded, disky isophotes. The parameter is over 1.8 until = 20″and then it declines to 0.
A great deal of spectroscopy exists for comparison with our Modspec results. Bertola & Capaccioli (1975) first pointed out that ellipticals are not rotationally supported using NGC 4697. It has also been used for case studies showing that 3-integral model are an improvement over 2-integral models (Dejonghe et al 1996; Binney et al. 1990).
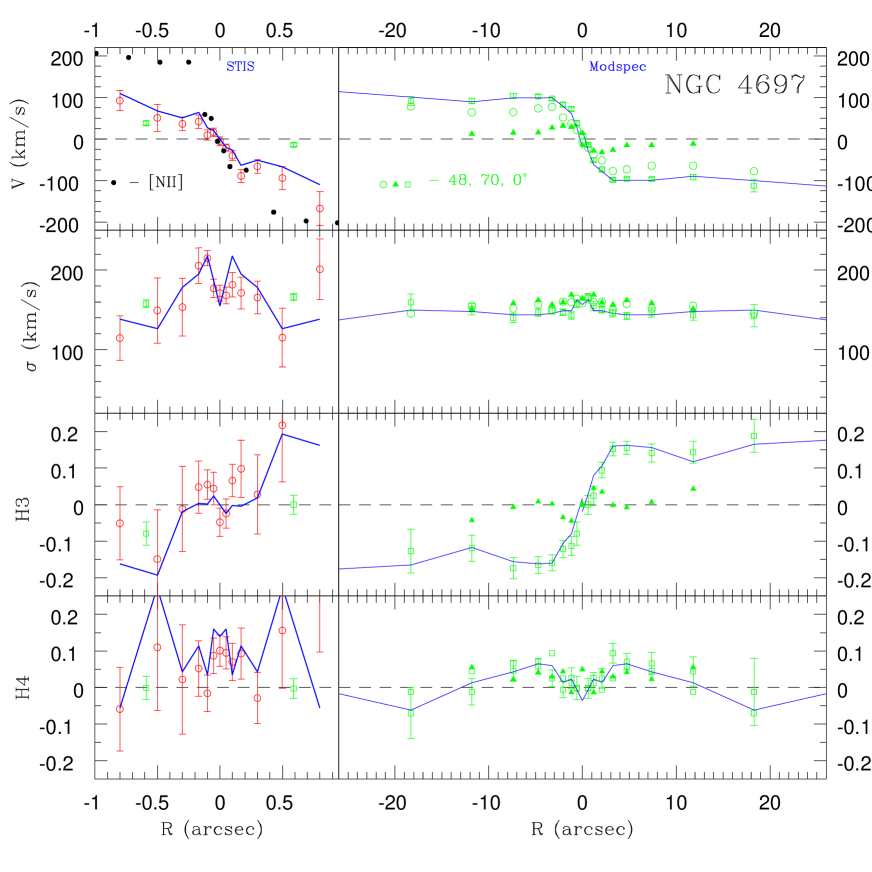
Carter (1987) points out that there is a large variation in measurements for this galaxy. Bertola & Capaccioli (1975) find 65 km s-1, Illingworth (1977) gets 90 km s-1, and Davies (1981) derives 146 km s-1. We measure a ground-based , and a STIS of km s-1. A likely explanation is the presence of a cold, rapidly rotating, stellar disk (composing more than 10% of the light along the major axis) which has a varying effect on the measured radial velocity for different methods. Figure 18 includes the rotation curve of the excited gas (black points) measured from [N II] emission with STIS (Pinkney et al. 2003). This provides an interesting contrast to the stars in that the gas shows less pressure support beyond 02.
The mean central velocity dispersion given by Hypercat is 174 km s-1. This is a bit higher than our central, GB, velocity dispersions of 157, 159, and 164 km s-1, for our 0, 48, and 70° slit orientations, respectively. We measure a higher central dispersion with STIS, 171 km s-1. This galaxy stands out as one of the few with a local minimum at in the STIS velocity dispersion profile (Fig. 18). It is also unusual in that its parameter is significantly positive (see Fig. 22)
5.10 NGC 7457
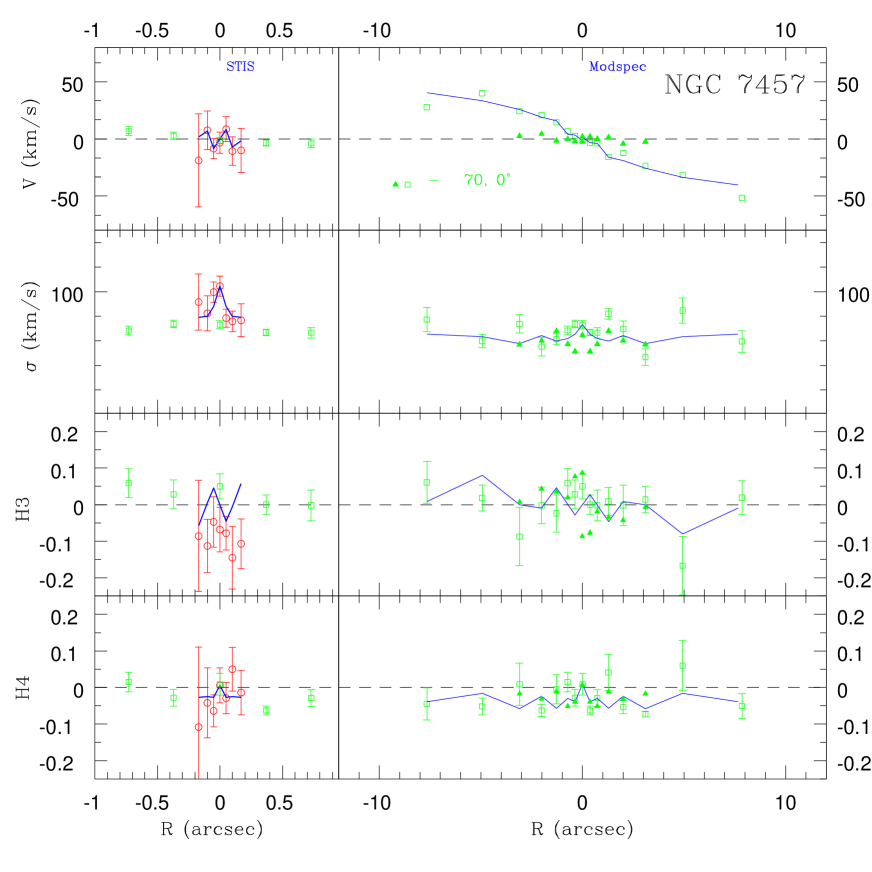
NGC 7457 is the smallest, lowest luminosity galaxy in our sample. It is an S0 galaxy, like N3384. NGC 7457 is another example of a pseudobulge (see §5.3) in our sample, based on photometry and kinematics. Tomita et al. (2000) find a point-like, bluish nucleus in the WFPC2 () data, and Peletier et al. (1999) find a young stellar population in the bulge. Michard & Marchal (1994) detect a small bar.
Lauer et al. (1991) report on the WFPC surface brightness profile and find it unresolved and steep. The improved HST WFPC2 imaging reveals a surface brightness profile with a very shallow outer power law; its (Lauer 2002, private communication) is the smallest in a sample of 29 early types. However, the surface brightness profile in Andredakis et al. (1995) has a Sersic parameter 6.2 which is higher than the values 2.0 more typical of pseudobulges. Most impressive is the strong surface brightness peak in deconvolved WFPC2 F555W data (Lauer 2002, private communication) which jumps 4 magnitudes in the inner 01. Tomita et al. (2000) do not interpret this as an AGN because of the lack of H and H emission reported by Ho et al. (1997). However, Gebhardt et al. (2003) find a central drop in calcium triplet equivalent widths and interpret the peak as AGN light.
We find evidence for pseudobulge-like kinematics for NGC 7457. Our Figure 20 demonstrates that the velocity dispersion falls low on the Faber-Jackson relation. This result is robust for different global values of from Table 8. Our / values (Table 8) are not especially large, however, given the ellipticity.


6 Discussion
6.1 Central Velocity Dispersions
To what extent does the STIS central velocity dispersion drive the detection of the nuclear black holes? Modeling is required to fully answer this question; however, a strong peak in dispersion in the central 05 ( 45 pc at Mpc) is difficult to explain without a central dark mass (van der Marel 1994b). In Figure 20, we compare the central STIS dispersion to our ground-based, “effective” dispersion, (i.e., the rms velocity relative to the systemic velocity of the galaxy, averaged over a slit width of 1″ extending to ; G00). In 7 out of 10 cases, the STIS central value is higher. The most extreme differences are NGC 4649 (162 km s-1, 42%), NGC 3608 (114 km s-1, 55%), NGC 4564 (58 km s-1, 37%), NGC 4291 (64 km s-1, 17%), and NGC 7457 (38 km s-1, 60 %). Three of these have core profiles, and it appears that the core galaxies show the largest differences. NGC 7457 has a 60% increase from to , the greatest fractional rise in the entire sample. Figure 20b demonstrates that the fractional increase does not correlate with increasing dispersion. Likewise, there is no correlation with (not shown). NGC 4473, unlike the other core galaxies, has a lower than . This adds to the growing list of differences between NGC 4473 and the cores (§5.6). The other galaxies with lower are NGC 3384 and 4697, which are also disky. However, NGC 4697 has a higher than our alternative ground-based dispersions and in Table 8. Eight of our galaxies, including NGC 3384, show a local maximum at 00 in their STIS dispersion profile. NGC 4473 shows only a slight central, local maximum, while NGC 4649 and NGC 4697 show local minima in their symmetrized profiles. Thus, the majority of galaxies (70 – 80%) show a central peak at STIS resolution, and about 70% have a larger than , Only one galaxy, NGC 4697, does not obey either criterion.
In Figure 20c, we show the Faber-Jackson (1976) relation for our 10 galaxies. The is an adequate surrogate for the traditional central dispersions measured through ″ apertures, but use of adds scatter to the relation presumably because of the strong dispersion gradient induced by the central black hole. We also find a marginal correlation between the ratio and the ratio , where is the maximum rotation in the ground-based data and is the average dispersion in Table 8. Apparently, galaxies with more rotational support have less of a dispersion peak at STIS resolution. The probability that no correlation exists is 3% (using Cox regression and Kendall’s Tau, Isobe et al. 1986) This correlation is present but not as strong if is replaced by ()* .
6.2 Low Surface Brightness Giant: NGC 4649
The galaxies in the BH literature, including our own sample, show a preference for high surface brightness in core galaxies since these are easier to observe. In fact, the measurement of dispersion profiles in core galaxies is so difficult that most of the BH detections in these galaxies rely on emission lines from rotating gas disks [e.g., M87 (Harms 1994), NGC 4261 (Ferrarese et al. 1996), M84 (Bower et al. 1997)]. In the case of the giant E3, IC1459, Cappellari et al. (2002) have measured the BH mass using stellar kinematics as well as gas kinematics. However, this galaxy does not have an especially faint surface brightness, (Carollo et al. 1997). Ground-based stellar kinematics have provided a BH mass estimate for M87 (Dressler & Richstone 1990; van der Marel 1994a) but the BH was not required to fit these data. The preference for high surface brightness cores could conceivably introduce a bias in plots of or . Moreover, the measurement of BH mass using gas kinematics gives a different answer than stellar kinematics in the only giant where they have been compared (IC1459, Cappellari et al. 2002). Thus, NGC 4649 is important as the only BH measurement from stellar kinematics in a galaxy which is representative of low-surface brightness cores.
Not surprisingly, we find that the LOSVD is particularly difficult to measure in NGC 4649. We requested sufficient exposure time to measure Ca lines in a galaxy with =15.9 mag arcsec-2 and km s-1. However, this galaxy appears to have a very large central velocity dispersion at STIS resolution. This broadens the lines to such an extent that their detection is difficult even at this S/N (Figure 21). Our MPL technique was able to measure an LOSVD with 500 km s-1. Naturally, the upper limits are more weakly constrained than the lower limits. The FCQ technique gave more erratic results (not shown in Fig. 17) for these data.
6.3 Gauss-Hermite Parameters
Our parameterized stellar LOSVDs suggest properties of a galaxy’s orbital structure that are elucidated by the 3-integral modelling. This merits a comparison between the two. Gebhardt et al. (2003) find the tangential component of the velocity dispersion tensor to be stronger in the central bins of the galaxy than in the bins near (see Figure 22b). The parameter also indicates a tangential bias when it takes a negative value (i.e., the LOSVD is boxy). Indeed, we find that our ground-based profiles usually have a central dip (NGC 821 is a good example). Moreover, the central, STISmeasured parameters, although noisier, are also predominantly negative. To measure a more reliable central STIS , we averaged the values from the innermost 3 bins. Figure 22 demonstrates that these values of are negative in 9 out of 10 cases. Individual cases are not significantly negative, but altogether they suggest a real trend. NGC 4473 and NGC 3608 are the most significantly negative. There is one outlier, NGC 4697, which has a positive and this pulls the weighted mean to . When this point is excluded, the weighted mean is . We looked for correlations between the central value and other photometric and kinematic parameters. The large uncertainties in the values and the small sample do not permit any significant results. A positive correlation is hinted at by Figures 22a, and 22c.
It is puzzling that the disky elliptical, NGC 4697, shows positive central values while the other disky galaxies (NGC 821, 3384, 4564, and 4473) have negative central values. One might search for other ways in which NGC 4697 differs from the other four. The most obvious difference is its prominant dust disk at ″. This disk is inclined at 77° and has a sharp outer cut-off and a less clear-cut inner radius (Pinkney et al. 2003). One would expect the same LOSVD regardless of the presence of the dust disk, if the dust disk is an infinitely thin screen centered within an axisymmetric galaxy. However, one could invoke a disk with finite thickness to preferentially obscure, say, an equatorial cold disk component and thereby influence the LOSVDs. A second possible scapegoat is the stellar disk itself, which may be more (or less) prominent in the central STIS bins of NGC 4697 than the other four disky galaxies. One expects a superposition of two LOSVDs with the same centroid but different widths to produce an LOSVD with positive . Thus, we may find positive values of in galaxies where a bulge and disk population overlap. However, there is little evidence in ground-based kinematics that NGC 4697 has a significantly different disk contribution than the other galaxies. In fact, NGC 4473 seems to have the strongest contribution of light from a stellar disk at ″ : it was the only galaxy that warranted the inclusion of a disk component in the modeling (Gebhardt et al. 2003). Finally, we see in Figure 22 that NGC 4697 has the lowest mean at ″ of the entire sample. This is another artifact of diskiness, or more correctly, of strong rotation. Unfortunately, the kinematic properties measured at do not necessarily predict the properties at where the values in question are measured.
The bottom three panels of Figure 22 complement the investigation of Gauss-Hermite parameters. First, Figure 22d shows our 10 galaxies plotted on a correlation found by BSG. Our galaxies do not follow the trend well, but this is mostly because of NGC 4564. The / in this figure uses , but if we used or (Table 8), / would be 0.9 for NGC 4564 instead of 1.3. NGC 4564 happens to have the most extreme variation between and our other two ground-based estimates for reasons that are clear in Figure 16. Second, Figure 22e demonstrates that galaxies with strong rotational support tend to be disky. This has been established with larger samples by BSG. Third, Figure 22f shows a correlation between the asymptotic inner slope of the best-fit Nuker-law surface brightness profile, and the deviations of isophotes from ellipses. This follows from the results of, e.g., Faber et al. (1997) wherein the disky galaxies (100 ) tend to have power-law profiles and the boxy-isophote galaxies (100 ) tend to have core profiles. This figure is intended to underscore the peculiarity of NGC 4473 as a “disky core.”
6.4 Demographic Results
Our sample of early-type galaxies includes a wide range of velocity dispersions (70 to 385 km s-1) and BH masses ( to ), allowing us to address questions of BH demographics (§1). A word should be said about selection effects near the high-mass end of the relationship. The measurement of LOSVDs becomes increasingly more time consuming with decreasing surface brightness. Therefore, a selection bias is introduced whereby, given two core galaxies of the same luminosity, or the same dispersion, one is compelled to select the one with the higher surface brightness. We selected one challenging galaxy located in this region of parameter space, NGC 4649, with mag arcsec-2. Nevertheless, none of our cores, including NGC 4649, represent the lowest surface brightnesses known in their luminosity range. It is not certain whether the lowest surface brightness galaxies obey the same demographic trends.
With the discovery of the relation, it is natural to look for exceptions to the rule. It appears that the relation holds for Sa and Sb galaxies with classical bulges, and even later types (Sc – Sd) with pseudobulges (Kormendy et al. 2002). The Sc galaxy M33 appears exceptional in that it has a BH mass upper limit significantly lower than that predicted using the dispersion of its nuclear star cluster (Gebhardt et al. 2001). This galaxy, however, lacks a hot spheroidal component and so it is debatable whether the relation is applicable.
In Figure 6.4, our ten BH masses are plotted against velocity dispersion. For just these galaxies, we fit an relation of the form
| (3) |
The fitting procedure is identical to the one advocated by Tremaine et al. (2002), where we have assumed 5% error in , and the uncertainty in is the measured one combined with an extra 0.34 dex of intrinsic dispersion, which gives a per degree of freedom of unity. We find and . Note that the BH masses for the galaxies used in this fit have been refined since G00. All galaxy distances are now taken from Tonry et al. (2001), and more dynamical models have been run to better probe chi-square space (Gebhardt et al. 2003). Nevertheless, the best fit is nearly indistinguishable from the G00 fit. All of these same refinements to our sample are incorporated into the preferred fit by Tremaine et al. (2002), which includes an additional 21 galaxies from the literature. The most deviant point is for NGC 2778. This faint galaxy has a lower S/N than most. Also, its sphere of influence is unresolved. Consequently, NGC 2778 has the least confident BH detection when modeled (Gebhardt et al. 2003).
![[Uncaptioned image]](/html/astro-ph/0306464/assets/x26.png)
Updated plot of for only the galaxies in this paper (labelled squares). The best-fit line to these 10 galaxies is shown as a solid line. We overlay the original fit by Gebhardt et al. 2000 (dotted line), and the preferred fit by Tremaine et al. 2002 (dashed line).
In hierarchical scenarios, the formation of bulges involves mergers which are believed to have occurred during the first few Gyr of the universe. But what is the effect of a merger occurring 1 Gyr before the present? Will the likely increase in bulge dispersion be accompanied by the appropriate increase in BH mass? We have inspected our galaxies for merger candidates to see if they are systematically displaced on the relation. Three of our galaxies show marginal evidence for recent mergers: NGC 3608, 4473, and 4697. NGC 3608 has a counter-rotating core and patchy dust. NGC 4473 has unusual photometric properties that may be related to a merging component (§5.6). NGC 4697 has a dust ring which may have been deposited by a merger. As can be seen in Figure 6.4, all three of these fall reasonably close to the relation. Two of these, NGC 4697 and 4473, are among our most secure BH detections.
7 Conclusions
We have presented long-slit spectroscopy from aboard and the MDM 2.4-m telescope that is used to derive black-hole masses for 10 galaxies by Gebhardt et al. (2000). Ninety percent of the galaxies have a centrally peaked velocity dispersion and/or a higher dispersion from STIS than the ground-based Modspec. The galaxies with the strongest rotational support, as quantified by /, have the smallest dispersion excess at STIS resolution. When only our ten galaxies are used for a fit to , the slope is 3.68, which is similar to the value of 3.75 found by G00 for 26 galaxies. We review individual galaxies and identify candidates for recent merger: NGC 4697, 3608, and 4473. These galaxies are not outliers in the relation. We also identify pseudobulges in NGC 3384 and 7457 and find that they also obey the relation. Finally, we find a trend toward flat-topped line-of-sight velocity distributions (i.e., negative values of ) at the center of the galaxies, implying a tangential bias in the stellar velocity dispersion.
References
- Andredakis et al. (1995) Andredakis, Y. C., Peletier, R. F., & Balcells, M. 1995, MNRAS, 275, 874
- Beers et al. (1990) Beers, T. C., Flynn, K., & Gebhardt, K. 1990, AJ, 100, 32
- Bender (1988) Bender, R. 1988, A&A, 193, L7
- Bender (1990) Bender, R. 1990, A&A, 229, 441
- Bender et al. (1988) Bender, R., Döbereiner, S., & Möllenhoff, C. 1988, A&AS, 74, 385
- Bender et al. (1994) Bender, R., Saglia, R. P., & Gerhard, O. E. 1994, MNRAS, 269, 785 (BSG)
- (7) Bertola, F., & Capaccioli, M. 1975, ApJ, 200, 439
- Bower, et al. (1997) Bower, G. A., Heckman, T. M., Wilson, A. S., & Richstone, D. O. 1997, ApJ, 483, 33
- Bower, et al. (2001) Bower, G. A., et al. 2001, ApJ, 550, 75
- Bowers & Baum (1998) Bowers, C., & Baum, S. 1998, STIS Instrument Science Report 98-23
- Byun et al. (1996) Byun, Y.-I., et al. 1996, AJ, 111, 1889
- Bureau et al. (2002) Bureau, M. et al. 2002, ASP Conf. Ser. 282: Galaxies: the Third Dimension, 208
- Busarello et al. (1996) Busarello, G., Capaccioli, M., D’Onofrio, M., Longo, G., Richter, G., & Zaggia, S. 1996, A&A, 314, 32
- Busarello et al. (1992) Busarello, G., Longo, G., & Feoli, A. 1992, A&A, 262, 52
- Cappellari et al. (2002) Cappellari, M., Verolme, E. K., van der Marel, R. P., Kleijn, G. A. V., Illingworth, G. D., Franx, M., Carollo, C. M., & de Zeeuw, P. T. 2002, ApJ, 578, 787
- Carter et al. (1987) Carter, D. 1987, ApJ, 312, 514
- Carollo et al. (1997) Carollo, C. M., Franx, M., Illingworth, G. D., & Forbes, D. A. 1997, ApJ, 481, 710
- Cinzano & van der Marel (1994) Cinzano, P., & van der Marel, R. P. 1994, MNRAS, 270, 325
- (19) Cretton, N., & van den Bosch, F. C. 1999, ApJ, 514, 704
- Davies (1981) Davies, R. L. 1981, MNRAS, 194, 879
- Davies et al. (1983) Davies, R. L., Efstathiou, G., Fall, S. M., Illingworth, G., & Schechter, P. L. 1983, ApJ, 266, 41
- Davoust et al. (1984) Davoust, E., Lelievre, G., Maury, A., & Nieto, J.-L. 1984, MNRAS, 209, 503
- de Bruyn et al. (2001) de Bruyne, V., Dejonghe, H., Pizzella, A., Bernardi, M., & Zeilinger, W. W. 2001, ApJ, 546, 903
- de Zeeuw et al. (2002) de Zeeuw et al. 2002, MNRAS, 329, 513
- di Matteo & Fabian (1997) di Matteo, T., & Fabian, A. C. 1997, MNRAS, 286, 50
- Dressler & Richstone (1990) Dressler, A., & Richstone, D. 1990, ApJ, 348, 120
- RC (3) de Vaucouleurs, G., de Vaucouleurs, A., Corwin, H. G., Buta, R. J., Paturel, G., & Fouquè, P. 1991, Third Reference Catalogue of Bright Galaxies (Springer, New York) (RC3)
- Emsellem et al. (1999) Emsellem, E., Dejonghe, H., & Bacon, R. 1999, MNRAS, 303, 495
- Faber et al. (1997) Faber, S. M., Tremaine, S, Ajhar, E. A., Byun, Y., Dressler, A., Gebhardt, K., Grillmair, C., Kormendy, J., Lauer, T. R., & Richstone, D. 1997, AJ, 114, 1771
- Ferrarese et al. (1996) Ferrarese, L., Ford, H. C., & Jaffe, W. 1996, ApJ, 470, 444
- Ferrarese & Merritt (2000) Ferrarese, L., & Merritt, D. 2000, ApJ, 539, L9
- Ferrari et al. (1999) Ferrari, F., Pastoriza, M. G., Macchetto, F., & Caon, N. 1999, A&AS, 136, 269
- Fisher et al. (1995) Fisher, D., Illingworth, G. D., & Franx, M. 1995, ApJ, 438, 539
- Fisher (1997) Fisher, D. 1997, AJ, 113, 950
- Forbes (1991) Forbes, D. A. 1991, MNRAS, 249, 779
- Gebhardt et al. (1996) Gebhardt, K., et al. 1996a, AJ, 112, 105
- Gebhardt et al. (2000) Gebhardt, K., Bender, R., Bower, G., Dressler, A., Faber, S. M., Filippenko, A. V., Green, R., Grillmair, C., Ho, L. C., Kormendy, J., Lauer, T. R., Magorrian, J., Pinkney, J., Richstone, D., & Tremaine, S. 2000, ApJ, 539, L13 (G00)
- (38) Gebhardt, K., et al. 2000, ApJ, 543, L5
- Gebhardt et al. (2003) Gebhardt, K., et al. 2003, ApJ, 583, 92
- Gonzalez (1993) Gonzalez, J. J. 1993, Ph.D. thesis, University of California, Santa Cruz
- (41) Goudfrooij, P., Hansen, L., Jørgensen, H. E., Nørgaard-Nielsen, H. U., de Jong, T., & van den Hoek, L. B. 1994a, A&AS, 104, 179
- (42) Goudfrooij, P., Hansen, L., Jørgensen, H. E., & Nørgaard-Nielsen, H. U., 1994b, A&AS, 105, 341
- Halliday et al. (2001) Halliday, C., Davies, R. L., Kuntschner, H. Birkinshaw, M., Bender, R., Saglia, R. P., & Baggley, G. 2001, MNRAS, 326, 473
- Harms et al. (1994) Harms, R. J., et al. 1994, ApJ, 435, L35
- Ho et al. (1997) Ho, L. C., Filippenko, A. V., & Sargent, W. L. W. 1997, ApJS, 112, 315
- Hodge et al. (1998) Hodge, P. E. et al. 1998, ASP Conf. Ser. 145: Astronomical Data Analysis Software and Systems VII, 7, 316
- Illingworth (1977) Illingworth, G. 1977, ApJ, 218, L43
- Isobe et al. (1986) Isobe, T., Feigelson, E. D., & Nelson, P. I. 1986, ApJ, 306, 490
- Jedrzejewski & Schechter (1989) Jedrzejewski, R. I., & Schechter, P. L. 1988, ApJ, 330, L87
- Jedrzejewski & Schechter (1989) Jedrzejewski, R. I., & Schechter, P. L. 1989, AJ, 98, 147
- Jungwiert et al. (1997) Jungwiert, B., Combes, F., & Axon, D. J. 1997, A&AS, 125, 479
- Joseph et al. (2001) Joseph, C. L., et al. 2001, ApJ, 550, 668 D.,
- Kaprolin & Zeilinger (2000) Kaprolin, W., & Zeilinger, W. W., 2000, A&AS, 145, 71
- Kim (1989) Kim, D.-W. 1989, ApJ, 346, 653
- Kormendy & Richstone (1995) Kormendy, J., & Richstone, D. 1995, ARA&A, 33, 581
- Kormendy (1985) Kormendy, J. 1985, ApJ, 292, L9
- Kormendy (1993) Kormendy, J. 1993, in IAU Symposium 153, Galactic Bulges, ed. H. Habing & H. Dejonghe (Dordrecht: Kluwer), 209
- Kormendy & Gebhardt (2001) Kormendy, J., & Gebhardt, K. 2001, in The 20th Texas Symposium on Relativistic Astrophysics, ed. J. C. Wheeler & H. Martel (AIP), 363
- Kormendy et al. (2003) Kormendy, J., et al. 2002, ApJ, (submitted)
- Kronawitter et al. (2000) Kronawitter, A., Saglia, R. P., Gerhard, O. E., & Bender, R. 2000, A&AS, 144, 53
- Lauer (1985) Lauer, T. R. 1985, MNRAS, 216, 429
- Lauer et al. (1991) Lauer, T. R., et al. 1991, ApJ, 369, L41
- Lauer et al. (1995) Lauer, T. R., et al. 1995, AJ, 110, 2622
- Lauer et al. (2002) Lauer, T. R., et al. 2002, ApJ, 574, 740
- Leitherer et al. (2001) Leitherer, C., et al. 2001, “STIS Instrument Handbook”, Version 5.1, (Baltimore: STScI).
- Magorrian et al. (1998) Magorrian J., et al. 1998 AJ, 115, 2285
- Macchetto et al. (1996) Macchetto, F., Pastoriza, M., Caon, N., Sparks, W. B., Giavalisco, M., Bender, R., & Capaccioli, M. 1996, A&AS, 120, 463
- Makino (1997) Makino, J. 1997, ApJ, 478, 58
- Mamon (1989) Mamon, G. A. 1989, A&A, 219, 98
- McElroy (1995) McElroy, D. B. 1995, ApJS, 100, 105
- Merritt (1997) Merritt, D. 1997, AJ, 114, 228
- Merritt & Ferrarese (2001) Merritt, D., & Ferrarese, 2001 MNRAS, 320, 30L
- Michard & Marchal (1994) Michard, R., & Marchal, J. 1994, A&AS, 105, 481
- Milosavljević & Merritt (2001) Milosavljević, M. & Merritt, D. 2001, ApJ, 563, 34
- Morton & Chevalier (1973) Morton D. C., & Chevalier R.A., 1973 ApJ, 179, 55
- Nieto et al. (1988) Nieto, J.-L., Capaccioli, M., & Held, E. V. 1988, A&A, 195, 1
- Nieto et al. (1991) Nieto, J.-L., Bender, R., Arnaud, J., & Surma, P. 1991b, A&A, 244, L25
- Nieto et al. (1994) Nieto, J.-L., Poulain, P., & Davoust, E. 1994, A&A, 283, 1
- Peletier (1989) Peletier, R. F. 1989, Ph.D. Thesis, University of Groningen, The Netherlands.
- Peletier (1990) Peletier, R. F., Davies, R. L., Illingworth, G. D., & Davis, L. E. 1990, AJ, 100, 1091
- Pellegrini (1999) Pellegrini, S., 1999, A&A, 351, 487
- Pence (1998) Pence, W. 1998, ASP Conf. Ser. 145: Astronomical Data Analysis Software and Systems VII, 7, 97
- Pinkney et al. (2003) Pinkney J., et al. 2003, in preparation.
- Prugniel et al. (1998) Prugniel, Ph., Zasov, A., Busarello, G., & Simien, F. 1998, 127, 117
- Press et al. (1992) Press, W. H., Teukolsky, S. A., Vetterling, W. T., & Flannery, B. P. 1992, Numerical Recipes in FORTRAN. The art of scientific computing, Cambridge: University Press, Ic1992, 2nd. ed.
- Ravindranath et al. (2001) Ravindranath, S., Ho, L. C., Peng, C. Y., Filippenko, A. V., & Sargent, W. L. W. 2001, AJ, 122, 653.
- Richstone et al. (1998) Richstone, D., Ajhar, E. A., Bender, R., Bower, G., Dressler, A., Faber, S. M., Filippenko, A. V., Gebhardt, K., Green, R., Ho, L. C., Kormendy, J., Lauer, T. R., Magorrian, J., & Tremaine, S. 1998, Nature, 395, A14.
- Rix et al. (1997) Rix, H.-W., de Zeeuw, P. T., Cretton, N., van der Marel, R. P., & Carollo, C. M. 1997, ApJ, 488, 702
- Roberts et al. (1991) Roberts, M. S., Hogg, D. E., Bregman, J. N., Forman, W. R., & Jones, C. 1991, ApJS, 75, 751
- Rood & Williams (1985) Rood, H. J., & Williams, B. A. 1985, ApJ, 288, 535
- Saglia et al. (2000) Saglia, R. P., Kronawitter, A., Gerhard, O., & Bender, R. 2000, AJ, 119, 153
- Saha & Williams (1994) Saha, P., & Williams, T. B. 1994, AJ, 107, 1295
- Sahu et al. (1996) Sahu, D. K., Pandey, S. K., & Kembhavi, A. K. 1996, BASI, 24, 777
- (94) Sandage, A., & Tammann, G. A. 1980, A revised Shapley-Ames Catalog of bright galaxies, Washington: Carnegie Institution, 1980
- Schneider (1985) Schneider, S. 1985, ApJ, 288, 33
- Sil’chenko (1997) Sil’Chenko, O. K. 1997, AZh74, 643
- Singh et al. (1994) Singh, K. P., Prabhu, T. P., Kembhavi, A. K., & Bhat, P. N. 1994, ApJ, 424, 638
- (98) Sofue, Y., & Wakamatsu, K-I 1993, PASJ, 45, 529
- Tomita et al. (2000) Tomita, A., Aoki, K., Watanabe, M., Takata, T., & Ichikawa, S-I. 2000, AJ, 120, 123
- Tonry et al. (2001) Tonry, J. L., Dressler, A., Blakeslee, J. P., Ajhar, E. A., Fletcher, A. B., Luppino, G. A., Metzger, M. R., & Moore, C. B. 2001, ApJ, 546, 681
- Trager et al. (2000) Trager, S. C., Faber, S. M., Worthey, G., & González, J. J. 2000, AJ, 119, 1645
- Tremaine (1995) Tremaine, S. 1995, AJ, 110, 628
- Tremaine et al. (2002) Tremaine, S. et al. 2002, ApJ, 574, 740
- Trinchieri & di Serego Alighieri (1991) Trinchieri, G.; di Serego Alighieri, S. 1991, AJ, 101, 1647
- van den Bosch et al. (1994) van den Bosch, F. C., Ferrarese, L., Jaffe, W., Ford, H. C., & O’Connell, R. W. 1994, AJ, 108, 1579
- (106) van der Marel, R. P. 1994a MNRAS, 270, 271
- (107) van der Marel, R. P. 1994b ApJ, 432, L91
- van der Marel & Franx (1993) van der Marel, R. P., & Franx, M. 1993, ApJ, 407, 525
- van der Marel & van den Bosch (1998) van der Marel, R. P., & van den Bosch, F. C. 1998, AJ, 116, 2220
- Veron-Cetty & Veron (1988) Veron-Cetty, & Veron, P. 1988, A&AS, 204, 28
- Wrobel & Heeschen (1991) Wrobel, J. M., & Heeschen, D. S. 1991, AJ, 101, 148
- Wrobel & Herrnstein (2000) Wrobel, J. M., & Herrnstein, J. R. 2000, ApJ, 533, L111
- Young et al. (1978) Young, P., Sargent, W. L. W., Boksenberg, A., Lynds, C. R., & Hartwick, F.D.A 1978, ApJ 222, 450
| Name | TypeaaGalaxy type from NED. | bbBlue absolute magnitude, , calculated using surface brightness fluctuation (SBF) distances. | ProfileccSurface brightness profile type characterized as either (power-law) or (core). Sources are Faber et al. (1997), Byun et al. (1996, for NGC 4473), and Lauer (2002, private communication, for NGC 821, 2778, 4291). | Dist.ddDistances are from SBF measurements in Tonry et al. (2000). | ScaleeeSpatial scale derived from col. 5. | ffCentral “” is the band surface brightness measured at 01 . | PA ggPosition angle from the RC3. | hhEffective radius derived from the RC3, in arcseconds. |
|---|---|---|---|---|---|---|---|---|
| NGC | mag | Type | Mpc | pc/ | mag/ | deg | ′′ | |
| 821 | E6? | -20.41 | 24.1 | 117 | 14.3 | 25 | 50 | |
| 2778 | E | -18.59 | 22.9 | 111 | 14.9 | 40 | 16 | |
| 3384iiNGC 3384 also identified as NGC 3371. | SBs0- | -18.99 | 11.6 | 56 | 13.7 | 53 | 25 | |
| 3608 | E2 | -19.86 | 23.0 | 111 | 14.7 | 75 | 34 | |
| 4291 | E | -19.63 | 26.2 | 127 | 14.9 | 110 | 17 | |
| 4473 | E5 | -19.89 | 15.7 | 76 | 14.7 | 100 | 26 | |
| 4564 | E | -18.92 | 15.0 | 73 | 14.1 | 47 | 20 | |
| 4649 | E2 | -21.29 | 15.9 | 88 | 15.9 | 105 | 69 | |
| 4697 | E6 | -20.24 | 11.7 | 57 | 14.4 | 70 | 72 | |
| 7457 | SArs0-? | -17.69 | 13.2 | 64 | 16.2 | 130 | 32 |
| Code | Instrument | Slit size | aaCentral wavelength and wavelength range. STIS values taken from Leitherer et al. (2001, pp. 231, 234). | -range aaCentral wavelength and wavelength range. STIS values taken from Leitherer et al. (2001, pp. 231, 234). | Dispersion-1 bbReciprocal dispersion was measured using our own wavelength solutions. The distribution of dispersion solutions for a given dataset had a Åpix-1. The average dispersion given in the Handbook for G750M is 1.12 Åpix-1. | Comp. line ccInstrumental line widths measured by fitting Gaussians to emission lines on comparison lamp exposures. This gives an estimate of the instrumental line width for extended sources. We use 5 lines per exposure, and at least 5 measurements per line. In the cases of the G750M setups, the comparison lamp exposures were unbinned, while the galaxy spectra were binned by 2X along the dispersion axis. The 2X binning increases the measured widths by, e.g., 25% for the 01 slit, and by 3% for the 02 slit at 8561 Å. Leitherer et al. (2001, p. 300) give these instrumental line widths for point sources: =13.3, 15.0, 16.7 km s-1 for the first three G750M setups in this table. | Spatial scale ddThe spatial scale along the slit is constant, but it varies across the slit from one grating to the next. It is 0.05597 ″ pix-1 for G750M at 8561 Å and 0.05465 ″pix-1 for G750M at 6581 Å (STIS ISR 98-23). |
|---|---|---|---|---|---|---|---|
| + grating | Å | Å | Å pix-1 | Å ( km s-1) | ″ pix-1 | ||
| 1 | STIS + G750M | 520.1 | 8561 | 8275-8847 | 1.1089 | 0.45 (17.5) | 0.05071 |
| 2 | STIS + G750M | 520.2 | 8561 | 8275-8847 | 1.1089 | 0.68 (23.8) | 0.05071 |
| 3 | STIS + G750M | 520.1 | 6581 | 6295-6867 | 1.1130 | 0.37 (16.9) | 0.05071 |
| 4 | Charlotte+831g/mm | 7600.8 | 8500 | 7801-9199 | 1.44 | 0.98 (35.) | 0.593 |
| 5 | Wilbur+831g/mm | 7600.9 | 8500 | 7580-9420 | 0.909 | 1.10 (39.) | 0.371 |
| 6 | Charlotte+1200g/mm | 7600.9 | 5175 | 4689-5661 | 1.11 | 0.75 (37) | 0.593 |
Note. — Most of the STIS setups used a CCD readout with 2X overbinning along the dispersion, and a readnoise of 1 pix-1. The Modspec setup values are given by the program “modset” by J. Thorstensen. The slit widths, spectral and spatial resolutions varied for the Modspec observations; characteristic values are shown here .
| Name | Exposure | Obs. Date aaThe date at the end of the visit. | PA bbPosition angle of the STIS slit. From the FITS headers. | PA ccDifference between the STIS position angle and the RC3 PA. | Setup ddCode for the spectrograph setup used (see Table 2). |
|---|---|---|---|---|---|
| NGC | seconds | DDMMYY | degrees | degrees | Code |
| 821 | 27478 | 131098,080999 | 5 | 1 | |
| 2778 | 15026 | 030699 | 50 | 10 | 1 |
| 3384 | 27744 | 100598,160499 | 58 | 5 | 1 |
| 3608 | 12950 | 140598 | 94 | 19 | 2 |
| 4291 | 16013 | 210498 | 110 | 0 | 2 |
| 4473 | 12840 | 041297 | 2 | ||
| 4564 | 15060 | 080398 | 1 | ||
| 4649 | 46467 | 090699 | 95 | 2 | |
| 4697 | 24820 | 270799,200899 | 68 | 1,3 | |
| 7457 | 15282 | 240999 | 130 | 0 | 1 |
| HR7576eeTemplate stars were HR7576 (=5.03 mag, K3 III) and HR6770 (=4.64 mag, G8 III). | 5x3.2s,5x3.2s | 140599 | 1,2 | ||
| HR6770 | 5x2.2s,5x3.2s | 060999 | 54 | 1,2 |
| Name | Obs. Date aaThe month and year of observation. | PA bbThe position angle of the slit relative to the major axis of the galaxy. | Exposure ccNumber of exposures exposure length. | Setup ddCode from Table 2 for the spectrograph setup used. |
|---|---|---|---|---|
| NGC | MM/YY | ° | (sec) | Code |
| 821 | 11/95 | 0 | 61600 | 6 |
| 821 | 11/95 | 85 | 51600 | 6 |
| 2778 | 11/97 | 0 | 231200 | 5 |
| 2778 | 11/97 | 70 | 201200 | 5 |
| 3384 | 03/97 | 0 | 81200 | 4 |
| 3384 | 01/97 | 10 | 61200 | 6 |
| 3384 | 03/97 | 70 | 71200 | 4 |
| 3384 | 01/97 | 88 | 61200 | 6 |
| 3608 | 03/97 | 0 | 71200 | 4 |
| 3608 | 03/97 | 75 | 91200 | 4 |
| 4291 | 03/97 | 0 | 81200 | 4 |
| 4291 | 03/97 | 29 | 21200 | 4 |
| 4291 | 04/97 | 70 | 41200 | 4 |
| 4473 | 03/97 | 0 | 121200 | 4 |
| 4473 | 03/97 | 22 | 61200 | 4 |
| 4473 | 01/97 | 0 | 41200 | 6 |
| 4473 | 01/97 | 90 | 71200 | 6 |
| 4564 | 03/98 | 0 | 121200 | 5 |
| 4564 | 03/98 | 30 | 81200 | 5 |
| 4564 | 03/98 | 70 | 121200 | 5 |
| 4649 | 01/97 | 0 | 91200 | 6 |
| 4649 | 03/97 | 22 | 81200 | 4 |
| 4649 | 01/97 | 28 | 61200 | 6 |
| 4649 | 01/97 | 68 | 91200 | 6 |
| 4697 | 04/97 | 0 | 91200 | 4 |
| 4697 | 04/97 | 48 | 91200 | 4 |
| 4697 | 04/97 | 70 | 181200 | 4 |
| 7457 | 11/97 | 0 | 201200 | 5 |
| 7457 | 11/97 | 70 | 61200,61500 | 4 |
| NGC No. | Filter aaFilter used: H=F160W(nic), I=F814W, R=F702W, V=F555W. | Ib bbSurface brightness at the break radius. | rb ccBreak radius: the radius of the transition between inner and outer power-laws. | ddInner power-law slope. | Source eeSource for fit parameters. Rav=Ravindranath et al. 2001; Fab=Faber et al. 1997; Rest=Rest et al. 2001; Nuk=Lauer 2002, private communication. | ||
|---|---|---|---|---|---|---|---|
| 821 | H | 13.2 | 1.1 | 1.0 | 1.6 | 0.64 | Rav |
| 2778 | I | 14.5 | 0.3 | 0.3 | 1.8 | 0.30 | Nuk |
| 2778 | V | 15.1 | 0.1 | 0.4 | 1.6 | 0.16 | Nuk |
| 3384 | I | 15.1 | 2.9 | 11.2 | 1.8 | 0.65 | Nuk |
| 3384 | V | 16.3 | 2.9 | 12.0 | 1.8 | 0.64 | Nuk |
| 3608 | V | 15.5 | 0.3 | 1.1 | 1.3 | 0.00 | Fab |
| 4291 | H | 12.3 | 0.5 | 2.1 | 1.5 | 0.02 | Rav |
| 4291 | R | 15.1 | 0.6 | 1.4 | 1.6 | 0.00 | Rest |
| 4473 | I | 16.2 | 5.3 | 0.7 | 2.7 | 0.01 | Nuk |
| 4473 | V | 17.7 | 6.3 | 0.7 | 2.9 | 0.01 | Nuk |
| 4564 | R | 15.9 | 1.3 | 1.4 | 1.3 | 0.80 | Rest |
| 4649 | V | 17.2 | 3.6 | 2.0 | 1.3 | 0.15 | Fab |
| 4697 | V | 13.5 | 2.6 | 24.9 | 1.0 | 0.74 | Fab |
| 7457 | H | 13.5 | 0.3 | 2.3 | 1.0 | 0.35 | Rav |
Note. — These are fits to the surface brightness profile along the major axis.
| Name | rcen(′′) | Range(pix) | Width(pix) |
|---|---|---|---|
| STIS CCD | |||
| cen | 0.000 | 511 - 511 | 1 |
| r1 | 0.051 | 512 - 512 | 1 |
| r2 | 0.101 | 513 - 513 | 1 |
| r3 | 0.177 | 514 - 515 | 2 |
| r4 | 0.304 | 516 - 518 | 3 |
| r5 | 0.507 | 519 - 523 | 5 |
| r6 | 0.811 | 524 - 530 | 7 |
| l1 | -0.051 | 510 - 510 | 1 |
| l2 | -0.101 | 509 - 509 | 1 |
| l3 | -0.177 | 507 - 508 | 2 |
| l4 | -0.304 | 504 - 506 | 3 |
| l5 | -0.507 | 499 - 503 | 5 |
| l6 | -0.811 | 492 - 498 | 7 |
| Wilbur | |||
| cen | 0.0 | 300 - 300 | 1 |
| r1 | 0.37 | 301 - 301 | 1 |
| r2 | 0.73 | 302 - 302 | 1 |
| r3 | 1.28 | 303 - 304 | 2 |
| r4 | 2.01 | 305 - 306 | 2 |
| r5 | 3.10 | 307 - 310 | 4 |
| r6 | 4.93 | 311 - 316 | 6 |
| r7 | 7.85 | 317 - 325 | 9 |
| r8 | 12.23 | 326 - 339 | 14 |
| Charlotte | |||
| cen | 0.0 | 300 - 300 | 1 |
| r1 | 0.59 | 301 - 301 | 1 |
| r2 | 1.48 | 302 - 303 | 2 |
| r3 | 2.95 | 304 - 306 | 3 |
| r4 | 4.72 | 307 - 309 | 3 |
| r5 | 7.38 | 310 - 315 | 6 |
| r6 | 11.80 | 316 - 324 | 9 |
| r7 | 18.29 | 326 - 336 | 11 |
| r8 | 28.32 | 337 - 359 | 23 |
| r9 | 44.25 | 360 - 390 | 31 |
| r10 | 69.03 | 391 - 443 | 52 |
| Name | aaDispersion measured in the central STIS bin with error from LOSVD fitting. | bbMaximum rotational velocity from symmetrized STIS data. Points with large scatter were ignored in the case of NGC 821 and NGC 2778. | ccRatio of maximum rotation (over all data) and central STIS dispersion. | ddVelocity “gradient” is measured as the maximum of v17/0.17 or v30/0.3, where v17 is the symmetrized rotation velocity at 0.17″, and v30 is the rotation at 0.30″. The entire rotation curve is used to define the galaxy’s systemic velocity, not the central bin. | eeThe value of h4 in the central STIS bin (=00). | ffThe weighted mean of the 3 central h4 values (=00, =005, not symmetrized). |
|---|---|---|---|---|---|---|
| NGC | km s-1 | km s-1 | km s-1arcsec-1 | |||
| 821 | 248 (16) | 103 (23) | 0.42 (0.10) | 510 | 0.04 (0.05) | 0.05 (0.03) |
| 2778 | 200 (29) | 61 (18) | 0.43 (0.09) | 129 | 0.15 (0.17) | 0.08 (0.08) |
| 3384 | 128 ( 8) | 85 (10) | 0.83 (0.08) | 414 | 0.04 (0.07) | 0.06 (0.03) |
| 3608 | 296 (27) | 28 (20) | 0.09 (0.07) | 113 | 0.13 (0.08) | 0.08 (0.04) |
| 4291 | 306 (35) | 74 (18) | 0.26 (0.04) | 410 | 0.00 (0.07) | 0.04 (0.05) |
| 4473 | 162 (25) | 67 (13) | 0.46 (0.08) | 278 | 0.06 (0.04) | 0.06 (0.03) |
| 4564 | 220 (20) | 90 (34) | 0.67 (0.06) | 218 | 0.00 (0.03) | 0.01 (0.03) |
| 4649 | 547 (101) | 145 (70) | 0.27 (0.14) | 403 | 0.07 (0.08) | 0.07 (0.04) |
| 4697 | 171 (10) | 110 (21) | 0.64 (0.13) | 374 | 0.14 (0.06) | 0.10 (0.03) |
| 7457 | 105 ( 8) | 8 ( 7) | 0.38 (0.07) | 11 | 0.01 (0.05) | 0.03 (0.03) |
| Name | aaDispersion measured in central Modspec bin with error from LOSVD fitting. | bbDispersion averaged along the Modspec slit, major axis, for 20, using symmetrized LOSVDs and an 10 slit width. The error is the standard deviation of averaged values. Only three numbers are averaged for NGC 2778 (the 6 measurements outside of 20 are symmetrized). The other galaxies include 48 numbers in the average. | cc Effective dispersion: the rms velocity relative to the systemic velocity of the galaxy, averaged over a slit width of 1″ extending to . | ddMaximum rotational velocity from symmetrized Modspec data. Implausible maxima were discarded in the case of NGC 821, 4649, 4697 . | eeRatio of maximum rotation to . The comes from the ground-based data. | ( )* ffThe ratio of / to the expected for an oblate, isotropic rotator calculated as ), where is the isophote ellipticity. | ggEllipticity from Bender (1988), Faber et al. (1997) (NGC 7457), Lauer et al. (1995) (NGC 3608), and Peletier et al. (1990) (NGC 2778). We measured for NGC 4291 and 3384 using WFPC2 F555W images. | hhFourth Gauss-Hermite coefficient from the =00 bin of the major axis spectrum. | iiThird Gauss-Hermite coefficient averaged over using the symmetrized, major axis LOSVD. The error is the standard deviation of the mean. |
|---|---|---|---|---|---|---|---|---|---|
| NGC | km s-1 | km s-1 | km s-1 | km s-1 | |||||
| 821 | 235 ( 3) | 192 (21) | 209 | 74 ( 6) | 0.39 (0.05) | 0.54 | 0.34 | -0.07 (0.02) | -0.03 (0.04) |
| 2778 | 202 (10) | 179 (52) | 175 | 85 (14) | 0.47 (0.16) | 0.85 | 0.24 | -0.06 (0.04) | -0.04 (0.07) |
| 3384 | 134 ( 2) | 119 (7) | 143 | 107 ( 8) | 0.90 (0.09) | 0.99 | 0.45 | -0.05 (0.01) | -0.04 (0.10) |
| 3608 | 181 ( 5) | 150 (12) | 182 | 24 ( 5) | 0.16 (0.04) | 0.31 | 0.21 | -0.08 (0.02) | -0.01 (0.03) |
| 4291 | 262 (12) | 183 (18) | 242 | 79 (10) | 0.43 (0.07) | 0.71 | 0.27 | -0.04 (0.03) | -0.05 (0.02) |
| 4473 | 183 ( 7) | 197 (10) | 190 | 75 ( 4) | 0.38 (0.03) | 0.47 | 0.40 | -0.00 (0.02) | -0.11 (0.02) |
| 4564 | 171 ( 6) | 112 (17) | 162 | 147 ( 4) | 1.31 (0.20) | 1.18 | 0.55 | -0.01 (0.02) | -0.02 (0.04) |
| 4649 | 373 ( 9) | 318 (37) | 375 | 93 (27) | 0.29 (0.09) | 0.65 | 0.16 | 0.00 (0.02) | -0.04 (0.02) |
| 4697 | 157 ( 5) | 145 (5) | 177 | 101 (13) | 0.70 (0.09) | 0.84 | 0.41 | -0.04 (0.03) | -0.15 (0.03) |
| 7457 | 73 ( 3) | 63 (3) | 67 | 40 ( 7) | 0.63 (0.12) | 0.69 | 0.46 | 0.01 (0.03) | -0.02 (0.04) |
| Name | PArelaaPosition angle of slit relative to the major axis. | Sym?bbIf “Yes”, the spectra from the two sides of the galaxy center have been symmetrized. | r()ccRadius, in arcseconds. | ( km s-1)ddLine-of-sight velocity, in km s-1, from fit to Equation 1 (see text). | ( km s-1)eeVelocity dispersion, km s-1, from fit to Equation 1 (see text). | h3 ffThird Gauss-Hermite coefficient. | h4 ggFourth Gauss-Hermite coefficient. | ||||
|---|---|---|---|---|---|---|---|---|---|---|---|
| N821(Mg) | 0 | Yes | 0.0 | 7. | 4. | 235. | 3. | 0.02 | 0.02 | 0.07 | 0.02 |
| N821(Mg) | 0 | Yes | 0.6 | 25. | 7. | 231. | 6. | 0.02 | 0.03 | 0.01 | 0.03 |
| N821(Mg) | 0 | Yes | 1.2 | 51. | 6. | 215. | 6. | 0.07 | 0.02 | 0.02 | 0.03 |
| N821(Mg) | 0 | Yes | 1.8 | 58. | 5. | 203. | 7. | 0.07 | 0.03 | 0.05 | 0.03 |
| N821(Mg) | 0 | Yes | 2.7 | 59. | 5. | 204. | 5. | 0.04 | 0.03 | 0.04 | 0.03 |
| N821(Mg) | 0 | Yes | 4.4 | 62. | 5. | 198. | 6. | 0.04 | 0.03 | 0.04 | 0.03 |
| N821(Mg) | 0 | Yes | 7.1 | 71. | 5. | 187. | 7. | 0.04 | 0.03 | 0.05 | 0.03 |
| N821(Mg) | 0 | Yes | 11.2 | 64. | 6. | 195. | 7. | 0.01 | 0.03 | 0.03 | 0.03 |
| N821(Mg) | 0 | Yes | 18.0 | 75. | 6. | 179. | 9. | 0.02 | 0.04 | 0.08 | 0.04 |
| N821(Mg) | 0 | Yes | 28.3 | 73. | 9. | 157. | 11. | 0.10 | 0.04 | 0.00 | 0.04 |
| N821(Mg) | 0 | Yes | 44.0 | 99. | 18. | 223. | 20. | 0.02 | 0.08 | 0.02 | 0.08 |
| N821(Mg) | 85 | Yes | 0.0 | 2. | 3. | 235. | 4. | 0.05 | 0.02 | 0.11 | 0.02 |
| N821(Mg) | 85 | Yes | 0.6 | 2. | 9. | 230. | 7. | 0.01 | 0.03 | 0.01 | 0.03 |
| N821(Mg) | 85 | Yes | 1.2 | 3. | 7. | 224. | 6. | 0.02 | 0.02 | 0.03 | 0.03 |
| N821(Mg) | 85 | Yes | 1.8 | 5. | 6. | 217. | 7. | 0.00 | 0.03 | 0.07 | 0.03 |
| N821(Mg) | 85 | Yes | 2.7 | 6. | 6. | 214. | 6. | 0.02 | 0.02 | 0.02 | 0.03 |
| N821(Mg) | 85 | Yes | 4.4 | 14. | 8. | 207. | 10. | 0.07 | 0.03 | 0.09 | 0.04 |
| N821(Mg) | 85 | Yes | 7.1 | 21. | 12. | 204. | 17. | 0.04 | 0.06 | 0.08 | 0.04 |
| N821(Mg) | 85 | Yes | 11.2 | 8. | 13. | 197. | 29. | 0.03 | 0.06 | 0.05 | 0.09 |
| N821(Mg) | 85 | Yes | 18.0 | 15. | 28. | 322. | 99. | 0.05 | 0.09 | 0.68 | 0.35 |
| N821(Mg) | 85 | Yes | 28.3 | 4. | 22. | 219. | 97. | 0.01 | 0.17 | 0.31 | 0.10 |
| N821(Mg) | 0 | No | 0.00 | -7. | 4. | 235. | 3. | 0.02 | 0.02 | -0.07 | 0.02 |
| N821(Mg) | 0 | No | 0.59 | 26. | 10. | 227. | 9. | 0.05 | 0.04 | -0.03 | 0.05 |
| N821(Mg) | 0 | No | 1.18 | 41. | 8. | 221. | 8. | -0.05 | 0.04 | -0.04 | 0.03 |
| N821(Mg) | 0 | No | 1.77 | 52. | 12. | 204. | 10. | -0.03 | 0.04 | 0.03 | 0.05 |
| N821(Mg) | 0 | No | 2.65 | 53. | 8. | 215. | 10. | 0.02 | 0.04 | 0.01 | 0.04 |
| N821(Mg) | 0 | No | 4.43 | 49. | 8. | 199. | 8. | -0.01 | 0.03 | 0.02 | 0.03 |
| N821(Mg) | 0 | No | 7.08 | 70. | 9. | 192. | 9. | 0.02 | 0.04 | 0.04 | 0.04 |
| N821(Mg) | 0 | No | 11.21 | 59. | 11. | 199. | 13. | 0.08 | 0.05 | 0.01 | 0.04 |
| N821(Mg) | 0 | No | 18.00 | 65. | 15. | 191. | 14. | 0.05 | 0.05 | 0.01 | 0.05 |
| N821(Mg) | 0 | No | 28.32 | 70. | 24. | 169. | 75. | 0.01 | 0.30 | 0.19 | 0.20 |
| N821(Mg) | 0 | No | 43.96 | 108. | 31. | 215. | 40. | 0.07 | 0.10 | 0.08 | 0.18 |
| N821(Mg) | 0 | No | -0.59 | -24. | 11. | 230. | 9. | 0.12 | 0.03 | -0.07 | 0.05 |
| N821(Mg) | 0 | No | -1.18 | -56. | 9. | 211. | 12. | 0.16 | 0.04 | -0.01 | 0.05 |
| N821(Mg) | 0 | No | -1.77 | -67. | 9. | 208. | 10. | 0.12 | 0.04 | 0.02 | 0.04 |
| N821(Mg) | 0 | No | -2.65 | -70. | 6. | 204. | 8. | 0.08 | 0.03 | 0.03 | 0.05 |
| N821(Mg) | 0 | No | -4.43 | -77. | 7. | 189. | 8. | 0.14 | 0.03 | -0.05 | 0.04 |
| N821(Mg) | 0 | No | -7.08 | -72. | 10. | 192. | 16. | 0.15 | 0.05 | 0.02 | 0.05 |
| N821(Mg) | 0 | No | -11.21 | -72. | 8. | 197. | 10. | 0.10 | 0.04 | -0.01 | 0.05 |
| N821(Mg) | 0 | No | -18.00 | -78. | 11. | 198. | 32. | 0.09 | 0.07 | 0.16 | 0.09 |
| N821(Mg) | 0 | No | -28.32 | -80. | 13. | 165. | 13. | 0.09 | 0.06 | -0.07 | 0.06 |
| N821(Mg) | 0 | No | -43.96 | -107. | 83. | 253. | 162. | 0.09 | 0.29 | 0.00 | 0.33 |
| N2778 | 0 | Yes | 0.0 | 4. | 6. | 202. | 10. | 0.05 | 0.03 | 0.06 | 0.04 |
| N2778 | 0 | Yes | 0.4 | 2. | 5. | 196. | 7. | 0.13 | 0.02 | 0.02 | 0.02 |
| N2778 | 0 | Yes | 0.7 | 42. | 4. | 168. | 6. | 0.08 | 0.03 | 0.00 | 0.03 |
| N2778 | 0 | Yes | 1.3 | 69. | 4. | 170. | 7. | 0.08 | 0.03 | 0.05 | 0.03 |
| N2778 | 0 | Yes | 2.0 | 63. | 8. | 168. | 10. | 0.01 | 0.05 | 0.02 | 0.04 |
| N2778 | 0 | Yes | 3.1 | 86. | 14. | 235. | 32. | 0.01 | 0.10 | 0.44 | 0.16 |
| N2778 | 0 | Yes | 4.9 | 74. | 12. | 133. | 17. | 0.12 | 0.08 | 0.03 | 0.07 |
| N2778 | 70 | Yes | 0.0 | 8. | 7. | 229. | 10. | 0.07 | 0.03 | 0.06 | 0.04 |
| N2778 | 70 | Yes | 0.4 | 2. | 7. | 215. | 13. | 0.02 | 0.05 | 0.01 | 0.04 |
| N2778 | 70 | Yes | 0.7 | 6. | 5. | 176. | 8. | 0.04 | 0.05 | 0.07 | 0.02 |
| N2778 | 70 | Yes | 1.3 | 16. | 6. | 160. | 7. | 0.09 | 0.03 | 0.07 | 0.04 |
| N2778 | 70 | Yes | 2.0 | 25. | 8. | 145. | 9. | 0.01 | 0.06 | 0.04 | 0.03 |
| N2778 | 0 | No | 0.37 | -5. | 7. | 202. | 9. | 0.10 | 0.03 | -0.01 | 0.03 |
| N2778 | 0 | No | 0.73 | -44. | 7. | 171. | 6. | 0.14 | 0.03 | -0.02 | 0.03 |
| N2778 | 0 | No | 1.28 | -54. | 7. | 159. | 8. | 0.05 | 0.05 | -0.07 | 0.02 |
| N2778 | 0 | No | 2.01 | -65. | 10. | 170. | 9. | 0.08 | 0.05 | -0.06 | 0.04 |
| N2778 | 0 | No | 3.10 | -87. | 21. | 220. | 35. | 0.04 | 0.09 | 0.23 | 0.11 |
| N2778 | 0 | No | 4.93 | -82. | 19. | 234. | 44. | -0.08 | 0.09 | 0.42 | 0.14 |
| N2778 | 0 | No | -0.37 | 7. | 7. | 196. | 11. | -0.14 | 0.03 | 0.03 | 0.03 |
| N2778 | 0 | No | -0.73 | 37. | 9. | 155. | 9. | -0.05 | 0.04 | -0.02 | 0.03 |
| N2778 | 0 | No | -1.28 | 79. | 11. | 155. | 9. | -0.13 | 0.05 | 0.06 | 0.04 |
| N2778 | 0 | No | -2.01 | 60. | 13. | 159. | 11. | -0.01 | 0.06 | -0.04 | 0.04 |
| N2778 | 0 | No | -3.10 | 53. | 18. | 226. | 24. | -0.24 | 0.08 | 0.36 | 0.09 |
| N2778 | 0 | No | -4.93 | 75. | 16. | 153. | 16. | -0.09 | 0.06 | 0.00 | 0.05 |
| N2778 | 0 | No | 0.00 | 0. | 5. | 171. | 6. | -0.05 | 0.02 | -0.01 | 0.02 |
| N3384(Mg) | 0 | No | 0.0 | 4. | 3. | 153. | 4. | 0.00 | 0.03 | 0.04 | 0.02 |
| N3384(Mg) | 0 | No | 0.6 | 28. | 4. | 154. | 4. | 0.06 | 0.03 | 0.04 | 0.02 |
| N3384(Mg) | 0 | No | 1.2 | 53. | 4. | 148. | 3. | 0.09 | 0.02 | 0.02 | 0.02 |
| N3384(Mg) | 0 | No | 1.8 | 73. | 4. | 144. | 4. | 0.12 | 0.03 | 0.00 | 0.03 |
| N3384(Mg) | 0 | No | 3.0 | 85. | 4. | 146. | 4. | 0.11 | 0.04 | 0.01 | 0.03 |
| N3384(Mg) | 0 | No | 4.8 | 84. | 3. | 139. | 3. | 0.11 | 0.02 | 0.04 | 0.01 |
| N3384(Mg) | 0 | No | 7.5 | 55. | 4. | 137. | 4. | 0.03 | 0.03 | 0.04 | 0.02 |
| N3384(Mg) | 0 | No | 11.7 | 58. | 4. | 127. | 4. | 0.00 | 0.03 | 0.01 | 0.02 |
| N3384(Mg) | 0 | No | 18.0 | 104. | 4. | 127. | 4. | 0.01 | 0.02 | 0.04 | 0.01 |
| N3384(Mg) | 0 | No | 28.2 | 136. | 5. | 121. | 6. | 0.02 | 0.03 | 0.01 | 0.02 |
| N3384(Mg) | 0 | No | 0.6 | 24. | 3. | 155. | 4. | 0.05 | 0.02 | 0.05 | 0.02 |
| N3384(Mg) | 0 | No | 1.2 | 46. | 3. | 155. | 5. | 0.04 | 0.03 | 0.03 | 0.02 |
| N3384(Mg) | 0 | No | 1.8 | 65. | 4. | 150. | 6. | 0.05 | 0.03 | 0.03 | 0.03 |
| N3384(Mg) | 0 | No | 3.0 | 83. | 3. | 144. | 4. | 0.07 | 0.02 | 0.02 | 0.02 |
| N3384(Mg) | 0 | No | 4.8 | 88. | 3. | 135. | 4. | 0.11 | 0.03 | 0.04 | 0.01 |
| N3384(Mg) | 0 | No | 7.5 | 76. | 3. | 132. | 4. | 0.06 | 0.03 | 0.04 | 0.01 |
| N3384(Mg) | 0 | No | 11.7 | 74. | 3. | 127. | 5. | 0.03 | 0.02 | 0.04 | 0.01 |
| N3384(Mg) | 0 | No | 18.0 | 110. | 3. | 124. | 4. | 0.03 | 0.02 | 0.05 | 0.01 |
| N3384(Mg) | 0 | No | 28.2 | 137. | 7. | 107. | 7. | 0.01 | 0.02 | 0.05 | 0.01 |
| N3384 | 0 | No | 0.0 | 3. | 1. | 134. | 2. | 0.00 | 0.02 | 0.05 | 0.01 |
| N3384 | 0 | No | 0.6 | 26. | 2. | 141. | 2. | 0.03 | 0.02 | 0.05 | 0.02 |
| N3384 | 0 | No | 1.2 | 48. | 2. | 134. | 2. | 0.08 | 0.02 | 0.02 | 0.02 |
| N3384 | 0 | No | 1.8 | 69. | 3. | 131. | 3. | 0.10 | 0.02 | 0.07 | 0.01 |
| N3384 | 0 | No | 3.0 | 89. | 3. | 128. | 3. | 0.17 | 0.03 | 0.03 | 0.02 |
| N3384 | 0 | No | 4.8 | 83. | 3. | 130. | 4. | 0.11 | 0.03 | 0.05 | 0.01 |
| N3384 | 0 | No | 7.5 | 67. | 3. | 119. | 4. | 0.07 | 0.03 | 0.05 | 0.01 |
| N3384 | 0 | No | 11.7 | 72. | 5. | 109. | 6. | 0.04 | 0.03 | 0.06 | 0.02 |
| N3384 | 0 | No | 18.0 | 93. | 12. | 125. | 13. | 0.10 | 0.07 | 0.01 | 0.04 |
| N3384 | 0 | No | 0.6 | 20. | 2. | 137. | 3. | 0.04 | 0.02 | 0.02 | 0.02 |
| N3384 | 0 | No | 1.2 | 51. | 4. | 135. | 4. | 0.13 | 0.02 | 0.00 | 0.02 |
| N3384 | 0 | No | 1.8 | 68. | 4. | 126. | 3. | 0.16 | 0.02 | 0.01 | 0.02 |
| N3384 | 0 | No | 3.0 | 82. | 2. | 128. | 5. | 0.11 | 0.03 | 0.06 | 0.02 |
| N3384 | 0 | No | 4.8 | 89. | 4. | 130. | 3. | 0.11 | 0.03 | 0.02 | 0.02 |
| N3384 | 0 | No | 7.5 | 88. | 3. | 120. | 4. | 0.06 | 0.03 | 0.07 | 0.01 |
| N3384 | 0 | No | 11.7 | 88. | 6. | 112. | 6. | 0.05 | 0.03 | 0.03 | 0.02 |
| N3384 | 0 | No | 18.0 | 119. | 11. | 105. | 9. | 0.00 | 0.03 | 0.06 | 0.03 |
| N3384(Mg) | 0 | Yes | 0.0 | 2. | 4. | 137. | 4. | 0.01 | 0.03 | 0.02 | 0.02 |
| N3384(Mg) | 0 | Yes | 0.6 | 28. | 2. | 137. | 3. | 0.05 | 0.02 | 0.03 | 0.02 |
| N3384(Mg) | 0 | Yes | 1.2 | 51. | 2. | 134. | 3. | 0.06 | 0.02 | 0.01 | 0.02 |
| N3384(Mg) | 0 | Yes | 1.8 | 71. | 2. | 130. | 3. | 0.08 | 0.02 | 0.02 | 0.02 |
| N3384(Mg) | 0 | Yes | 3.0 | 88. | 2. | 127. | 3. | 0.11 | 0.02 | 0.00 | 0.02 |
| N3384(Mg) | 0 | Yes | 4.8 | 95. | 2. | 126. | 3. | 0.11 | 0.02 | 0.03 | 0.02 |
| N3384(Mg) | 0 | Yes | 7.5 | 75. | 2. | 119. | 5. | 0.05 | 0.03 | 0.05 | 0.01 |
| N3384(Mg) | 0 | Yes | 11.7 | 77. | 2. | 112. | 4. | 0.02 | 0.03 | 0.05 | 0.02 |
| N3384(Mg) | 0 | Yes | 18.0 | 106. | 3. | 104. | 7. | 0.03 | 0.02 | 0.07 | 0.02 |
| N3384(Mg) | 0 | Yes | 28.2 | 137. | 3. | 100. | 3. | 0.04 | 0.01 | 0.05 | 0.01 |
| N3384 | 75 | Yes | 0.0 | 3. | 4. | 135. | 4. | 0.08 | 0.02 | 0.04 | 0.02 |
| N3384 | 75 | Yes | 0.6 | 13. | 4. | 140. | 4. | 0.05 | 0.02 | 0.05 | 0.03 |
| N3384 | 75 | Yes | 1.2 | 19. | 5. | 147. | 4. | 0.07 | 0.03 | 0.08 | 0.04 |
| N3384 | 75 | Yes | 1.8 | 24. | 6. | 146. | 6. | 0.01 | 0.03 | 0.05 | 0.04 |
| N3384 | 75 | Yes | 3.0 | 27. | 5. | 145. | 5. | 0.10 | 0.03 | 0.04 | 0.03 |
| N3384 | 75 | Yes | 4.8 | 26. | 5. | 144. | 4. | 0.04 | 0.03 | 0.06 | 0.03 |
| N3384 | 75 | Yes | 7.5 | 26. | 4. | 124. | 4. | 0.03 | 0.03 | 0.00 | 0.03 |
| N3384 | 75 | Yes | 11.7 | 26. | 8. | 111. | 6. | 0.00 | 0.04 | 0.02 | 0.02 |
| N3384(Mg) | 90 | Yes | 0.0 | 18. | 3. | 143. | 3. | 0.05 | 0.03 | 0.04 | 0.02 |
| N3384(Mg) | 90 | Yes | 0.6 | 1. | 2. | 144. | 2. | 0.01 | 0.02 | 0.04 | 0.02 |
| N3384(Mg) | 90 | Yes | 1.2 | 2. | 2. | 143. | 2. | 0.02 | 0.02 | 0.04 | 0.02 |
| N3384(Mg) | 90 | Yes | 1.8 | 2. | 2. | 148. | 3. | 0.01 | 0.02 | 0.01 | 0.01 |
| N3384(Mg) | 90 | Yes | 3.0 | 7. | 3. | 146. | 3. | 0.03 | 0.02 | 0.04 | 0.01 |
| N3384(Mg) | 90 | Yes | 4.8 | 11. | 3. | 129. | 4. | 0.10 | 0.03 | 0.07 | 0.02 |
| N3384(Mg) | 90 | Yes | 7.5 | 6. | 3. | 117. | 4. | 0.04 | 0.03 | 0.07 | 0.02 |
| N3384(Mg) | 90 | Yes | 11.7 | 4. | 3. | 110. | 2. | 0.02 | 0.03 | 0.05 | 0.01 |
| N3384(Mg) | 90 | Yes | 18.0 | 12. | 4. | 95. | 3. | 0.03 | 0.02 | 0.04 | 0.01 |
| N3608 | 0 | No | 0.0 | 3. | 5. | 181. | 5. | 0.00 | 0.02 | 0.08 | 0.02 |
| N3608 | 0 | No | 0.6 | 20. | 7. | 182. | 9. | 0.07 | 0.03 | 0.03 | 0.03 |
| N3608 | 0 | No | 1.2 | 16. | 8. | 176. | 10. | 0.08 | 0.04 | 0.01 | 0.02 |
| N3608 | 0 | No | 1.8 | 9. | 7. | 183. | 9. | 0.09 | 0.04 | 0.01 | 0.03 |
| N3608 | 0 | No | 3.0 | 25. | 5. | 166. | 9. | 0.09 | 0.03 | 0.01 | 0.02 |
| N3608 | 0 | No | 4.8 | 18. | 7. | 160. | 8. | 0.01 | 0.03 | 0.06 | 0.02 |
| N3608 | 0 | No | 7.5 | 24. | 8. | 158. | 12. | 0.07 | 0.04 | 0.03 | 0.02 |
| N3608 | 0 | No | 11.7 | 11. | 15. | 133. | 14. | 0.01 | 0.04 | 0.04 | 0.03 |
| N3608 | 0 | No | 18.0 | 31. | 26. | 140. | 25. | 0.03 | 0.08 | 0.04 | 0.05 |
| N3608 | 0 | No | 0.6 | 6. | 6. | 204. | 5. | 0.02 | 0.02 | 0.05 | 0.03 |
| N3608 | 0 | No | 1.2 | 15. | 7. | 196. | 12. | 0.03 | 0.06 | 0.06 | 0.04 |
| N3608 | 0 | No | 1.8 | 17. | 8. | 188. | 10. | 0.01 | 0.05 | 0.00 | 0.04 |
| N3608 | 0 | No | 3.0 | 24. | 6. | 165. | 7. | 0.02 | 0.03 | 0.04 | 0.02 |
| N3608 | 0 | No | 4.8 | 20. | 9. | 158. | 9. | 0.02 | 0.04 | 0.03 | 0.03 |
| N3608 | 0 | No | 7.5 | 9. | 9. | 159. | 10. | 0.02 | 0.04 | 0.06 | 0.03 |
| N3608 | 0 | No | 11.7 | 2. | 16. | 159. | 17. | 0.05 | 0.06 | 0.05 | 0.03 |
| N3608 | 0 | No | 18.0 | 32. | 20. | 146. | 23. | 0.07 | 0.08 | 0.00 | 0.05 |
| N3608 | 0 | Yes | 0.0 | 3. | 5. | 181. | 5. | 0.00 | 0.02 | 0.08 | 0.02 |
| N3608 | 0 | Yes | 0.6 | 14. | 7. | 190. | 6. | 0.03 | 0.02 | 0.07 | 0.02 |
| N3608 | 0 | Yes | 1.2 | 18. | 6. | 178. | 7. | 0.01 | 0.02 | 0.03 | 0.03 |
| N3608 | 0 | Yes | 1.8 | 17. | 5. | 175. | 8. | 0.01 | 0.02 | 0.06 | 0.03 |
| N3608 | 0 | Yes | 3.0 | 24. | 5. | 160. | 5. | 0.05 | 0.03 | 0.05 | 0.02 |
| N3608 | 0 | Yes | 4.8 | 19. | 6. | 158. | 6. | 0.02 | 0.03 | 0.03 | 0.02 |
| N3608 | 0 | Yes | 7.5 | 15. | 7. | 156. | 6. | 0.01 | 0.04 | 0.05 | 0.02 |
| N3608 | 0 | Yes | 11.7 | 5. | 10. | 140. | 9. | 0.00 | 0.04 | 0.05 | 0.03 |
| N3608 | 0 | Yes | 18.0 | 30. | 17. | 134. | 15. | 0.01 | 0.05 | 0.04 | 0.04 |
| N3608 | 75 | Yes | 0.0 | 16. | 7. | 193. | 6. | 0.02 | 0.02 | 0.07 | 0.02 |
| N3608 | 75 | Yes | 0.6 | 0. | 5. | 192. | 4. | 0.02 | 0.02 | 0.06 | 0.02 |
| N3608 | 75 | Yes | 1.2 | 2. | 7. | 190. | 9. | 0.01 | 0.03 | 0.02 | 0.03 |
| N3608 | 75 | Yes | 1.8 | 2. | 6. | 185. | 9. | 0.04 | 0.03 | 0.02 | 0.03 |
| N3608 | 75 | Yes | 3.0 | 11. | 7. | 161. | 6. | 0.04 | 0.03 | 0.05 | 0.02 |
| N3608 | 75 | Yes | 4.8 | 4. | 7. | 149. | 8. | 0.03 | 0.03 | 0.01 | 0.03 |
| N3608 | 75 | Yes | 7.5 | 9. | 7. | 110. | 6. | 0.03 | 0.03 | 0.07 | 0.02 |
| N3608 | 75 | Yes | 11.7 | 9. | 13. | 126. | 11. | 0.01 | 0.06 | 0.04 | 0.03 |
| N4291 | 0 | No | 0.0 | 25. | 10. | 262. | 12. | 0.01 | 0.04 | 0.04 | 0.03 |
| N4291 | 0 | No | 0.6 | 25. | 12. | 267. | 11. | 0.04 | 0.03 | 0.10 | 0.03 |
| N4291 | 0 | No | 1.2 | 44. | 11. | 240. | 11. | 0.05 | 0.03 | 0.04 | 0.03 |
| N4291 | 0 | No | 1.8 | 65. | 12. | 240. | 13. | 0.07 | 0.04 | 0.08 | 0.04 |
| N4291 | 0 | No | 3.0 | 76. | 9. | 214. | 9. | 0.04 | 0.03 | 0.06 | 0.02 |
| N4291 | 0 | No | 4.8 | 66. | 17. | 208. | 15. | 0.02 | 0.06 | 0.08 | 0.03 |
| N4291 | 0 | No | 7.5 | 64. | 24. | 194. | 27. | 0.04 | 0.08 | 0.05 | 0.05 |
| N4291 | 0 | No | 11.7 | 16. | 40. | 182. | 42. | 0.01 | 0.10 | 0.05 | 0.08 |
| N4291 | 0 | No | 0.6 | 45. | 9. | 249. | 11. | 0.05 | 0.03 | 0.08 | 0.02 |
| N4291 | 0 | No | 1.2 | 76. | 8. | 216. | 8. | 0.06 | 0.03 | 0.07 | 0.02 |
| N4291 | 0 | No | 1.8 | 64. | 9. | 208. | 10. | 0.02 | 0.03 | 0.07 | 0.02 |
| N4291 | 0 | No | 3.0 | 66. | 9. | 204. | 11. | 0.02 | 0.03 | 0.05 | 0.02 |
| N4291 | 0 | No | 4.8 | 90. | 13. | 176. | 20. | 0.05 | 0.05 | 0.04 | 0.03 |
| N4291 | 0 | No | 7.5 | 50. | 19. | 169. | 20. | 0.04 | 0.06 | 0.04 | 0.03 |
| N4291 | 0 | No | 11.7 | 19. | 51. | 169. | 59. | 0.04 | 0.14 | 0.05 | 0.16 |
| N4291 | 0 | Yes | 0.0 | 25. | 10. | 262. | 12. | 0.01 | 0.04 | 0.04 | 0.03 |
| N4291 | 0 | Yes | 0.6 | 40. | 7. | 261. | 6. | 0.03 | 0.03 | 0.09 | 0.02 |
| N4291 | 0 | Yes | 1.2 | 64. | 6. | 227. | 6. | 0.06 | 0.02 | 0.08 | 0.02 |
| N4291 | 0 | Yes | 1.8 | 65. | 8. | 224. | 7. | 0.05 | 0.03 | 0.10 | 0.02 |
| N4291 | 0 | Yes | 3.0 | 71. | 7. | 205. | 7. | 0.04 | 0.02 | 0.06 | 0.02 |
| N4291 | 0 | Yes | 4.8 | 79. | 10. | 190. | 11. | 0.07 | 0.04 | 0.05 | 0.03 |
| N4291 | 0 | Yes | 7.5 | 57. | 13. | 173. | 12. | 0.06 | 0.05 | 0.05 | 0.03 |
| N4291 | 0 | Yes | 11.7 | 19. | 31. | 165. | 42. | 0.03 | 0.07 | 0.06 | 0.11 |
| N4291 | 29 | Yes | 0.0 | 23. | 10. | 243. | 12. | 0.11 | 0.03 | 0.04 | 0.04 |
| N4291 | 29 | Yes | 0.6 | 15. | 8. | 236. | 10. | 0.07 | 0.03 | 0.02 | 0.03 |
| N4291 | 29 | Yes | 1.2 | 40. | 7. | 210. | 9. | 0.03 | 0.03 | 0.07 | 0.03 |
| N4291 | 29 | Yes | 1.8 | 64. | 10. | 233. | 9. | 0.02 | 0.03 | 0.08 | 0.03 |
| N4291 | 29 | Yes | 3.0 | 37. | 13. | 223. | 12. | 0.07 | 0.05 | 0.00 | 0.05 |
| N4291 | 70 | Yes | 0.0 | 15. | 8. | 249. | 10. | 0.10 | 0.03 | 0.05 | 0.03 |
| N4291 | 70 | Yes | 0.6 | 4. | 5. | 244. | 6. | 0.06 | 0.02 | 0.10 | 0.02 |
| N4291 | 70 | Yes | 1.2 | 5. | 4. | 231. | 7. | 0.05 | 0.02 | 0.05 | 0.02 |
| N4291 | 70 | Yes | 1.8 | 9. | 6. | 224. | 7. | 0.01 | 0.03 | 0.06 | 0.02 |
| N4291 | 70 | Yes | 3.0 | 18. | 7. | 194. | 9. | 0.03 | 0.04 | 0.00 | 0.03 |
| N4291 | 70 | Yes | 4.8 | 20. | 9. | 190. | 11. | 0.03 | 0.04 | 0.03 | 0.03 |
| N4291 | 70 | Yes | 7.5 | 11. | 9. | 169. | 13. | 0.02 | 0.03 | 0.05 | 0.03 |
| N4473 | 0 | No | 0.0 | 46. | 7. | 189. | 9. | 0.02 | 0.05 | 0.01 | 0.04 |
| N4473 | 0 | No | 0.6 | 10. | 5. | 180. | 5. | 0.03 | 0.03 | 0.05 | 0.02 |
| N4473 | 0 | No | 1.2 | 35. | 12. | 190. | 14. | 0.06 | 0.06 | 0.01 | 0.05 |
| N4473 | 0 | No | 1.8 | 39. | 4. | 186. | 4. | 0.08 | 0.02 | 0.03 | 0.02 |
| N4473 | 0 | No | 2.7 | 37. | 2. | 180. | 2. | 0.11 | 0.01 | 0.05 | 0.00 |
| N4473 | 0 | No | 3.9 | 41. | 2. | 184. | 2. | 0.08 | 0.01 | 0.07 | 0.01 |
| N4473 | 0 | No | 5.4 | 43. | 2. | 177. | 5. | 0.12 | 0.01 | 0.04 | 0.01 |
| N4473 | 0 | No | 7.8 | 31. | 4. | 186. | 5. | 0.10 | 0.02 | 0.04 | 0.02 |
| N4473 | 0 | No | 11.4 | 18. | 6. | 204. | 6. | 0.08 | 0.02 | 0.05 | 0.02 |
| N4473 | 0 | No | 16.2 | 6. | 14. | 211. | 16. | 0.13 | 0.05 | 0.02 | 0.05 |
| N4473 | 0 | No | 22.8 | 4. | 25. | 227. | 26. | 0.19 | 0.08 | 0.05 | 0.07 |
| N4473 | 0 | No | 32.1 | 47. | 37. | 200. | 37. | 0.19 | 0.08 | 0.03 | 0.09 |
| N4473 | 0 | No | 0.6 | 80. | 7. | 188. | 9. | 0.08 | 0.04 | 0.01 | 0.03 |
| N4473 | 0 | No | 1.2 | 89. | 7. | 187. | 6. | 0.09 | 0.03 | 0.02 | 0.04 |
| N4473 | 0 | No | 1.8 | 97. | 6. | 185. | 6. | 0.12 | 0.03 | 0.03 | 0.03 |
| N4473 | 0 | No | 2.4 | 103. | 7. | 185. | 5. | 0.13 | 0.03 | 0.02 | 0.03 |
| N4473 | 0 | No | 3.3 | 101. | 5. | 198. | 6. | 0.08 | 0.02 | 0.04 | 0.02 |
| N4473 | 0 | No | 4.5 | 102. | 5. | 199. | 4. | 0.14 | 0.02 | 0.05 | 0.02 |
| N4473 | 0 | No | 6.0 | 102. | 5. | 201. | 5. | 0.12 | 0.03 | 0.09 | 0.02 |
| N4473 | 0 | No | 8.4 | 92. | 5. | 191. | 2. | 0.15 | 0.01 | 0.09 | 0.01 |
| N4473 | 0 | No | 12.0 | 105. | 8. | 193. | 10. | 0.06 | 0.04 | 0.05 | 0.03 |
| N4473 | 0 | No | 16.8 | 113. | 19. | 194. | 21. | 0.06 | 0.06 | 0.11 | 0.07 |
| N4473 | 0 | No | 23.4 | 143. | 21. | 210. | 19. | 0.08 | 0.06 | 0.06 | 0.06 |
| N4473 | 0 | No | 32.7 | 122. | 40. | 270. | 37. | 0.04 | 0.10 | 0.14 | 0.14 |
| N4473 | 0 | Yes | 0.0 | 0. | 0. | 183. | 7. | 0.00 | 0.00 | 0.00 | 0.02 |
| N4473 | 0 | Yes | 0.6 | 35. | 4. | 184. | 5. | 0.03 | 0.02 | 0.01 | 0.02 |
| N4473 | 0 | Yes | 1.2 | 58. | 4. | 181. | 5. | 0.06 | 0.03 | 0.01 | 0.02 |
| N4473 | 0 | Yes | 1.8 | 64. | 3. | 180. | 4. | 0.10 | 0.02 | 0.04 | 0.02 |
| N4473 | 0 | Yes | 2.7 | 70. | 3. | 186. | 4. | 0.11 | 0.02 | 0.02 | 0.02 |
| N4473 | 0 | Yes | 3.9 | 74. | 3. | 190. | 4. | 0.12 | 0.02 | 0.04 | 0.02 |
| N4473 | 0 | Yes | 5.4 | 75. | 4. | 188. | 5. | 0.13 | 0.02 | 0.04 | 0.02 |
| N4473 | 0 | Yes | 7.8 | 67. | 4. | 193. | 4. | 0.12 | 0.02 | 0.05 | 0.02 |
| N4473 | 0 | Yes | 11.4 | 66. | 7. | 196. | 7. | 0.09 | 0.03 | 0.06 | 0.03 |
| N4473 | 0 | Yes | 16.2 | 67. | 14. | 203. | 18. | 0.10 | 0.06 | 0.08 | 0.05 |
| N4473 | 0 | Yes | 22.8 | 78. | 19. | 206. | 23. | 0.12 | 0.09 | 0.07 | 0.08 |
| N4473 | 0 | Yes | 32.1 | 24. | 46. | 217. | 51. | 0.09 | 0.11 | 0.07 | 0.16 |
| N4473(Mg) | 0 | Yes | 0.6 | 23. | 5. | 198. | 3. | 0.10 | 0.02 | 0.05 | 0.02 |
| N4473(Mg) | 0 | Yes | 1.2 | 46. | 6. | 187. | 6. | 0.13 | 0.04 | 0.04 | 0.02 |
| N4473(Mg) | 0 | Yes | 1.8 | 55. | 5. | 193. | 5. | 0.17 | 0.03 | 0.04 | 0.02 |
| N4473(Mg) | 0 | Yes | 2.7 | 60. | 6. | 216. | 10. | 0.14 | 0.04 | 0.03 | 0.03 |
| N4473(Mg) | 0 | Yes | 3.8 | 60. | 5. | 209. | 8. | 0.11 | 0.03 | 0.05 | 0.02 |
| N4473(Mg) | 0 | Yes | 5.6 | 52. | 6. | 229. | 8. | 0.08 | 0.03 | 0.05 | 0.03 |
| N4473(Mg) | 0 | Yes | 8.0 | 63. | 6. | 209. | 7. | 0.12 | 0.02 | 0.04 | 0.02 |
| N4473(Mg) | 0 | Yes | 11.2 | 41. | 7. | 220. | 11. | 0.11 | 0.03 | 0.04 | 0.03 |
| N4473(Mg) | 0 | Yes | 16.2 | 35. | 9. | 213. | 16. | 0.05 | 0.04 | 0.02 | 0.04 |
| N4473(Mg) | 0 | Yes | 23.0 | 13. | 15. | 226. | 14. | 0.08 | 0.04 | 0.06 | 0.04 |
| N4473(Mg) | 0 | Yes | 32.2 | 20. | 18. | 226. | 17. | 0.05 | 0.05 | 0.05 | 0.06 |
| N4473(Mg) | 0 | Yes | 45.4 | 15. | 23. | 198. | 20. | 0.14 | 0.06 | 0.03 | 0.06 |
| N4473(Mg) | 0 | Yes | 64.3 | 2. | 41. | 194. | 31. | 0.00 | 0.09 | 0.11 | 0.08 |
| N4473 | 22 | Yes | 0.0 | 0. | 0. | 166. | 4. | 0.00 | 0.00 | 0.09 | 0.01 |
| N4473 | 22 | Yes | 0.6 | 30. | 3. | 173. | 4. | 0.02 | 0.02 | 0.01 | 0.02 |
| N4473 | 22 | Yes | 1.2 | 49. | 4. | 176. | 6. | 0.07 | 0.02 | 0.02 | 0.03 |
| N4473 | 22 | Yes | 1.8 | 57. | 4. | 170. | 5. | 0.10 | 0.02 | 0.02 | 0.02 |
| N4473 | 22 | Yes | 2.7 | 58. | 5. | 182. | 6. | 0.07 | 0.03 | 0.04 | 0.03 |
| N4473 | 22 | Yes | 3.9 | 58. | 6. | 182. | 7. | 0.03 | 0.03 | 0.01 | 0.04 |
| N4473 | 22 | Yes | 5.4 | 47. | 7. | 178. | 7. | 0.04 | 0.04 | 0.04 | 0.03 |
| N4473 | 22 | Yes | 7.8 | 58. | 7. | 179. | 8. | 0.06 | 0.04 | 0.04 | 0.03 |
| N4473 | 22 | Yes | 11.4 | 63. | 13. | 174. | 15. | 0.11 | 0.07 | 0.00 | 0.05 |
| N4473 | 22 | Yes | 16.2 | 77. | 26. | 178. | 31. | 0.03 | 0.11 | 0.07 | 0.09 |
| N4473(Mg) | 90 | Yes | 0.3 | 2. | 4. | 195. | 4. | 0.00 | 0.02 | 0.08 | 0.02 |
| N4473(Mg) | 90 | Yes | 0.9 | 2. | 4. | 193. | 4. | 0.01 | 0.02 | 0.06 | 0.02 |
| N4473(Mg) | 90 | Yes | 1.8 | 1. | 5. | 196. | 5. | 0.05 | 0.03 | 0.04 | 0.02 |
| N4473(Mg) | 90 | Yes | 3.0 | 2. | 5. | 202. | 6. | 0.01 | 0.02 | 0.07 | 0.03 |
| N4473(Mg) | 90 | Yes | 4.1 | 4. | 5. | 196. | 5. | 0.02 | 0.03 | 0.01 | 0.03 |
| N4473(Mg) | 90 | Yes | 5.6 | 1. | 5. | 166. | 6. | 0.04 | 0.02 | 0.10 | 0.03 |
| N4473(Mg) | 90 | Yes | 8.0 | 8. | 7. | 175. | 6. | 0.01 | 0.03 | 0.04 | 0.03 |
| N4473(Mg) | 90 | Yes | 11.5 | 1. | 7. | 134. | 11. | 0.03 | 0.04 | 0.04 | 0.05 |
| N4473(Mg) | 90 | Yes | 16.2 | 4. | 12. | 202. | 12. | 0.18 | 0.03 | 0.10 | 0.04 |
| N4473(Mg) | 90 | Yes | 22.7 | 10. | 18. | 195. | 13. | 0.06 | 0.06 | 0.06 | 0.05 |
| N4473(Mg) | 90 | Yes | 32.2 | 5. | 24. | 175. | 20. | 0.02 | 0.07 | 0.07 | 0.04 |
| N4473(Mg) | 90 | Yes | 45.4 | 14. | 25. | 151. | 22. | 0.05 | 0.07 | 0.01 | 0.05 |
| N4473(Mg) | 90 | Yes | 64.0 | 8. | 72. | 174. | 62. | 0.12 | 0.12 | 0.08 | 0.23 |
| N4564 | 0 | Yes | 0.0 | 0. | 5. | 171. | 6. | 0.05 | 0.02 | 0.01 | 0.02 |
| N4564 | 0 | Yes | 0.4 | 13. | 3. | 168. | 5. | 0.02 | 0.03 | 0.01 | 0.03 |
| N4564 | 0 | Yes | 0.7 | 31. | 3. | 158. | 3. | 0.03 | 0.03 | 0.08 | 0.02 |
| N4564 | 0 | Yes | 1.3 | 43. | 3. | 148. | 4. | 0.08 | 0.03 | 0.09 | 0.02 |
| N4564 | 0 | Yes | 2.0 | 69. | 3. | 139. | 4. | 0.02 | 0.03 | 0.05 | 0.02 |
| N4564 | 0 | Yes | 3.1 | 69. | 3. | 111. | 4. | 0.09 | 0.03 | 0.08 | 0.01 |
| N4564 | 0 | Yes | 4.9 | 87. | 4. | 112. | 4. | 0.00 | 0.03 | 0.05 | 0.02 |
| N4564 | 0 | Yes | 7.8 | 118. | 6. | 107. | 9. | 0.03 | 0.04 | 0.04 | 0.03 |
| N4564 | 0 | Yes | 12.2 | 147. | 4. | 94. | 7. | 0.03 | 0.03 | 0.07 | 0.01 |
| N4564 | 0 | No | 0.00 | -0. | 5. | 171. | 6. | -0.05 | 0.02 | -0.01 | 0.02 |
| N4564 | 0 | No | -0.37 | 15. | 6. | 167. | 6. | -0.02 | 0.02 | -0.03 | 0.02 |
| N4564 | 0 | No | -0.73 | 34. | 4. | 153. | 5. | 0.00 | 0.03 | 0.00 | 0.02 |
| N4564 | 0 | No | -1.28 | 52. | 3. | 152. | 5. | -0.06 | 0.03 | -0.04 | 0.02 |
| N4564 | 0 | No | -2.01 | 71. | 4. | 149. | 5. | -0.02 | 0.02 | -0.04 | 0.02 |
| N4564 | 0 | No | -3.10 | 75. | 5. | 129. | 5. | -0.03 | 0.03 | -0.04 | 0.02 |
| N4564 | 0 | No | -4.93 | 98. | 6. | 109. | 6. | 0.01 | 0.03 | -0.04 | 0.02 |
| N4564 | 0 | No | -7.85 | 132. | 8. | 116. | 10. | 0.02 | 0.05 | -0.04 | 0.02 |
| N4564 | 0 | No | -12.23 | 154. | 7. | 88. | 6. | 0.00 | 0.03 | -0.08 | 0.01 |
| N4564 | 0 | No | 0.37 | -10. | 5. | 172. | 6. | -0.02 | 0.03 | -0.04 | 0.02 |
| N4564 | 0 | No | 0.73 | -29. | 5. | 176. | 6. | -0.01 | 0.02 | -0.07 | 0.02 |
| N4564 | 0 | No | 1.28 | -40. | 4. | 170. | 6. | 0.00 | 0.03 | -0.02 | 0.03 |
| N4564 | 0 | No | 2.01 | -65. | 5. | 139. | 5. | 0.00 | 0.03 | -0.05 | 0.02 |
| N4564 | 0 | No | 3.10 | -77. | 6. | 136. | 6. | -0.02 | 0.03 | -0.04 | 0.02 |
| N4564 | 0 | No | 4.93 | -76. | 5. | 126. | 7. | -0.02 | 0.04 | -0.05 | 0.03 |
| N4564 | 0 | No | 7.66 | -106. | 8. | 112. | 10. | -0.04 | 0.04 | -0.02 | 0.03 |
| N4564 | 0 | No | 11.86 | -140. | 7. | 106. | 8. | 0.01 | 0.05 | -0.05 | 0.01 |
| N4564 | 30 | Yes | 0.0 | 21. | 6. | 173. | 7. | 0.04 | 0.03 | 0.03 | 0.02 |
| N4564 | 30 | Yes | 0.4 | 13. | 4. | 185. | 7. | 0.07 | 0.03 | 0.02 | 0.05 |
| N4564 | 30 | Yes | 0.7 | 25. | 4. | 171. | 6. | 0.04 | 0.04 | 0.02 | 0.04 |
| N4564 | 30 | Yes | 1.3 | 39. | 3. | 151. | 5. | 0.00 | 0.03 | 0.09 | 0.02 |
| N4564 | 30 | Yes | 2.0 | 58. | 4. | 146. | 5. | 0.06 | 0.04 | 0.07 | 0.03 |
| N4564 | 30 | Yes | 3.1 | 58. | 5. | 137. | 7. | 0.09 | 0.04 | 0.07 | 0.03 |
| N4564 | 30 | Yes | 4.9 | 59. | 6. | 106. | 6. | 0.07 | 0.04 | 0.05 | 0.03 |
| N4564 | 30 | Yes | 7.8 | 87. | 7. | 94. | 8. | 0.03 | 0.04 | 0.01 | 0.03 |
| N4564 | 30 | Yes | 12.2 | 82. | 6. | 85. | 8. | 0.00 | 0.03 | 0.07 | 0.02 |
| N4564 | 70 | Yes | 0.0 | 8. | 5. | 170. | 6. | 0.04 | 0.02 | 0.01 | 0.03 |
| N4564 | 70 | Yes | 0.4 | 2. | 3. | 178. | 4. | 0.02 | 0.04 | 0.00 | 0.04 |
| N4564 | 70 | Yes | 0.7 | 15. | 3. | 160. | 5. | 0.03 | 0.03 | 0.00 | 0.03 |
| N4564 | 70 | Yes | 1.3 | 13. | 3. | 149. | 4. | 0.03 | 0.03 | 0.06 | 0.02 |
| N4564 | 70 | Yes | 2.0 | 17. | 4. | 140. | 5. | 0.00 | 0.03 | 0.02 | 0.03 |
| N4564 | 70 | Yes | 3.1 | 15. | 4. | 129. | 6. | 0.02 | 0.04 | 0.05 | 0.03 |
| N4564 | 70 | Yes | 4.9 | 6. | 6. | 89. | 8. | 0.01 | 0.04 | 0.05 | 0.04 |
| N4564 | 70 | Yes | 7.8 | 16. | 15. | 134. | 14. | 0.16 | 0.09 | 0.08 | 0.08 |
| N4649(Mg) | 0 | No | 0.0 | 8. | 9. | 373. | 9. | 0.01 | 0.02 | 0.00 | 0.02 |
| N4649(Mg) | 0 | No | 0.6 | 9. | 12. | 384. | 11. | 0.01 | 0.02 | 0.01 | 0.03 |
| N4649(Mg) | 0 | No | 1.5 | 18. | 9. | 357. | 10. | 0.02 | 0.02 | 0.01 | 0.02 |
| N4649(Mg) | 0 | No | 3.0 | 30. | 7. | 374. | 7. | 0.03 | 0.02 | 0.03 | 0.02 |
| N4649(Mg) | 0 | No | 4.7 | 28. | 8. | 357. | 9. | 0.04 | 0.03 | 0.02 | 0.04 |
| N4649(Mg) | 0 | No | 7.4 | 30. | 11. | 330. | 9. | 0.05 | 0.02 | 0.03 | 0.02 |
| N4649(Mg) | 0 | No | 11.8 | 37. | 17. | 294. | 11. | 0.08 | 0.03 | 0.01 | 0.03 |
| N4649(Mg) | 0 | No | 18.3 | 51. | 23. | 269. | 19. | 0.02 | 0.04 | 0.05 | 0.04 |
| N4649(Mg) | 0 | No | 28.3 | 20. | 54. | 432. | 76. | 0.31 | 0.13 | 0.28 | 0.20 |
| N4649(Mg) | 0 | No | 0.6 | 31. | 8. | 373. | 8. | 0.01 | 0.02 | 0.06 | 0.02 |
| N4649(Mg) | 0 | No | 1.5 | 14. | 9. | 362. | 9. | 0.01 | 0.02 | 0.04 | 0.02 |
| N4649(Mg) | 0 | No | 3.0 | 30. | 9. | 335. | 9. | 0.03 | 0.01 | 0.04 | 0.02 |
| N4649(Mg) | 0 | No | 4.7 | 10. | 7. | 328. | 9. | 0.00 | 0.02 | 0.03 | 0.01 |
| N4649(Mg) | 0 | No | 7.4 | 15. | 10. | 310. | 9. | 0.04 | 0.01 | 0.05 | 0.02 |
| N4649(Mg) | 0 | No | 11.8 | 48. | 18. | 299. | 15. | 0.01 | 0.04 | 0.01 | 0.03 |
| N4649(Mg) | 0 | No | 18.3 | 93. | 27. | 298. | 28. | 0.04 | 0.06 | 0.03 | 0.07 |
| N4649(Mg) | 0 | No | 28.3 | 126. | 48. | 292. | 52. | 0.01 | 0.10 | 0.00 | 0.11 |
| N4649(Mg) | 0 | No | 0.0 | 1. | 14. | 414. | 11. | 0.01 | 0.03 | 0.06 | 0.02 |
| N4649(Mg) | 0 | No | 0.6 | 11. | 15. | 410. | 16. | 0.02 | 0.04 | 0.06 | 0.02 |
| N4649(Mg) | 0 | No | 1.5 | 38. | 14. | 373. | 15. | 0.03 | 0.03 | 0.09 | 0.02 |
| N4649(Mg) | 0 | No | 3.0 | 19. | 7. | 356. | 6. | 0.07 | 0.01 | 0.07 | 0.02 |
| N4649(Mg) | 0 | No | 4.7 | 45. | 7. | 348. | 5. | 0.02 | 0.01 | 0.09 | 0.01 |
| N4649(Mg) | 0 | No | 7.4 | 34. | 8. | 297. | 8. | 0.05 | 0.01 | 0.09 | 0.01 |
| N4649(Mg) | 0 | No | 11.8 | 73. | 12. | 330. | 10. | 0.05 | 0.03 | 0.02 | 0.02 |
| N4649(Mg) | 0 | No | 18.3 | 73. | 15. | 321. | 15. | 0.04 | 0.03 | 0.03 | 0.02 |
| N4649(Mg) | 0 | No | 28.3 | 95. | 12. | 312. | 7. | 0.02 | 0.02 | 0.03 | 0.01 |
| N4649(Mg) | 0 | No | 44.2 | 135. | 12. | 264. | 9. | 0.03 | 0.02 | 0.04 | 0.01 |
| N4649(Mg) | 0 | No | 0.6 | 0. | 12. | 412. | 22. | 0.05 | 0.03 | 0.07 | 0.02 |
| N4649(Mg) | 0 | No | 1.5 | 10. | 15. | 371. | 16. | 0.07 | 0.03 | 0.08 | 0.02 |
| N4649(Mg) | 0 | No | 3.0 | 20. | 8. | 311. | 8. | 0.03 | 0.01 | 0.11 | 0.01 |
| N4649(Mg) | 0 | No | 4.7 | 36. | 10. | 374. | 14. | 0.02 | 0.03 | 0.01 | 0.02 |
| N4649(Mg) | 0 | No | 7.4 | 35. | 6. | 335. | 5. | 0.01 | 0.01 | 0.05 | 0.01 |
| N4649(Mg) | 0 | No | 11.8 | 40. | 8. | 309. | 6. | 0.05 | 0.02 | 0.05 | 0.01 |
| N4649(Mg) | 0 | No | 18.3 | 57. | 7. | 293. | 6. | 0.01 | 0.02 | 0.06 | 0.01 |
| N4649(Mg) | 0 | No | 28.3 | 77. | 11. | 325. | 10. | 0.00 | 0.03 | 0.06 | 0.02 |
| N4649(Mg) | 0 | No | 44.2 | 86. | 13. | 276. | 11. | 0.07 | 0.03 | 0.01 | 0.02 |
| N4649(Mg) | 0 | Yes | 0.0 | 1. | 14. | 414. | 11. | 0.01 | 0.03 | 0.06 | 0.02 |
| N4649(Mg) | 0 | Yes | 0.6 | 11. | 6. | 392. | 6. | 0.02 | 0.01 | 0.10 | 0.01 |
| N4649(Mg) | 0 | Yes | 1.5 | 13. | 5. | 382. | 4. | 0.02 | 0.01 | 0.08 | 0.01 |
| N4649(Mg) | 0 | Yes | 3.0 | 28. | 6. | 366. | 5. | 0.04 | 0.01 | 0.06 | 0.01 |
| N4649(Mg) | 0 | Yes | 4.7 | 36. | 6. | 360. | 6. | 0.04 | 0.01 | 0.05 | 0.01 |
| N4649(Mg) | 0 | Yes | 7.4 | 37. | 5. | 336. | 5. | 0.04 | 0.01 | 0.02 | 0.01 |
| N4649(Mg) | 0 | Yes | 11.8 | 49. | 6. | 321. | 6. | 0.04 | 0.02 | 0.01 | 0.01 |
| N4649(Mg) | 0 | Yes | 18.3 | 63. | 8. | 306. | 5. | 0.01 | 0.02 | 0.04 | 0.01 |
| N4649(Mg) | 0 | Yes | 28.3 | 70. | 6. | 312. | 7. | 0.06 | 0.02 | 0.04 | 0.01 |
| N4649(Mg) | 0 | Yes | 44.2 | 108. | 8. | 267. | 8. | 0.04 | 0.03 | 0.01 | 0.02 |
| N4649 | 22 | Yes | 0.0 | 8. | 9. | 373. | 9. | 0.01 | 0.02 | 0.00 | 0.02 |
| N4649 | 22 | Yes | 0.6 | 12. | 8. | 382. | 9. | 0.01 | 0.02 | 0.02 | 0.02 |
| N4649 | 22 | Yes | 1.5 | 9. | 8. | 371. | 10. | 0.02 | 0.02 | 0.01 | 0.02 |
| N4649 | 22 | Yes | 3.0 | 20. | 8. | 360. | 10. | 0.05 | 0.02 | 0.01 | 0.02 |
| N4649 | 22 | Yes | 4.7 | 15. | 7. | 355. | 11. | 0.05 | 0.02 | 0.02 | 0.03 |
| N4649 | 22 | Yes | 7.4 | 20. | 7. | 323. | 10. | 0.04 | 0.02 | 0.03 | 0.02 |
| N4649 | 22 | Yes | 11.8 | 43. | 11. | 291. | 15. | 0.03 | 0.03 | 0.04 | 0.03 |
| N4649 | 22 | Yes | 18.3 | 69. | 17. | 280. | 22. | 0.03 | 0.05 | 0.04 | 0.04 |
| N4649 | 22 | Yes | 28.3 | 103. | 38. | 285. | 69. | 0.02 | 0.09 | 0.04 | 0.10 |
| N4649(Mg) | 28 | Yes | 0.0 | 3. | 27. | 414. | 22. | 0.01 | 0.04 | 0.11 | 0.02 |
| N4649(Mg) | 28 | Yes | 0.6 | 17. | 13. | 357. | 9. | 0.02 | 0.02 | 0.11 | 0.02 |
| N4649(Mg) | 28 | Yes | 1.5 | 33. | 9. | 376. | 6. | 0.03 | 0.02 | 0.08 | 0.01 |
| N4649(Mg) | 28 | Yes | 3.0 | 24. | 9. | 352. | 10. | 0.04 | 0.03 | 0.05 | 0.02 |
| N4649(Mg) | 28 | Yes | 4.7 | 21. | 10. | 343. | 10. | 0.01 | 0.03 | 0.02 | 0.02 |
| N4649(Mg) | 28 | Yes | 7.4 | 34. | 8. | 316. | 9. | 0.04 | 0.02 | 0.07 | 0.01 |
| N4649(Mg) | 28 | Yes | 11.8 | 22. | 11. | 297. | 7. | 0.07 | 0.03 | 0.04 | 0.02 |
| N4649(Mg) | 28 | Yes | 18.3 | 61. | 11. | 272. | 11. | 0.06 | 0.03 | 0.00 | 0.02 |
| N4649(Mg) | 28 | Yes | 28.3 | 80. | 18. | 303. | 15. | 0.02 | 0.05 | 0.03 | 0.03 |
| N4649(Mg) | 28 | Yes | 44.2 | 88. | 16. | 264. | 16. | 0.07 | 0.05 | 0.01 | 0.03 |
| N4649(Mg) | 68 | Yes | 0.0 | 4. | 12. | 403. | 15. | 0.04 | 0.03 | 0.04 | 0.02 |
| N4649(Mg) | 68 | Yes | 0.6 | 10. | 6. | 384. | 6. | 0.01 | 0.01 | 0.08 | 0.01 |
| N4649(Mg) | 68 | Yes | 1.5 | 4. | 8. | 353. | 7. | 0.00 | 0.02 | 0.11 | 0.01 |
| N4649(Mg) | 68 | Yes | 3.0 | 10. | 8. | 341. | 8. | 0.01 | 0.02 | 0.09 | 0.01 |
| N4649(Mg) | 68 | Yes | 4.7 | 1. | 8. | 330. | 6. | 0.04 | 0.02 | 0.03 | 0.01 |
| N4649(Mg) | 68 | Yes | 7.4 | 8. | 5. | 327. | 7. | 0.02 | 0.01 | 0.01 | 0.01 |
| N4649(Mg) | 68 | Yes | 11.8 | 14. | 6. | 316. | 6. | 0.01 | 0.01 | 0.01 | 0.01 |
| N4649(Mg) | 68 | Yes | 18.3 | 43. | 8. | 294. | 6. | 0.02 | 0.03 | 0.02 | 0.01 |
| N4649(Mg) | 68 | Yes | 28.3 | 36. | 10. | 291. | 9. | 0.01 | 0.03 | 0.02 | 0.02 |
| N4649(Mg) | 68 | Yes | 44.2 | 52. | 10. | 239. | 10. | 0.05 | 0.03 | 0.03 | 0.02 |
| N4697 | 0 | Yes | 0.0 | 22. | 5. | 157. | 5. | 0.02 | 0.03 | 0.04 | 0.03 |
| N4697 | 0 | Yes | 0.6 | 28. | 3. | 163. | 4. | 0.03 | 0.02 | 0.01 | 0.02 |
| N4697 | 0 | Yes | 1.2 | 61. | 3. | 149. | 4. | 0.08 | 0.02 | 0.02 | 0.02 |
| N4697 | 0 | Yes | 2.1 | 79. | 3. | 149. | 4. | 0.11 | 0.02 | 0.01 | 0.02 |
| N4697 | 0 | Yes | 3.2 | 99. | 3. | 146. | 4. | 0.16 | 0.02 | 0.06 | 0.02 |
| N4697 | 0 | Yes | 4.7 | 99. | 3. | 144. | 4. | 0.16 | 0.02 | 0.07 | 0.02 |
| N4697 | 0 | Yes | 7.4 | 99. | 3. | 144. | 5. | 0.16 | 0.02 | 0.04 | 0.02 |
| N4697 | 0 | Yes | 11.8 | 90. | 5. | 148. | 6. | 0.12 | 0.03 | 0.01 | 0.03 |
| N4697 | 0 | Yes | 18.3 | 101. | 13. | 150. | 12. | 0.17 | 0.05 | 0.06 | 0.07 |
| N4697 | 0 | Yes | 28.3 | 117. | 23. | 133. | 22. | 0.18 | 0.10 | 0.00 | 0.13 |
| N4697 | 0 | No | 0.59 | 14. | 4. | 166. | 4. | 0.00 | 0.03 | 0.00 | 0.03 |
| N4697 | 0 | No | 1.18 | 51. | 5. | 155. | 6. | -0.02 | 0.03 | 0.01 | 0.03 |
| N4697 | 0 | No | 2.07 | 74. | 4. | 150. | 4. | -0.09 | 0.02 | 0.03 | 0.03 |
| N4697 | 0 | No | 3.24 | 98. | 4. | 146. | 5. | -0.15 | 0.02 | 0.09 | 0.03 |
| N4697 | 0 | No | 4.72 | 96. | 4. | 142. | 4. | -0.16 | 0.02 | 0.07 | 0.02 |
| N4697 | 0 | No | 7.38 | 96. | 4. | 147. | 6. | -0.14 | 0.03 | 0.07 | 0.03 |
| N4697 | 0 | No | 11.80 | 92. | 7. | 143. | 6. | -0.14 | 0.03 | 0.04 | 0.04 |
| N4697 | 0 | No | 18.29 | 112. | 15. | 143. | 14. | -0.19 | 0.05 | -0.01 | 0.09 |
| N4697 | 0 | No | 28.32 | 122. | 21. | 139. | 35. | -0.10 | 0.11 | 0.00 | 0.14 |
| N4697 | 0 | No | -0.59 | -38. | 5. | 158. | 5. | 0.08 | 0.03 | 0.00 | 0.03 |
| N4697 | 0 | No | -1.18 | -72. | 5. | 143. | 5. | 0.11 | 0.03 | 0.03 | 0.03 |
| N4697 | 0 | No | -2.07 | -83. | 4. | 147. | 4. | 0.12 | 0.02 | -0.01 | 0.02 |
| N4697 | 0 | No | -3.24 | -97. | 4. | 149. | 4. | 0.16 | 0.02 | 0.03 | 0.02 |
| N4697 | 0 | No | -4.72 | -102. | 5. | 147. | 5. | 0.17 | 0.02 | 0.06 | 0.02 |
| N4697 | 0 | No | -7.38 | -103. | 6. | 140. | 6. | 0.17 | 0.03 | 0.05 | 0.03 |
| N4697 | 0 | No | -11.80 | -92. | 7. | 151. | 7. | 0.12 | 0.04 | -0.01 | 0.04 |
| N4697 | 0 | No | -18.29 | -91. | 11. | 159. | 10. | 0.13 | 0.06 | -0.07 | 0.07 |
| N4697 | 0 | No | -28.32 | -122. | 29. | 156. | 108. | 0.17 | 0.14 | 0.11 | 0.23 |
| N4697 | 70 | Yes | 0.0 | 14. | 6. | 164. | 10. | 0.00 | 0.03 | 0.05 | 0.04 |
| N4697 | 70 | Yes | 1.2 | 29. | 4. | 169. | 10. | 0.05 | 0.03 | 0.01 | 0.04 |
| N4697 | 70 | Yes | 2.1 | 32. | 2. | 159. | 5. | 0.04 | 0.02 | 0.04 | 0.02 |
| N4697 | 70 | Yes | 3.2 | 27. | 3. | 157. | 5. | 0.00 | 0.02 | 0.03 | 0.02 |
| N4697 | 70 | Yes | 4.7 | 15. | 3. | 162. | 5. | 0.01 | 0.02 | 0.04 | 0.03 |
| N4697 | 70 | Yes | 7.4 | 15. | 3. | 159. | 6. | 0.01 | 0.03 | 0.02 | 0.03 |
| N4697 | 70 | Yes | 11.8 | 12. | 5. | 151. | 9. | 0.04 | 0.04 | 0.06 | 0.05 |
| N4697 | 48 | Yes | 0.0 | 7. | 5. | 159. | 4. | 0.03 | 0.03 | 0.06 | 0.03 |
| N4697 | 48 | Yes | 0.6 | 21. | 3. | 164. | 5. | 0.04 | 0.02 | 0.02 | 0.03 |
| N4697 | 48 | Yes | 1.2 | 37. | 3. | 160. | 4. | 0.04 | 0.02 | 0.03 | 0.02 |
| N4697 | 48 | Yes | 2.1 | 52. | 3. | 160. | 4. | 0.08 | 0.02 | 0.01 | 0.02 |
| N4697 | 48 | Yes | 3.2 | 77. | 3. | 150. | 5. | 0.12 | 0.02 | 0.04 | 0.02 |
| N4697 | 48 | Yes | 4.7 | 73. | 3. | 158. | 5. | 0.09 | 0.02 | 0.05 | 0.02 |
| N4697 | 48 | Yes | 7.4 | 64. | 4. | 151. | 5. | 0.09 | 0.02 | 0.01 | 0.02 |
| N4697 | 48 | Yes | 11.8 | 64. | 4. | 155. | 5. | 0.09 | 0.02 | 0.02 | 0.02 |
| N4697 | 48 | Yes | 18.3 | 78. | 8. | 145. | 9. | 0.15 | 0.04 | 0.05 | 0.04 |
| N4697 | 48 | Yes | 28.3 | 71. | 17. | 132. | 15. | 0.13 | 0.11 | 0.03 | 0.13 |
| N7457 | 0 | Yes | 0.0 | 1. | 3. | 73. | 3. | 0.05 | 0.03 | 0.01 | 0.03 |
| N7457 | 0 | Yes | 0.4 | 3. | 2. | 65. | 3. | 0.03 | 0.02 | 0.04 | 0.02 |
| N7457 | 0 | Yes | 0.7 | 4. | 3. | 62. | 3. | 0.00 | 0.03 | 0.03 | 0.01 |
| N7457 | 0 | Yes | 1.3 | 16. | 3. | 60. | 3. | 0.05 | 0.03 | 0.06 | 0.01 |
| N7457 | 0 | Yes | 2.0 | 19. | 4. | 64. | 5. | 0.01 | 0.04 | 0.02 | 0.03 |
| N7457 | 0 | Yes | 3.1 | 26. | 4. | 58. | 3. | 0.00 | 0.03 | 0.06 | 0.02 |
| N7457 | 0 | Yes | 4.9 | 33. | 6. | 63. | 7. | 0.08 | 0.04 | 0.02 | 0.03 |
| N7457 | 0 | Yes | 7.7 | 40. | 7. | 65. | 7. | 0.01 | 0.05 | 0.04 | 0.02 |
| N7457 | 0 | No | 0.00 | 1. | 3. | 73. | 3. | -0.05 | 0.03 | 0.01 | 0.03 |
| N7457 | 0 | No | -0.37 | 3. | 3. | 67. | 2. | 0.00 | 0.03 | -0.06 | 0.01 |
| N7457 | 0 | No | -0.73 | 4. | 4. | 67. | 4. | 0.00 | 0.04 | -0.03 | 0.02 |
| N7457 | 0 | No | -1.28 | 16. | 3. | 82. | 4. | -0.01 | 0.04 | 0.04 | 0.05 |
| N7457 | 0 | No | -2.01 | 12. | 5. | 70. | 6. | 0.00 | 0.06 | -0.05 | 0.02 |
| N7457 | 0 | No | -3.10 | 24. | 6. | 47. | 7. | -0.01 | 0.04 | -0.07 | 0.01 |
| N7457 | 0 | No | -4.93 | 32. | 8. | 85. | 10. | 0.17 | 0.08 | 0.06 | 0.07 |
| N7457 | 0 | No | -7.85 | 52. | 10. | 59. | 9. | -0.02 | 0.05 | -0.05 | 0.03 |
| N7457 | 0 | No | 0.37 | -3. | 3. | 74. | 3. | -0.03 | 0.04 | -0.03 | 0.02 |
| N7457 | 0 | No | 0.73 | -7. | 4. | 68. | 4. | -0.06 | 0.04 | 0.02 | 0.03 |
| N7457 | 0 | No | 1.28 | -15. | 4. | 61. | 5. | 0.02 | 0.05 | -0.01 | 0.04 |
| N7457 | 0 | No | 2.01 | -21. | 5. | 55. | 8. | 0.00 | 0.05 | -0.06 | 0.02 |
| N7457 | 0 | No | 3.10 | -24. | 6. | 74. | 8. | 0.09 | 0.08 | 0.01 | 0.06 |
| N7457 | 0 | No | 4.93 | -40. | 8. | 60. | 5. | -0.02 | 0.04 | -0.05 | 0.02 |
| N7457 | 0 | No | 7.66 | -28. | 10. | 77. | 10. | -0.06 | 0.06 | -0.05 | 0.04 |
| N7457 | 70 | Yes | 0.0 | 2. | 4. | 65. | 3. | 0.09 | 0.04 | 0.01 | 0.03 |
| N7457 | 70 | Yes | 0.4 | 2. | 2. | 51. | 4. | 0.08 | 0.04 | 0.04 | 0.01 |
| N7457 | 70 | Yes | 0.7 | 0. | 3. | 57. | 5. | 0.02 | 0.05 | 0.05 | 0.02 |
| N7457 | 70 | Yes | 1.3 | 1. | 4. | 68. | 5. | 0.04 | 0.05 | 0.01 | 0.02 |
| N7457 | 70 | Yes | 2.0 | 4. | 6. | 60. | 5. | 0.04 | 0.04 | 0.03 | 0.02 |
| N7457 | 70 | Yes | 3.1 | 3. | 8. | 57. | 6. | 0.01 | 0.05 | 0.02 | 0.02 |
| Name | PAaaPosition angle of STIS slit in degrees. | Sym?bbIf “Y”, the spectra on the two sides of the galaxy center have been symmetrized. | r()ccRadius, in arcseconds. | ( km s-1)ddLine-of-sight velocity, in km s-1, from fit to Equation 1. | ( km s-1)eeVelocity dispersion, km s-1, from fit to Equation 1. | h3 ffThird Gauss-Hermite coefficient. | h4 ggFourth Gauss-Hermite coefficient. | ||||
|---|---|---|---|---|---|---|---|---|---|---|---|
| N821 | 150. | N | 0.00 | 1. | 19. | 248. | 16. | 0.02 | 0.05 | 0.04 | 0.05 |
| N821 | 150. | N | 0.05 | 65. | 19. | 273. | 21. | 0.06 | 0.05 | 0.07 | 0.05 |
| N821 | 150. | N | 0.10 | 101. | 20. | 244. | 20. | 0.05 | 0.05 | 0.02 | 0.07 |
| N821 | 150. | N | 0.17 | 81. | 15. | 186. | 12. | 0.04 | 0.03 | 0.00 | 0.05 |
| N821 | 150. | N | 0.30 | 47. | 24. | 177. | 21. | 0.10 | 0.07 | 0.02 | 0.08 |
| N821 | 150. | N | 0.50 | 47. | 32. | 206. | 19. | 0.05 | 0.07 | 0.08 | 0.08 |
| N821 | 150. | N | 0.82 | 143. | 51. | 233. | 47. | 0.09 | 0.15 | 0.04 | 0.16 |
| N821 | 150. | N | 0.05 | 5. | 20. | 229. | 16. | 0.08 | 0.05 | 0.05 | 0.05 |
| N821 | 150. | N | 0.10 | 62. | 20. | 218. | 18. | 0.11 | 0.06 | 0.08 | 0.05 |
| N821 | 150. | N | 0.17 | 68. | 25. | 235. | 20. | 0.14 | 0.06 | 0.10 | 0.05 |
| N821 | 150. | N | 0.30 | 194. | 30. | 222. | 23. | 0.19 | 0.09 | 0.10 | 0.10 |
| N821 | 150. | N | 0.50 | 116. | 47. | 191. | 33. | 0.04 | 0.06 | 0.06 | 0.06 |
| N821 | 150. | N | 0.82 | 231. | 45. | 238. | 24. | 0.23 | 0.10 | 0.00 | 0.12 |
| N821 | 150 | Y | 0.00 | 1. | 19. | 248. | 16. | 0.02 | 0.05 | 0.04 | 0.05 |
| N821 | 150 | Y | 0.05 | 33. | 12. | 244. | 12. | 0.04 | 0.04 | 0.09 | 0.04 |
| N821 | 150 | Y | 0.10 | 83. | 14. | 217. | 15. | 0.11 | 0.04 | 0.09 | 0.04 |
| N821 | 150 | Y | 0.17 | 87. | 16. | 192. | 13. | 0.14 | 0.03 | 0.01 | 0.04 |
| N821 | 150 | Y | 0.30 | 103. | 23. | 209. | 25. | 0.11 | 0.06 | 0.06 | 0.06 |
| N821 | 150 | Y | 0.50 | 65. | 28. | 197. | 29. | 0.02 | 0.06 | 0.06 | 0.04 |
| N821 | 150 | Y | 0.82 | 189. | 33. | 228. | 24. | 0.16 | 0.09 | 0.04 | 0.08 |
| N2778 | 50 | N | 0.00 | 66. | 39. | 200. | 29. | 0.09 | 0.13 | 0.15 | 0.17 |
| N2778 | 50 | N | 0.05 | 32. | 34. | 149. | 30. | 0.03 | 0.07 | 0.07 | 0.10 |
| N2778 | 50 | N | 0.10 | 67. | 31. | 158. | 34. | 0.05 | 0.12 | 0.11 | 0.11 |
| N2778 | 50 | N | 0.17 | 35. | 45. | 194. | 38. | 0.10 | 0.14 | 0.05 | 0.16 |
| N2778 | 50 | N | 0.43 | 54. | 26. | 99. | 33. | 0.02 | 0.05 | 0.08 | 0.06 |
| N2778 | 50 | N | 0.05 | 152. | 71. | 206. | 64. | 0.03 | 0.19 | 0.03 | 0.16 |
| N2778 | 50 | N | 0.10 | 63. | 37. | 153. | 26. | 0.08 | 0.09 | 0.01 | 0.08 |
| N2778 | 50 | N | 0.17 | 48. | 38. | 128. | 25. | 0.05 | 0.10 | 0.03 | 0.07 |
| N2778 | 50 | N | 0.43 | 60. | 36. | 126. | 27. | 0.13 | 0.12 | 0.00 | 0.13 |
| N2778 | 50 | Y | 0.00 | 66. | 39. | 200. | 29. | 0.09 | 0.13 | 0.15 | 0.17 |
| N2778 | 50 | Y | 0.05 | 45. | 25. | 183. | 38. | 0.14 | 0.10 | 0.00 | 0.12 |
| N2778 | 50 | Y | 0.10 | 61. | 18. | 142. | 17. | 0.00 | 0.07 | 0.11 | 0.05 |
| N2778 | 50 | Y | 0.17 | 15. | 23. | 155. | 24. | 0.08 | 0.09 | 0.10 | 0.09 |
| N2778 | 50 | Y | 0.43 | 55. | 19. | 113. | 19. | 0.07 | 0.08 | 0.07 | 0.06 |
| N3384 | 58 | N | 0.00 | 15. | 9. | 128. | 8. | 0.01 | 0.06 | 0.04 | 0.07 |
| N3384 | 58 | N | 0.05 | 16. | 8. | 133. | 8. | 0.06 | 0.06 | 0.10 | 0.06 |
| N3384 | 58 | N | 0.10 | 48. | 7. | 109. | 9. | 0.14 | 0.08 | 0.09 | 0.06 |
| N3384 | 58 | N | 0.17 | 79. | 6. | 84. | 18. | 0.11 | 0.07 | 0.05 | 0.11 |
| N3384 | 58 | N | 0.30 | 75. | 10. | 98. | 16. | 0.12 | 0.09 | 0.01 | 0.11 |
| N3384 | 58 | N | 0.50 | 87. | 10. | 99. | 14. | 0.13 | 0.09 | 0.01 | 0.08 |
| N3384 | 58 | N | 0.80 | 95. | 13. | 95. | 21. | 0.01 | 0.06 | 0.04 | 0.06 |
| N3384 | 58 | N | 0.05 | 53. | 7. | 122. | 6. | 0.02 | 0.05 | 0.04 | 0.05 |
| N3384 | 58 | N | 0.10 | 66. | 9. | 104. | 10. | 0.04 | 0.06 | 0.03 | 0.05 |
| N3384 | 58 | N | 0.17 | 65. | 9. | 86. | 9. | 0.07 | 0.07 | 0.03 | 0.06 |
| N3384 | 58 | N | 0.30 | 62. | 19. | 121. | 22. | 0.06 | 0.11 | 0.06 | 0.12 |
| N3384 | 58 | N | 0.50 | 54. | 16. | 107. | 15. | 0.08 | 0.08 | 0.00 | 0.07 |
| N3384 | 58 | N | 0.80 | 72. | 22. | 98. | 17. | 0.04 | 0.09 | 0.06 | 0.06 |
| N3384 | 58 | Y | 0.00 | 15. | 9. | 128. | 8. | 0.01 | 0.06 | 0.04 | 0.07 |
| N3384 | 58 | Y | 0.05 | 35. | 5. | 127. | 4. | 0.05 | 0.04 | 0.08 | 0.04 |
| N3384 | 58 | Y | 0.10 | 57. | 7. | 102. | 7. | 0.04 | 0.05 | 0.07 | 0.06 |
| N3384 | 58 | Y | 0.17 | 70. | 5. | 85. | 4. | 0.10 | 0.03 | 0.02 | 0.03 |
| N3384 | 58 | Y | 0.30 | 69. | 9. | 108. | 10. | 0.06 | 0.08 | 0.00 | 0.09 |
| N3384 | 58 | Y | 0.50 | 74. | 10. | 101. | 9. | 0.15 | 0.07 | 0.05 | 0.07 |
| N3384 | 58 | Y | 0.80 | 85. | 10. | 92. | 11. | 0.04 | 0.06 | 0.06 | 0.06 |
| N3608 | 94 | N | 0.00 | 11. | 30. | 296. | 27. | 0.05 | 0.08 | 0.13 | 0.08 |
| N3608 | 94 | N | 0.05 | 28. | 23. | 270. | 25. | 0.02 | 0.07 | 0.04 | 0.08 |
| N3608 | 94 | N | 0.10 | 1. | 23. | 266. | 21. | 0.03 | 0.07 | 0.10 | 0.07 |
| N3608 | 94 | N | 0.17 | 30. | 26. | 289. | 35. | 0.02 | 0.10 | 0.04 | 0.08 |
| N3608 | 94 | N | 0.30 | 10. | 27. | 227. | 28. | 0.10 | 0.08 | 0.01 | 0.08 |
| N3608 | 94 | N | 0.50 | 5. | 20. | 193. | 18. | 0.05 | 0.06 | 0.01 | 0.04 |
| N3608 | 94 | N | 0.80 | 51. | 43. | 168. | 38. | 0.01 | 0.11 | 0.04 | 0.14 |
| N3608 | 94 | N | 0.05 | 17. | 27. | 256. | 24. | 0.05 | 0.07 | 0.08 | 0.07 |
| N3608 | 94 | N | 0.10 | 14. | 25. | 206. | 21. | 0.02 | 0.07 | 0.07 | 0.06 |
| N3608 | 94 | N | 0.17 | 8. | 25. | 265. | 38. | 0.03 | 0.11 | 0.08 | 0.10 |
| N3608 | 94 | N | 0.30 | 11. | 23. | 187. | 21. | 0.05 | 0.07 | 0.06 | 0.07 |
| N3608 | 94 | N | 0.50 | 7. | 27. | 238. | 33. | 0.19 | 0.11 | 0.14 | 0.10 |
| N3608 | 94 | N | 0.80 | 2. | 36. | 161. | 38. | 0.05 | 0.10 | 0.00 | 0.13 |
| N3608 | 94 | Y | 0.00 | 11. | 30. | 296. | 27. | 0.05 | 0.08 | 0.13 | 0.08 |
| N3608 | 94 | Y | 0.05 | 2. | 14. | 256. | 15. | 0.02 | 0.05 | 0.08 | 0.03 |
| N3608 | 94 | Y | 0.10 | 11. | 15. | 233. | 15. | 0.02 | 0.05 | 0.09 | 0.03 |
| N3608 | 94 | Y | 0.17 | 19. | 19. | 271. | 31. | 0.03 | 0.07 | 0.07 | 0.05 |
| N3608 | 94 | Y | 0.30 | 5. | 14. | 194. | 15. | 0.02 | 0.05 | 0.06 | 0.03 |
| N3608 | 94 | Y | 0.50 | 14. | 13. | 192. | 17. | 0.03 | 0.05 | 0.07 | 0.04 |
| N3608 | 94 | Y | 0.80 | 28. | 20. | 148. | 27. | 0.01 | 0.06 | 0.03 | 0.05 |
| N4291 | 110 | N | 0.00 | 51. | 29. | 306. | 35. | 0.05 | 0.08 | 0.00 | 0.07 |
| N4291 | 110 | N | 0.05 | 76. | 40. | 310. | 38. | 0.09 | 0.09 | 0.01 | 0.08 |
| N4291 | 110 | N | 0.10 | 118. | 38. | 304. | 38. | 0.15 | 0.10 | 0.05 | 0.11 |
| N4291 | 110 | N | 0.17 | 104. | 24. | 264. | 29. | 0.02 | 0.07 | 0.03 | 0.06 |
| N4291 | 110 | N | 0.30 | 114. | 32. | 268. | 33. | 0.07 | 0.08 | 0.03 | 0.06 |
| N4291 | 110 | N | 0.50 | 48. | 27. | 260. | 18. | 0.04 | 0.06 | 0.08 | 0.04 |
| N4291 | 110 | N | 0.80 | 74. | 32. | 279. | 33. | 0.12 | 0.10 | 0.07 | 0.07 |
| N4291 | 110 | N | 0.05 | 47. | 33. | 354. | 45. | 0.05 | 0.10 | 0.02 | 0.08 |
| N4291 | 110 | N | 0.10 | 47. | 25. | 261. | 34. | 0.06 | 0.09 | 0.01 | 0.08 |
| N4291 | 110 | N | 0.17 | 34. | 21. | 275. | 21. | 0.01 | 0.06 | 0.06 | 0.06 |
| N4291 | 110 | N | 0.30 | 15. | 27. | 273. | 22. | 0.07 | 0.07 | 0.05 | 0.06 |
| N4291 | 110 | N | 0.50 | 97. | 26. | 253. | 19. | 0.00 | 0.04 | 0.08 | 0.04 |
| N4291 | 110 | N | 0.80 | 10. | 34. | 278. | 34. | 0.02 | 0.07 | 0.06 | 0.05 |
| N4291 | 110 | Y | 0.00 | 51. | 29. | 306. | 35. | 0.05 | 0.08 | 0.00 | 0.07 |
| N4291 | 110 | Y | 0.05 | 49. | 22. | 282. | 20. | 0.11 | 0.06 | 0.07 | 0.06 |
| N4291 | 110 | Y | 0.10 | 19. | 21. | 262. | 20. | 0.05 | 0.05 | 0.07 | 0.04 |
| N4291 | 110 | Y | 0.17 | 70. | 18. | 271. | 20. | 0.00 | 0.06 | 0.01 | 0.05 |
| N4291 | 110 | Y | 0.30 | 63. | 18. | 252. | 16. | 0.02 | 0.04 | 0.05 | 0.03 |
| N4291 | 110 | Y | 0.50 | 74. | 18. | 241. | 16. | 0.04 | 0.05 | 0.11 | 0.03 |
| N4291 | 110 | Y | 0.80 | 61. | 23. | 246. | 24. | 0.06 | 0.06 | 0.03 | 0.06 |
| N4473 | 100 | N | 0.00 | 4. | 25. | 162. | 25. | 0.02 | 0.07 | 0.08 | 0.08 |
| N4473 | 100 | N | 0.05 | 4. | 17. | 153. | 14. | 0.05 | 0.05 | 0.05 | 0.05 |
| N4473 | 100 | N | 0.10 | 27. | 14. | 140. | 12. | 0.05 | 0.04 | 0.01 | 0.04 |
| N4473 | 100 | N | 0.17 | 46. | 17. | 150. | 16. | 0.04 | 0.05 | 0.03 | 0.04 |
| N4473 | 100 | N | 0.30 | 69. | 19. | 155. | 18. | 0.06 | 0.05 | 0.02 | 0.05 |
| N4473 | 100 | N | 0.50 | 67. | 20. | 157. | 13. | 0.08 | 0.04 | 0.04 | 0.04 |
| N4473 | 100 | N | 0.80 | 57. | 17. | 199. | 15. | 0.05 | 0.05 | 0.03 | 0.04 |
| N4473 | 100 | N | 0.05 | 43. | 20. | 163. | 14. | 0.03 | 0.06 | 0.06 | 0.04 |
| N4473 | 100 | N | 0.10 | 41. | 20. | 171. | 15. | 0.08 | 0.06 | 0.06 | 0.05 |
| N4473 | 100 | N | 0.17 | 47. | 20. | 175. | 16. | 0.04 | 0.07 | 0.03 | 0.05 |
| N4473 | 100 | N | 0.30 | 53. | 23. | 168. | 14. | 0.00 | 0.06 | 0.04 | 0.05 |
| N4473 | 100 | N | 0.50 | 54. | 21. | 160. | 12. | 0.07 | 0.05 | 0.02 | 0.03 |
| N4473 | 100 | N | 0.80 | 14. | 28. | 188. | 20. | 0.03 | 0.06 | 0.09 | 0.04 |
| N4473 | 100 | Y | 0.00 | 4. | 25. | 162. | 25. | 0.02 | 0.07 | 0.08 | 0.08 |
| N4473 | 100 | Y | 0.05 | 17. | 15. | 160. | 9. | 0.03 | 0.05 | 0.06 | 0.04 |
| N4473 | 100 | Y | 0.10 | 37. | 9. | 150. | 9. | 0.06 | 0.04 | 0.02 | 0.04 |
| N4473 | 100 | Y | 0.17 | 47. | 11. | 159. | 10. | 0.04 | 0.04 | 0.01 | 0.03 |
| N4473 | 100 | Y | 0.30 | 56. | 11. | 157. | 11. | 0.04 | 0.04 | 0.04 | 0.03 |
| N4473 | 100 | Y | 0.50 | 67. | 13. | 152. | 12. | 0.09 | 0.04 | 0.01 | 0.03 |
| N4473 | 100 | Y | 0.80 | 38. | 16. | 190. | 13. | 0.05 | 0.05 | 0.07 | 0.04 |
| N4564 | 143 | N | 0.00 | 12. | 17. | 220. | 20. | 0.01 | 0.07 | 0.00 | 0.08 |
| N4564 | 143 | N | 0.05 | 29. | 15. | 191. | 15. | 0.03 | 0.04 | 0.04 | 0.05 |
| N4564 | 143 | N | 0.10 | 7. | 16. | 212. | 18. | 0.07 | 0.06 | 0.02 | 0.05 |
| N4564 | 143 | N | 0.17 | 18. | 18. | 199. | 18. | 0.11 | 0.04 | 0.00 | 0.06 |
| N4564 | 143 | N | 0.30 | 81. | 25. | 181. | 20. | 0.05 | 0.07 | 0.05 | 0.07 |
| N4564 | 143 | N | 0.50 | 24. | 38. | 192. | 32. | 0.06 | 0.08 | 0.04 | 0.08 |
| N4564 | 143 | N | 0.80 | 166. | 37. | 156. | 23. | 0.07 | 0.07 | 0.05 | 0.04 |
| N4564 | 143 | N | 0.05 | 19. | 18. | 229. | 22. | 0.06 | 0.06 | 0.03 | 0.06 |
| N4564 | 143 | N | 0.10 | 23. | 18. | 207. | 20. | 0.05 | 0.06 | 0.03 | 0.06 |
| N4564 | 143 | N | 0.17 | 50. | 17. | 216. | 17. | 0.02 | 0.05 | 0.03 | 0.06 |
| N4564 | 143 | N | 0.30 | 43. | 33. | 159. | 34. | 0.06 | 0.10 | 0.04 | 0.11 |
| N4564 | 143 | N | 0.50 | 55. | 19. | 146. | 17. | 0.04 | 0.04 | 0.06 | 0.06 |
| N4564 | 143 | N | 0.80 | 28. | 38. | 199. | 50. | 0.28 | 0.12 | 0.16 | 0.17 |
| N4564 | 143 | Y | 0.00 | 12. | 17. | 220. | 20. | 0.01 | 0.07 | 0.00 | 0.08 |
| N4564 | 143 | Y | 0.05 | 22. | 9. | 199. | 9. | 0.01 | 0.04 | 0.04 | 0.03 |
| N4564 | 143 | Y | 0.10 | 8. | 9. | 194. | 10. | 0.02 | 0.04 | 0.06 | 0.03 |
| N4564 | 143 | Y | 0.17 | 33. | 9. | 197. | 10. | 0.07 | 0.04 | 0.06 | 0.03 |
| N4564 | 143 | Y | 0.30 | 65. | 19. | 166. | 15. | 0.09 | 0.06 | 0.06 | 0.04 |
| N4564 | 143 | Y | 0.50 | 44. | 14. | 163. | 17. | 0.01 | 0.04 | 0.06 | 0.03 |
| N4564 | 143 | Y | 0.80 | 90. | 34. | 194. | 29. | 0.20 | 0.09 | 0.06 | 0.08 |
| N4649 | 95 | N | 0.00 | 17. | 106. | 547. | 101. | 0.05 | 0.09 | 0.07 | 0.08 |
| N4649 | 95 | N | 0.08 | 116. | 68. | 573. | 59. | 0.01 | 0.07 | 0.12 | 0.07 |
| N4649 | 95 | N | 0.17 | 51. | 97. | 627. | 69. | 0.18 | 0.07 | 0.10 | 0.09 |
| N4649 | 95 | N | 0.30 | 105. | 61. | 487. | 66. | 0.06 | 0.07 | 0.04 | 0.06 |
| N4649 | 95 | N | 0.50 | 191. | 104. | 505. | 67. | 0.10 | 0.06 | 0.02 | 0.06 |
| N4649 | 95 | N | 0.88 | 65. | 73. | 448. | 52. | 0.05 | 0.06 | 0.04 | 0.04 |
| N4649 | 95 | N | 1.50 | 6. | 84. | 441. | 61. | 0.03 | 0.07 | 0.03 | 0.05 |
| N4649 | 95 | N | 0.08 | 6. | 98. | 632. | 80. | 0.09 | 0.07 | 0.02 | 0.08 |
| N4649 | 95 | N | 0.17 | 116. | 119. | 706. | 67. | 0.18 | 0.13 | 0.14 | 0.13 |
| N4649 | 95 | N | 0.30 | 259. | 123. | 657. | 72. | 0.13 | 0.12 | 0.05 | 0.09 |
| N4649 | 95 | N | 0.50 | 73. | 88. | 501. | 89. | 0.08 | 0.08 | 0.04 | 0.05 |
| N4649 | 95 | N | 0.88 | 18. | 67. | 490. | 61. | 0.01 | 0.07 | 0.05 | 0.05 |
| N4649 | 95 | N | 1.50 | 46. | 83. | 490. | 65. | 0.06 | 0.06 | 0.01 | 0.04 |
| N4649 | 95 | Y | 0.00 | 17. | 106. | 547. | 101. | 0.05 | 0.09 | 0.07 | 0.08 |
| N4649 | 95 | Y | 0.08 | 62. | 51. | 591. | 57. | 0.05 | 0.05 | 0.09 | 0.06 |
| N4649 | 95 | Y | 0.17 | 68. | 70. | 667. | 79. | 0.00 | 0.07 | 0.10 | 0.07 |
| N4649 | 95 | Y | 0.30 | 121. | 56. | 524. | 69. | 0.03 | 0.05 | 0.01 | 0.06 |
| N4649 | 95 | Y | 0.50 | 145. | 70. | 485. | 67. | 0.14 | 0.05 | 0.03 | 0.04 |
| N4649 | 95 | Y | 0.88 | 43. | 44. | 450. | 41. | 0.04 | 0.05 | 0.06 | 0.04 |
| N4649 | 95 | Y | 1.50 | 13. | 47. | 439. | 44. | 0.05 | 0.06 | 0.01 | 0.05 |
| N4697 | 68 | N | 0.00 | 7. | 10. | 171. | 10. | 0.05 | 0.04 | 0.10 | 0.04 |
| N4697 | 68 | N | 0.05 | 28. | 10. | 177. | 11. | 0.04 | 0.04 | 0.09 | 0.05 |
| N4697 | 68 | N | 0.10 | 21. | 12. | 215. | 10. | 0.06 | 0.04 | 0.02 | 0.05 |
| N4697 | 68 | N | 0.17 | 54. | 16. | 206. | 22. | 0.05 | 0.07 | 0.05 | 0.08 |
| N4697 | 68 | N | 0.30 | 48. | 16. | 153. | 36. | 0.01 | 0.12 | 0.02 | 0.15 |
| N4697 | 68 | N | 0.50 | 63. | 32. | 149. | 41. | 0.15 | 0.14 | 0.11 | 0.17 |
| N4697 | 68 | N | 0.80 | 104. | 24. | 115. | 28. | 0.05 | 0.10 | 0.06 | 0.11 |
| N4697 | 68 | N | 0.05 | 9. | 8. | 168. | 11. | 0.02 | 0.04 | 0.10 | 0.04 |
| N4697 | 68 | N | 0.10 | 28. | 11. | 182. | 15. | 0.07 | 0.04 | 0.07 | 0.05 |
| N4697 | 68 | N | 0.17 | 77. | 16. | 171. | 20. | 0.10 | 0.08 | 0.09 | 0.07 |
| N4697 | 68 | N | 0.30 | 54. | 16. | 166. | 21. | 0.03 | 0.11 | 0.03 | 0.07 |
| N4697 | 68 | N | 0.50 | 82. | 27. | 115. | 37. | 0.22 | 0.16 | 0.16 | 0.16 |
| N4697 | 68 | N | 0.80 | 155. | 41. | 201. | 38. | 0.46 | 0.14 | 0.28 | 0.18 |
| N4697 | 68 | Y | 0.00 | 0. | 0. | 155. | 13. | 0.00 | 0.00 | 0.14 | 0.06 |
| N4697 | 68 | Y | 0.05 | 20. | 7. | 187. | 20. | 0.02 | 0.02 | 0.16 | 0.07 |
| N4697 | 68 | Y | 0.10 | 27. | 7. | 217. | 9. | 0.00 | 0.03 | 0.04 | 0.06 |
| N4697 | 68 | Y | 0.17 | 64. | 10. | 195. | 18. | 0.00 | 0.04 | 0.11 | 0.08 |
| N4697 | 68 | Y | 0.30 | 51. | 14. | 178. | 20. | 0.02 | 0.08 | 0.04 | 0.09 |
| N4697 | 68 | Y | 0.50 | 67. | 25. | 126. | 39. | 0.19 | 0.16 | 0.27 | 0.12 |
| N4697 | 68 | Y | 0.80 | 110. | 21. | 138. | 24. | 0.16 | 0.16 | 0.06 | 0.17 |
| N7457 | 130 | N | 0.00 | 3. | 9. | 105. | 8. | 0.07 | 0.06 | 0.01 | 0.05 |
| N7457 | 130 | N | 0.05 | 8. | 9. | 100. | 8. | 0.05 | 0.07 | 0.06 | 0.04 |
| N7457 | 130 | N | 0.10 | 8. | 17. | 82. | 14. | 0.11 | 0.07 | 0.04 | 0.10 |
| N7457 | 130 | N | 0.17 | 19. | 41. | 92. | 23. | 0.09 | 0.15 | 0.11 | 0.22 |
| N7457 | 130 | N | 0.05 | 9. | 11. | 79. | 7. | 0.08 | 0.05 | 0.03 | 0.04 |
| N7457 | 130 | N | 0.10 | 11. | 12. | 76. | 8. | 0.15 | 0.09 | 0.05 | 0.06 |
| N7457 | 130 | N | 0.17 | 10. | 19. | 77. | 13. | 0.11 | 0.07 | 0.01 | 0.06 |
| N7457 | 130 | Y | 0.00 | 3. | 9. | 105. | 8. | 0.07 | 0.06 | 0.01 | 0.05 |
| N7457 | 130 | Y | 0.05 | 8. | 7. | 88. | 6. | 0.05 | 0.05 | 0.03 | 0.03 |
| N7457 | 130 | Y | 0.10 | 7. | 7. | 80. | 10. | 0.01 | 0.06 | 0.03 | 0.05 |
| N7457 | 130 | Y | 0.17 | 2. | 15. | 79. | 18. | 0.06 | 0.08 | 0.03 | 0.07 |