The stellar content of OMC 2/3 ††thanks: Based on observations collected at the European Southern Observatory, La Silla, Chile
We have revisited the stellar content of OMC 2 and OMC 3 by means of MIR imaging and NIR photometry; in addition, we have extended the existing (sub)mm maps by a huge m map obtained with SIMBA showing new sources and filamentary features for the first time at that wavelength. The MIR data reveal 43 new sources at and which are partly associated with dense condensations at millimetre wavelengths. Six close binary sources could be resolved at locations where existing (sub)mm maps only show single emission peaks; three of them are classified as early (B-type) systems, one of them is compatible with type K while the remaining two seem to be T Tauri stars. Furthermore, the MIR images indicate the existence of separate circumstellar discs in the K-binary system. NIR colour–colour and colour–magnitude diagrams obtained from 2MASS data are examined to explore the physical properties of the sources and to derive the distribution of luminosities. There is a clear decrease in luminosity and thus in stellar mass when going from South to North. Likewise, there is an anti-correlation between Class I and II objects in both regions: while OMC 2 contains twice as much Class II objects compared to Class I, the situation is reversed in OMC 3.
Key Words.:
ISM: dust – stars: circumstellar matter, formation1 Introduction
The GMC complex Orion A is usually separated into three distinct components, i.e. OMC 1, 2 and 3. The OMC 2/3 region has turned out to be one of the most active sites of ongoing low and intermediate-mass star formation known today. Numerous observations at optical, NIR, FIR, sub-mm and cm wavelengths have been devoted to the stellar content of this region, and have revealed a young association with sources of different evolutionary stages.
Gatley et al. (gatley (1974)) originally discovered OMC 2 as a star forming region by IR and CO measurements. They found 5 embedded IR sources within a cloud core of . This region is a small fraction of the cloud complex Orion A found by Kutner et al. (kutner (1977)). A spatially well resolved study in the 13CO line revealed a filamentary structure (Bally et al. bally (1987)) of the entire region. Infrared studies (e.g. Rayner et al. rayner (1989); Johnson et al. johnson (1990); Jones et al. jones (1994); Ali & DePoy ali (1995)) discovered a population of young stars, many of them surrounded by circumstellar discs (e.g. O’Dell et al. odell (1993); McCaughrean & O’Dell mc (1996); Hillenbrand et al. hillenbrand (1998)).
During the first m continuum mapping of OMC 1 and 2, Mezger et al. (mezger (1990)) found 10 compact sources. Subsequently, Chini et al. (chini (1997)) investigated OMC 2 and 3 at m with a better spatial coverage and higher sensitivity, and discovered a long integral shaped narrow dust ridge ranging from OMC 1 to OMC 3 that contains 21 compact sources. Two of them were also detected by IRAS. 350 m imaging by Lis et al. (lis (1998)) suggested the presence of even 33 dust condensations within the area. Finally, the largest m continuum map of Orion A (Nyman et al. nyman (2001)) extends over in declination and depicts the total dust emission from that region. Many of the (sub)mm objects exhibit molecular H2 outflows (Castets & Langer castets (1995); Yu et al. yu (1997)).
A VLA survey by Reipurth et al. (reipurth (1999)) led to the detection of a number of radio sources, 11 of which were associated with previously detected (sub)mm condensations. Tsuboi et al. (tsuboi01 (2001)) report on X-ray sources in OMC 3 and associate them with very young stellar objects.
| RA | Dec | other designations | |||||||||
|---|---|---|---|---|---|---|---|---|---|---|---|
| MIR | (J2000) | MM | CSO | VLA | 2MASS | AD | CHS | IRS | IRAS | ||
| 1 | 5h35m2829 | 4∘58′375 | |||||||||
| 2 | 2833 | 58′385 | S(c) | 2083 | 10398 | ||||||
| 3 | 1617 | 5∘00′026 | + | 3 | 2068 | 8787 | |||||
| 4 | 1774 | 00′319 | 2063 | ||||||||
| 5 | 1834 | 00′328 | 1 | ||||||||
| 6 | 1833 | 00′340 | MMS 2 | 6 | 2062 | ||||||
| 7 | 1998 | 01′029 | MMS 4 | 8 | 2053 | ||||||
| 8 | 236 | 01′46′′ | |||||||||
| 9 | 2831 | 03′408 | + | 11 | 2014 | ||||||
| 10 | 2669 | 03′549 | MMS 7 | 12 | 4 | 2006 | 2117 | 05329-0505 | |||
| 11 | 3154 | 05′473 | + | 1979 | 2468 | 10792 | |||||
| 12 | 2576 | 05′579 | + | 1975 | 2079 | ||||||
| 13 | 2189 | 07′018 | 1957 | 9617 | 05329-0508 | ||||||
| 14 | 2334 | 07′098 | FIR 1c | 16 | 1954 | 2066 | |||||
| 15 | 2237 | 07′391 | 1948 | 2064 | |||||||
| 16 | 2573 | 07′462 | 1946 | 10104 | |||||||
| 17 | 2558 | 07′574 | 9 | 1936 | 2062 | ||||||
| 18 | 2334 | 08′216 | 1925 | 1928 | |||||||
| 19 | 2430 | 08′310 | FIR 2 | 20 | |||||||
| 20 | 2686 | 09′244 | + | 1896 | 10242 | 2 | |||||
| 21 | 2765 | 09′340 | 11 | 2446 | 4-N | ||||||
| 22 | 2765 | 09′372 | FIR 3 | 22 | 1886 | 10318 | 4-S | ||||
| 23 | 2748 | 09′442 | 1882 | 2445 | |||||||
| 24 | 2699 | 09′545 | FIR 4(?) | 23 | 12 | 1876 | 1867 | ||||
| 25 | 2756 | 10′085 | + | 1868 | 1863 | ||||||
| 26 | 2816 | 10′139 | + | 1864 | 2996 | 10383 | |||||
| 27 | 2698 | 10′173 | FIR 5(?) | 24 | 1862 | 2444 | 3 | 05329-0512 | |||
| 28 | 2476 | 10′296 | + | 13 | 1854 | 2443 | 1 | ||||
| 29 | 2337 | 12′030 | FIR 6b | 25 | 1822 | 1691 | |||||
| 30 | 1823 | 13′069 | + | 2440 | 9094 | ||||||
| 31 | 2014 | 13′132 | 2405 | ||||||||
| 32 | 2016 | 13′156 | FIR 6d | 30 | 1796 | 2439 | 9373 | ||||
| 33 | 1967 | 13′265 | 1793 | 1679 | 9305 | ||||||
| 34 | 1853 | 13′387 | 2404 | 9147 | |||||||
| 35 | 2025 | 13′594 | 1775 | 2403 | |||||||
| 36 | 2263 | 14′113 | + | 1770 | 1667 | ||||||
| 37 | 2194 | 14′276 | + | 31 | 1762 | ||||||
| 38 | 2192 | 15′011 | + | 32 | 1748 | 1654 | 9624 | ||||
| 39 | 1985 | 15′089 | |||||||||
| 40 | 1981 | 15′095 | + | 1743 | 2402 | 9335 | |||||
| 41 | 2349 | 15′233 | + | 1736 | 1646 | 9829 | |||||
| 42 | 1983 | 15′352 | + | 33 | 1731 | 1644 | 9333 | ||||
| 43 | 2530 | 15′355 | |||||||||
| 44 | 2524 | 15′357 | + | 1730 | 2401 | 10037 | |||||
| 45 | 2076 | 15′492 | 1722 | 2994 | |||||||
| [mJy] | |||||||||||
| MIR | m | m | m | m | m | 3.6 cm | |||||
| 1 | 30 | ||||||||||
| 2 | 2.3 | 18.5 | 30 | 290 | |||||||
| 3 | 0.5 | 5.0 | 18.5 | 180 | 240 | 1270 | 17000 | 179 | 0.3 | ||
| 4 | 1.1 | 6.2 | 15.3 | 25 | 40 | ||||||
| 5 | 745 | 655 | 1600 | 0.25 | |||||||
| 6 | 0.2 | 0.8 | 24.4 | 355 | 200 | 915 | 25000 | 249 | 1.1 | ||
| 7 | 1.1 | 20 | 27000 | 354 | 0.9 | ||||||
| 8 | 230 | 300 | |||||||||
| 9 | 0.5 | 10.3 | 475 | 445 | 1430 | 15000 | 164 | 1.2 | |||
| 10 | 2.3 | 19.4 | 71.6 | 990 | 1495 | 8830 | 19000 | 360 | 0.59 | 0.7 | 115 |
| 11 | 28.2 | 134.8 | 347.4 | 860 | 2090 | 2260 | 228 | ||||
| 12 | 0.6 | 2.1 | 6.5 | 85 | 146 | 0.6 | |||||
| 13 | 64.9 | 109.3 | 124.2 | 245 | |||||||
| 14 | 0.3 | 1.7 | 8.6 | 30 | 18000 | 180 | 2.84 | ||||
| 15 | 1.7 | 14.6 | 46.6 | 75 | |||||||
| 16 | 2.2 | 9.6 | 23.5 | 20 | |||||||
| 17 | 29.8 | 37.6 | 58.4 | 140 | 790 | 0.24 | |||||
| 18 | 0.4 | 2.2 | 8.0 | 20 | 0.2 | ||||||
| 19 | 11 | 17000 | 340 | ||||||||
| 20 | 1.3 | 6.8 | 23.8 | 1510 | 2275 | 3430 | 351 | 1.5 | |||
| 21 | 315 | 364 | 8665 | ||||||||
| 22 | 9.3 | 68.4 | 189.2 | 1130 | 1130 | 1980 | 36000 | 676 | 0.0 | ||
| 23 | 30.0 | 67.8 | 83.5 | 140 | 75 | ||||||
| 24 | 1.3 | 3.0 | 5.9 | 45 | 67000 | 1252 | 0.64 | 0.2 | |||
| 25 | 0.6 | 1.1 | 5.2 | 26 | 216 | 0.0 | |||||
| 26 | 52.0 | 91.8 | 115.2 | 332 | 423 | 0.3 | |||||
| 27 | 4.9 | 46.2 | 230.0 | 8510 | 34000 | 452 | 1.1 | 160 | |||
| 28 | 0.6 | 11.2 | 88.7 | 2995 | 18010 | 186 | 1.04 | 1.1 | 1075 | ||
| 29 | 0.4 | 5.4 | 15000 | 300 | |||||||
| 30 | 40 | 80 | 90 | 60 | 186 | ||||||
| 31 | 170 | 430 | 365 | ||||||||
| 32 | 176.9 | 781.7 | 1635 | 4060 | 4845 | 12000 | 314 | ||||
| 33 | 4.0 | 24.3 | 56.8 | 75 | 685 | ||||||
| 34 | 30 | 80 | 110 | 550 | 92 | 0.0 | |||||
| 35 | 17.8 | 54.4 | 79.4 | 60 | |||||||
| 36 | 32.4 | 52.2 | 57.2 | 39 | 184 | ||||||
| 37 | 31.2 | 43.0 | 35.8 | 15000 | 189 | ||||||
| 38 | 12.1 | 24.4 | 25.2 | 15000 | 161 | ||||||
| 39 | 255 | ||||||||||
| 40 | 9.7 | 31.5 | 56.1 | 150 | 140 | 0.2 | |||||
| 41 | 3.2 | 4.2 | 3.4 | 42 | |||||||
| 42 | 0.7 | 8.9 | 80 | 20000 | 288 | 0.2 | |||||
| 43 | 44 | ||||||||||
| 44 | 24.9 | 51.6 | 65.6 | 74 | 48 | ||||||
| 45 | 174.5 | 368.0 | 418.5 | 30 | |||||||
Despite this wealth of data, the evolutionary stage of many objects is still unclear; this is true for the pure (sub)mm sources as well as for some NIR sources with (sub)mm and radio counterparts. A major reason for the uncertainty is the relatively large positional offset between data at different wavelengths which makes a unique correlation sometimes impossible. Another difficulty arises from the classification of the objects in the absence of sufficient spectral coverage – particularly at shorter wavelengths. As suggested by André et al. (andre (1993)), the ratio of bolometric to sub-mm luminosity may give an indication of the youth of a protostar; they argue that the bolometric luminosity is a measure of the protostellar mass, while the sub-mm luminosity represents the mass of the cold, circumstellar matter. The ratio of both quantities should therefore reflect the evolutionary stage of the protostellar system in the sense that the sub-mm luminosity must decrease with the ongoing accretion of the surrounding material. However, in practice the ratio is difficult – in most cases even impossible – to determine, because these earliest stellar stages evolve deeply within dust clouds so that NIR observations – if available at all – suffer from heavy extinction. In addition, satellite (or airborne) FIR observations of protostars have been limited so far by sensitivity and spatial resolution so that remains a poorly constrained quantity in most cases. Thus, it seems that further classification criteria for protostellar sources would be highly desirable.
The advent of sensitive ground–based MIR imaging devices is likely to improve the situation because they i) provide a sub-arcsec resolution, ii) have a better sensitivity than IRAS, and iii) are barely influenced by interstellar extinction. In addition, they fill an important gap in existing spectral energy distributions (SEDs) – right between the NIR and (sub)mm regimes, and thus seem to be ideally suited to elucidate the evolutionary stage of protostellar candidates.
In the present paper, we report on an and band survey of OMC 2/3 with TIMMI 2 following up our previous investigations of the youngest stars in Orion. Data from our new extended m continuum survey of the region with SIMBA as well as NIR data from the 2MASS database are also included.
2 Observations
The mid-infrared (MIR) observations were carried out in January 2001 and 2002 with TIMMI 2 (Dietzsch & Reimann dietzsch (1998); Reimann et al. reimann (1998)) at the ESO 3.6 m telescope, La Silla, Chile. TIMMI 2 is a mid-infrared spectrograph and imager operated in the M (5 m), N (10 m) and Q (20 m) atmospheric bandpasses (c.f. http://www.ls.eso.org/lasilla/Telescopes/360cat/ timmi/). We observed in the - and -bands. The first run was carried out using a set of filters centred at wavelengths of 11.9 () and 17.8m (). The -band filter was replaced with one centred at 10.4m for the second campaign, in which we re-measured nearly all the previous detections. The average seeing was about 07 being close to diffraction limited imaging. In order to achieve a good relative pointing accuracy, we used the bright object MMS 7 (Chini et al. chini (1997)) as a positional standard from which we offset the telescope for each new target position. This enabled us to correlate the MIR sources in a unique way with detections from the VLA, the 2MASS data base, and (sub)mm observations. Several suitable TIMMI 2 standard stars were observed for calibration purposes.
The m continuum observations were carried out with the 37-channel bolometer array SIMBA at the SEST on La Silla, Chile during the second commissioning period in October 2001. Skydips were performed every three hours in order to correct for the atmospheric opacity. Maps of Uranus were taken for calibration purposes. The final map of about in declination covers the full region of OMC 1 to 3 and was created from 13 single fast-scanning maps. The residual noise is about 40 mJy/beam (rms). The beam size is . All data were reduced and analysed with MOPSI111MOPSI is a reduction software for infrared, millimetre and radio data, developed and constantly upgraded by R. Zylka, IRAM, Grenoble, France. according to the instructions of the SEST manual (sest (2002)).
In addition, we show an extension of the spatially higher resolved m image of Chini et al. (chini (1997)) of 3′ towards the South. This hitherto unpublished map was obtained at IRAM (Sievers, priv. comm.) and allowed us to look for coinciding detections down to a declination of .
The 2MASS data were accessed via the VizieR Online Catalogue Service222http://vizier.u-strasbg.fr. Only such objects were selected which were detected in at least two wavebands of . The cited magnitude was transformed into a magnitude according to Wainscoat & Cowie (wainscoat (1992)). Furthermore, the conversion from magnitudes to physical flux quantities was achieved following the calibration information of the 2MASS Explanatory Supplement (Sect. IV 5a).
3 Overview of the region
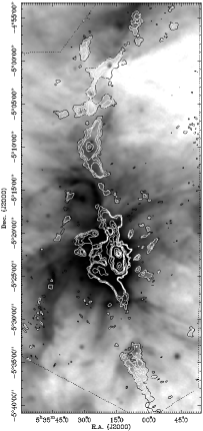
Fig. 1 gives an overview of the Orion A region including OMC 1 – 3; it was obtained with SIMBA at m and extends the original map by Chini et al. (chini (1997)) both towards North and South. This map resembles - apart from the lower resolution - very much our previous one, but shows this time fainter extended emission. In addition, there are new complexes with embedded sources in the Northern and the very Southern region; the strongest compact source to the very North-East is labelled “S” according to “SIMBA”. The m contours are plotted over an m image from MSX (Midcourse Space Experiment). The correspondence at both wavebands is striking. The m emission filaments in OMC 3 appear in absorption in the MSX map, indicating the presence of dense and cool dust. Moving further to the South, the dust temperature seems to increase as witnessed by the emission at m.
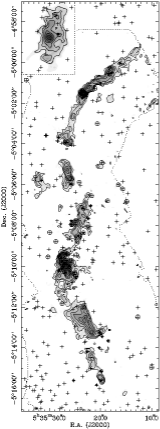
Fig. 2 shows the m emission of OMC 2/3 at twice the resolution of Fig. 1; it was taken from Chini et al. (chini (1997)) and was extended to the South by an additional mosaic of in declination, kindly provided by A. Sievers (priv. comm.). The positions of the new MIR sources from TIMMI 2 as well as all 2MASS detections within the region are also marked. It becomes clear from this figure that we have to deal with a number of combinations as concerns the coincidence of detections at NIR, MIR and mm wavelengths.
Table 1 gives the positions for all objects detected in our MIR survey. Although there is a number of different names associated with certain sources in the field, we use – for reasons of homogeneity - the running number of the MIR sources as a nomenclature in the present paper. Other designations are given for comparison. Comparing the positions derived for our m sources with astrometry from the VLA and 2MASS, we estimate an accuracy of better than 1″. The VLA positions are taken from Reipurth et al. (reipurth (1999)), while the NIR reference frame is based on the 2MASS database. Whenever the the nominal MIR position according to the telescope information agreed within 3′′ with a VLA or a 2MASS detection, we assumed that the sources are identical. Since many MIR frames contain more than one object and are often overlapping with adjacent frames, the identifications could be cross-checked against each other and with the MSX data, giving a consistent picture.
Altogether, there are 45 MIR sources which have 28 counterparts in the m map by Chini et al. (chini (1997)). However, only the 10 strongest mm sources were labelled with an MMS or FIR number by Chini et al. (chini (1997)) while 17 weaker mm sources do not yet have any millimetre designation. Those sources are marked with a “+” in Table 1 in order to emphasise the coincidence between a MIR and a m source.
The NIR identifications in Table 1 refer to scan No. 10 of the 2MASS survey as well as the measurements of Ali & DePoy (ali (1995), AD), Carpenter et al. (carpenter (2001), CHS) and Gatley et al. (gatley (1974)), who introduced the labelling of IRS 1 to 5. Additionally, those IRAS sources are mentioned, whose error ellipses include the positions of our MIR sources.
The photometric data is given in Table 2. It contains the NIR flux densities, mostly taken from the 2MASS database. In rare cases, where 2MASS data were not available, we used the measurements of AD and CHS. The listed MIR flux densities were acquired with our TIMMI 2 observations. For reasons of homogeneity, we re-measured all m flux densities for the MIR sources. Therefore, the values for those 15 objects which were not obviously outstanding in the m map by Chini et al. (chini (1997)) are new and are marked in bold letters. The same holds for the new North-Eastern source, where we extracted the millimetre flux from the SIMBA map. The previously published values are in accord with our new estimates.
4 Results
The detection of an individual source at the different wavebands (see Table 1) gives a first indication that we are dealing with a variety of sources at different evolutionary stages. Likewise, Table 2 corroborates this view, because the relative energy output at certain spectral regions changes tremendously from source to source. In order to get a comprehensive view of the stellar content in the region, we have used two major data sets: 43 sources come from our MIR survey (hereafter MIR sample) whereas 264 sources were obtained from the 2MASS database (NIR sample). Subsequently, both groups were divided according to their location in OMC 2 and 3, respectively.
4.1 The colour–colour diagram
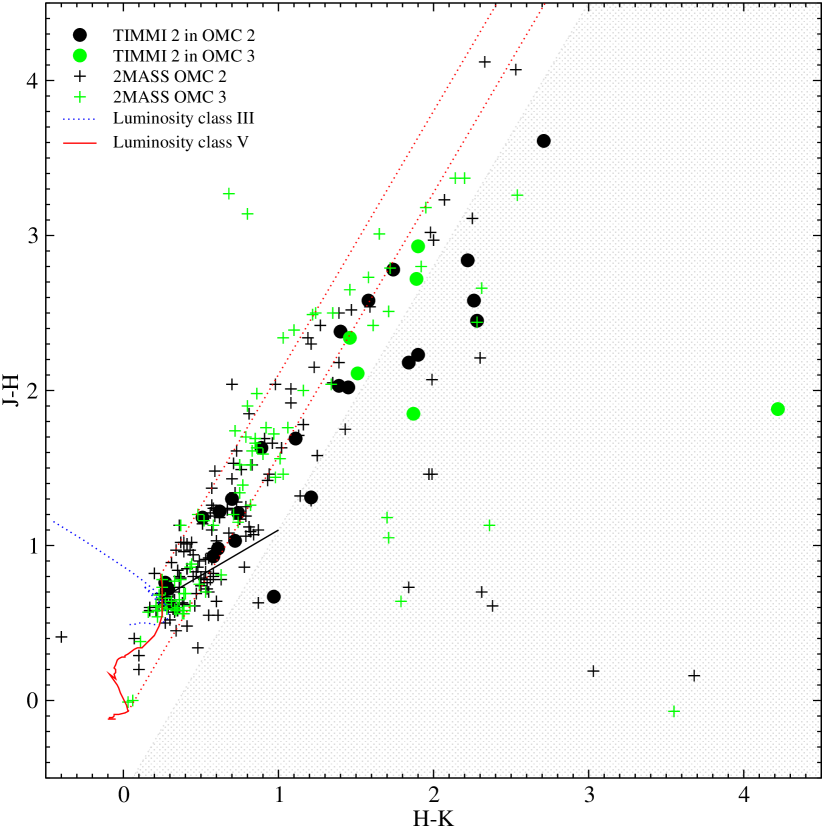
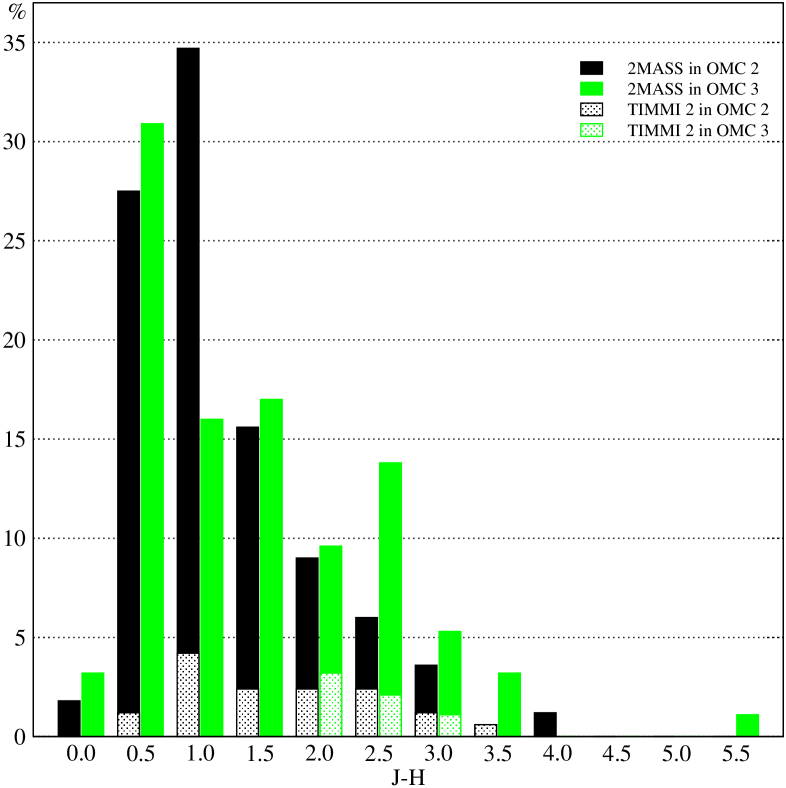
Fig. 3 shows the NIR colour–colour diagram of all 264 known IR sources in the region; the photometric errors in both axes are typically around 0.2 mag, and rise up to 1 mag for the faintest objects. Despite this large error margin, the sources are mainly located in “allowed” regions as discussed below. Unfortunately, not all MIR sources can be associated with NIR counterparts: 5 MIR binary systems have not been resolved by 2MASS and thus have a single NIR entry only. 2 MIR objects were exclusively detected at and 2 MIR objects could not be observed at all. In order to achieve a crude classification of the sources we distinguish four different areas within the diagram.
| Colour region | ||||
|---|---|---|---|---|
| Sample | other | normal | T Tau | excess |
| 2MASS / OMC 2 | 2 | 107 | 38 | 22 |
| 2MASS / OMC 3 | 2 | 64 | 19 | 10 |
| TIMMI 2 / OMC 2 | 0 | 11 | 5 | 8 |
| TIMMI 2 / OMC 3 | 0 | 0 | 4 | 2 |
4.1.1 Giant region
Within the errors, 4 NIR sources lie in the region of giant stars. 3 of them have photometry errors of mag which makes a secure classification as giant stars rather uncertain. Since 2 sources have extinction values mag, we regard them as true background objects not related to the stellar population of the OMC 2/3 region. These 4 objects were excluded from any further analysis.
4.1.2 Main-sequence region
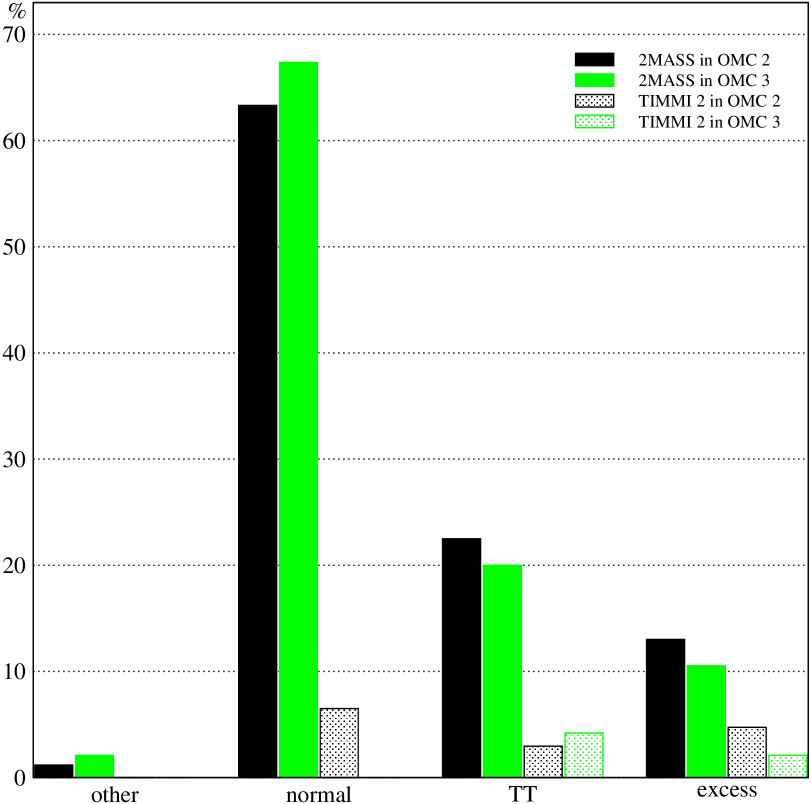
There are 172 sources with ”normal” colours in the area of reddened main-sequence (MS) stars with -values of up to 30 mag. Following our crude division, the majority of objects (%) comes from the NIR sample only, indicating that this population is dominated by evolved objects. On the other hand, only 11 objects (37%) of the MIR sample have NIR colours that are compatible with MS stars.
4.1.3 T Tauri region
Taking – somewhat arbitrarily – the lower reddening vector for MS stars as the dividing line between MS and T Tauri (TT) stars we end up with 57 sources that are located in the T Tauri region. They exhibit -values of up to 30 mag. Here, 48 objects (18%) come from the NIR sample alone. 9 objects of the MIR selected sample (30%) are found in that region. This suggests that the MIR group contains a larger fraction of T Tauri stars.
4.1.4 Excess region
The shaded area in Fig. 3 denotes the regime of IR-excess stars. Its left boundary to the T Tauri regime is determined by the truncation of the T Tauri branch at , as shown by Meyer et al. (meyer (1997)). Ten sources were detected at MIR wavelengths (33%), whereas 32 (12%) could be found in the NIR. This corroborates the trend that the fraction of YSOs increases in the MIR sample compared to the NIR sample when going to earlier evolutionary stages.
Altogether there are 32 excess objects of which 22 are located in OMC 2 and 10 in OMC 3. There is no clear division of both groups in terms of extinction and/or strength of excess, although sources in OMC 3 seem to be slightly redder. For example, the source with the highest extinction is the MIR 1/2 binary with , but it has been excluded from the colour–colour diagram due to its large error. The largest excess of also occurs with an OMC 3 object.
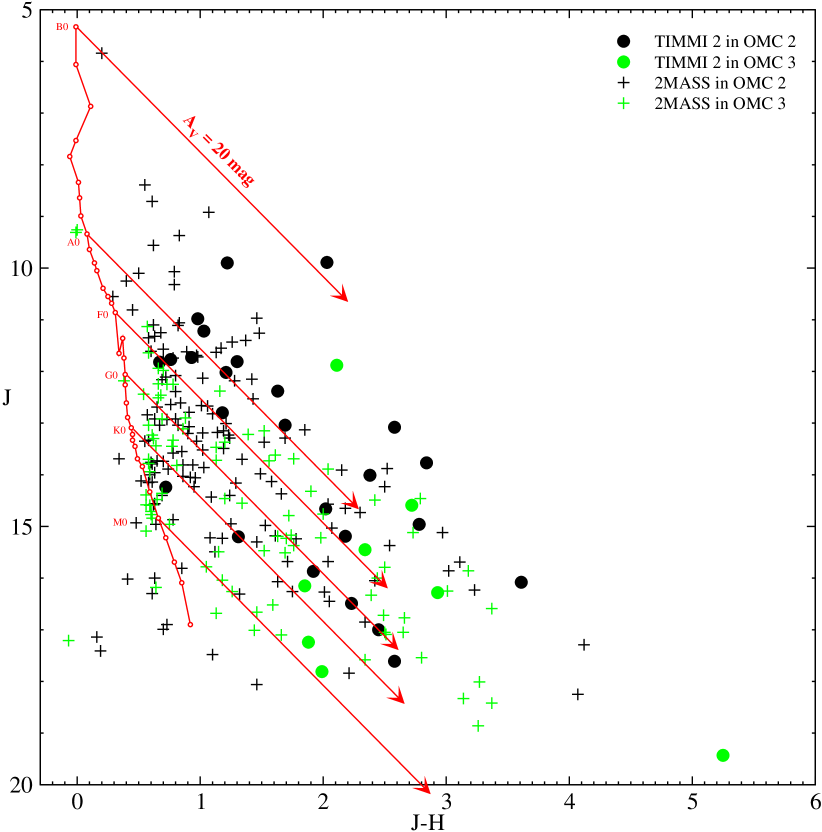
4.2 The vs. colour–magnitude diagram
Fig. 6 shows the vs. colour–magnitude diagram of 260 of the 264 sources excluding the 4 objects populating the area of giant stars in Fig. 3; the symbols are the same as in Fig. 3. The vertical curve represents the location of MS stars from spectral types B0 to M4 (Schmidt-Kaler sk (1982); Ducati et al. ducati (2001)), corrected for a foreground extinction of mag and a distance of 450 pc; the arrows correspond to reddening vectors of mag. While a few objects experience an extinction of up to mag, most of them have without any obvious distinction between OMC 2 and 3, as visible from Fig. 5. Within the errors, all colours except and seem to be equally populated between OMC 2 and 3 with a slight trend to a stronger reddening in OMC 3. However, we do not think that these outliers justify the interpretation of a strong indication for OMC 3 sources to have redder colours than OMC 2 sources.
As witnessed from the colour–colour diagram in Fig. 3, a number of sources exhibits strong IR-excesses. Assuming that this effect mainly dominates the colours, Fig. 6 should minimise the influence of the excesses and thus yield reliable results.
All sources show a wide spread in magnitude and colour. The truncation at mag is due to the detection limit of the 2MASS observations. Likewise, the photometric errors increase with fainter magnitudes. It is clear that the assignation of spectral types and intrinsic extinction from a colour–magnitude diagram assumes that there are neither foreground nor pre-main sequence stars; both would simulate earlier spectral types. Background stars – in contrast – appear as later types. Unfortunately, neither uncertainty can be removed from the present data set.
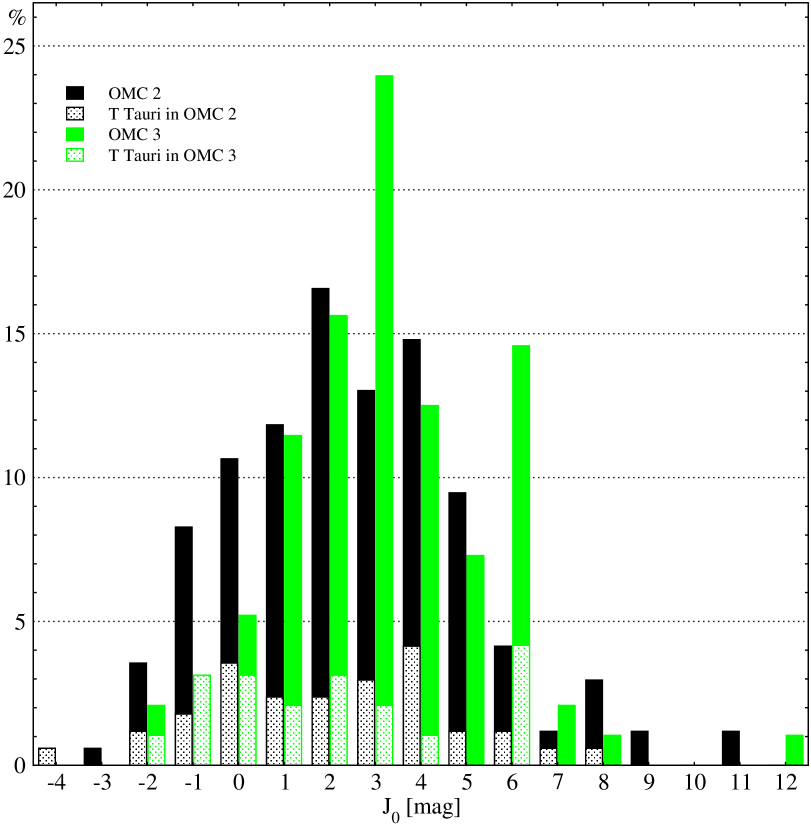
In order to minimise these uncertainties, we do not create a distribution of spectral types, but construct a luminosity function of all stars from Fig. 6 by de-reddening the objects and correct for a distance of 450 pc. This analysis should be fairly independent of any colour excess, however it assumes that the stars are on or close to the main sequence. In case of pre-main sequence objects, the luminosity will be overestimated. On the other hand, the commonly used luminosity function always simulates higher luminosities, because it may be influenced by both an excess caused by circumstellar emission and by pre-main sequence evolution; both effects may increase the observed luminosity considerably. Fig. 7 displays the fraction of objects in a certain luminosity interval relative to the total number of 2MASS sources in OMC 2 and 3, respectively. The populations in both regions are distributed across a luminosity range of with a maximum between . The decrease of sources beyond this maximum is certainly due to sensitivity. Nevertheless, there seems to be a systematic shift between the two regions in the sense that OMC 3 contains sources of lower luminosity. Neglecting the pre-main sequence objects from the T Tauri region (dotted), the difference becomes even more pronounced: the fraction of high luminosity, early type stars is significantly higher in OMC 2. Taking into account that OMC 1 – the most Southern region of the Orion A complex – has a rich abundance of massive stars, it seems that there is a decrease of stellar masses along the filament when going from South to North.
5 Discussion
In the following we discuss some particular sources of interest either because of their morphology, multiplicity or their detection at other wavelengths as well as the global properties of the association.
5.1 Individual sources
5.1.1 OMC 3 SIMBA
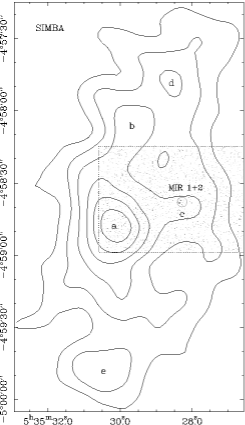
The new, North-Eastern complex (OMC 3 SIMBA) has also been observed by Lis et al. (lis (1998)) and Johnstone & Bally (johnstone (1999)). Molecular line measurements (source 2 of Tatematsu et al. tatematsu (1993)) allowed to determine its gas mass to 140 . In order to determine the dust temperature, we compare this CO result with the total flux density at m of 3.4 Jy and adopt a mass absorption coefficient of 0.03 cm2 per gram of dust. The resulting dust temperature is then 11 K suggesting that OMC 3 SIMBA is a fairly cold region; this picture is corroborated by the fact that the complex shows up in absorption in the MSX images (see Fig. 1).
| R.A. (J2000) | Dec. (J2000) | [mJy/beam] | |
|---|---|---|---|
| a | 570 | ||
| b | 330 | ||
| c | 290 | ||
| d | 290 | ||
| e | 270 |
As marked in Fig. 8, OMC 3 SIMBA contains at least five condensations, labelled a – e (see also Table 4). The m map of Lis et al. (lis (1998)) only shows the brightest component while the more sensitive SCUBA maps of Johnstone & Bally (johnstone (1999)) resolve the structure, too. Unfortunately, the authors did not elaborate on single sources in their paper, but rather concentrated on the general structure of the filament. Assuming that the total m flux density of 15 Jy originates from component “a”, and taking the peak intensity at m of 570 mJy/beam, we obtain a sub-millimetre luminosity of 0.3 . The spectral slope appears to be flat with . Using the above derived dust temperature of 11 K we derive a gas mass of 24 . However, it is likely that much of the underlying extended emission contributes to the peak flux which overestimates the flux density of the compact component “a”. Fitting e.g. a 2-dimensional Gaussian with an axis ratio of to component ”a” we derive a peak intensity of 375 mJy/beam and a total flux of 540 mJy.
As far as we can judge from the astrometric accuracy, there is a mid-infrared binary source (MIR 1/2) that coincides with component “c”. The two objects are of equal strength at m; their angular separation is 12, and the position angle is 30∘, measured clockwise from North. Using the combined NIR colours from 2MASS, this binary system is compatible with spectral type B.
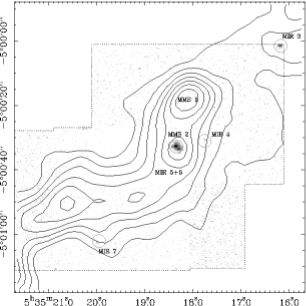
5.1.2 OMC 3 MMS 2
The millimetre source OMC 3 MMS 2 contains another MIR binary system (MIR 5/6) as revealed by our TIMMI 2 imaging (see Fig. 9). The projected spatial separation of the components is 13 or 570 AU with a position angle of . Both components of this binary system are surrounded by extended emission at m. Subtracting the stellar point sources, the residual emission suggests the presence of two separate circumstellar discs. Tsujimoto et al. (tsujimoto02 (2002)) resolved this binary with photometry. They find a colour excess for both sources corroborating the presence of circumstellar material. We will propose high-resolution millimetre interferometry follow-up observations in order to assess the actual distribution of the surrounding material.
By applying Gaussians fits to the TIMMI 2 sources, we obtain similar ellipticities for both which would correspond to an inclination angle of relative to the plane of the sky. The combined NIR colours classify this system as K – the only late type binary system found in our sample – with the largest excess of . Analysing the two single YSOs individually, Tsujimoto et al. (tsujimoto02 (2002)) find similar excess values for both. The colours from this study point to spectral types of A or B. From the spectral index , we conclude that both components are of Class I.
MMS 2 coincides with the X-ray source 8 (Tsuboi et al. tsuboi01 (2001)) while MIR 5 is obviously identical to the X-ray source 8c. The X-ray spectrum also shows evidence for two different sources, one of which has a soft the other one a hard spectrum. Tsuboi et al. (tsuboi01 (2001)) interpret sources with soft X-ray emission as T Tauri stars whereas hard X-ray emission is characteristic for outflows and/or jets. Williams et al. (williams (2003)) found a very long CO outflow associated with MMS 2.
Another MIR source (MIR 7) cannot be related to any of the millimetre clumps in that region but it coincides with the X-ray source 12 of Tsuboi et al. (tsuboi01 (2001)). Its colours classify the star as T Tauri which is compatible with its location far above the MS in the vs. colour–magnitude diagram. The spectral index is compatible with Class I.
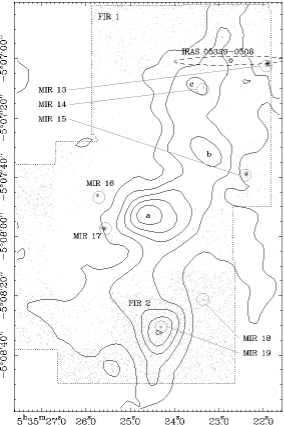
5.1.3 OMC 2 FIR 1–2
The FIR 1–2 complex harbours seven MIR sources, two of which (MIR 14 and 19) are embedded in distinct m condensations. MIR 14 has the strongest excess in OMC 2 with a of mag and an of 3.2; from its spectral index it is classified as Class II. MIR 19 was not detected by 2MASS.
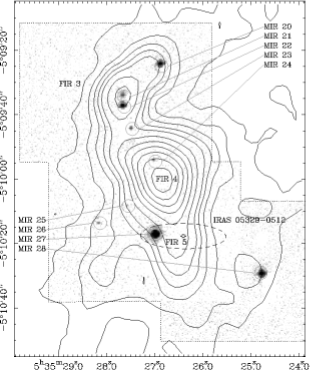
5.1.4 OMC 2 FIR 3–5
Within the FIR 3–5 complex we could detect nine MIR sources (MIR 20–28) of which five are associated more or less with millimetre emission (see Fig. 11). MIR 20 lies within an unresolved North-Western extension of FIR 3; its colours display an excess of while its spectral index points towards Class I.
FIR 3 contains a binary source (MIR 21/22) with a projected distance of about 1400 AU. It was originally discovered as IRS 4 by Gatley et al. (gatley (1974)) and does not display any significant NIR excess. Its spectral index puts it among the Class II objects although this classification might be contaminated by the high visual extinction of mag.
FIR 4 is in close neighbourhood to MIR 24 which is a Class I source with a tiny excess.
FIR 5 is associated with an IRAS source and close to MIR 27. Its spectral index suggests Class I; this is corroborated by its colours that imply a small excess of .
MIR 28 is a deeply embedded source with a excess of about 0.5. It is located in a region of enhanced millimetre emission which, however, has no separate nomenclature (see Fig. 11); it is also of Class I.
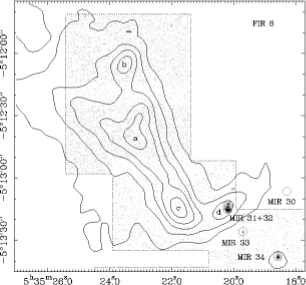
5.1.5 OMC 2 FIR 6
Fig. 12 displays FIR 6 with its four millimetre clumps a – d. Only condensation d contains a binary MIR source (MIR 31/32) of which both components are of Class II; their projected distance is 1100 AU. Another Class II source (MIR 34) coincides with a faint millimetre clump without nomenclature in the very South-Western part of Fig. 12.
5.1.6 OMC 2 MIR 35–45
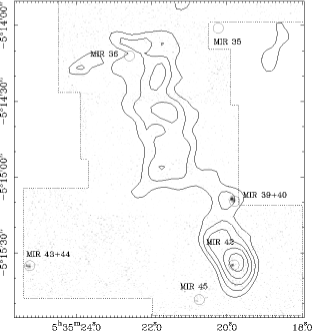
The new Southern extension of the millimetre map by Chini et al. (chini (1997)) (see Fig. 2) is enlarged in Fig. 13; it does not have any nomenclatures. There is a rather strong millimetre peak in the very South which coincides with the Class I source MIR 42. Another fainter millimetre clump contains the binary source MIR 39/40 with a projected separation of 380 AU. A similar close binary (MIR 43/44) of Class II and a separation of 420 AU lies far off the millimetre emission ridge and at the Eastern edge of Fig. 13.
5.2 Global properties of the region
Here we summarise the major properties of the extended dust emission and the stellar association in OMC 2/3 as they emerge from the present study. Our new millimetre observations with SIMBA plus the Southern extension of our imaging at IRAM reveals faint extended emission filaments and enlarges the number of bona-fide dust condensations to 28. A comparison between the extended MIR emission as obtained from the MSX survey and the millimetre emission shows that the dust emission filaments seen by SIMBA in the Northern (OMC 3) region appear as absorbing infrared dark filaments at the MSX wavebands, indicating the presence of cool and dense dust. Using the method described by Siebenmorgen & Krügel (sieben (2000)), we find optical depths at m that correspond to visual extinctions of up to 200 mag in the densest regions of OMC 3. However, the locations of the largest optical depths are not necessarily correlated with the strength of the millimetre emission. In numerous cases, they lie well away from the millimetre peaks. In contrast to that, we find that millimetre emission regions farther to the South like e.g. OMC 1, are dominated by the radiation at MIR wavelengths, suggesting considerably higher dust temperatures and lower densities. Free-free emission might also contribute to the mm detections that are located within the H ii regions of the Orion nebula (OMC 1).
Our MIR survey along the dust filaments of OMC 2/3 has revealed 45 sources. Twelve of them belong to binary systems with projected separations between 380 and 1400 AU. These sources can also be identified in the 2MASS survey where they are, however, unresolved. Their combined NIR colours indicate that five systems consist of early spectral types (probably B) while one seems to have later type stars (K). Interestingly, all binaries are associated with millimetre emission which probably arises from circumstellar discs. As mentioned above, in the case of MIR 5/6 the discs are to be seen directly at m. In OMC 2, the associated millimetre emission decreases from North (676 mJy) to South (48 mJy) maybe suggesting a proceeding disruption of circumstellar discs when approaching the adjacent Orion nebula.
Concerning the evolutionary stages of the objects there is no quantitative relation between the strength of the millimetre emission and the evolutionary stage of the objects as derived from the spectral index between and . At most there is a slight statistical bias in the sense that two thirds of the Class I sources are associated with millimetre clumps while only one third of the Class II sources do show significant millimetre emission. The distribution of luminosities shows that the fraction of high luminosity early type stars is significantly higher in OMC 2 compared to OMC 3. On an even larger scale, the luminosities and thus the masses of stars in Orion A seem to decrease from South (OMC 1) to North (OMC 3).
Acknowledgements.
We whish to thank the TIMMI 2 team and the telescope team of the ESO 3.6 m for their excellent support during this first observing run with the new instrument. It is a pleasure for R.C. to thank N. Ageorges for her help and assistance with the observations and R. Siebenmorgen for helpful discussions concerning the calibration. We thank H. Zinnecker for his valuable ideas. Likewise, we want to thank the referee E. Bica for his helpful remarks. This publication made use of data products from the Two Micron All Sky Survey, which is a joint project of the University of Massachusetts and the Infrared Processing and Analysis Center/California Institute of Technology, funded by the National Aeronautics and Space Administration and the National Science Foundation. This research made use of data products from the Midcourse Space Experiment. Processing of the data was funded by the Ballistic Missile Defense Organization with additional support from NASA Office of Space Science. This research has also made use of the NASA/IPAC Infrared Science Archive, which is operated by the Jet Propulsion Laboratory, California Institute of Technology, under contract with the National Aeronautics and Space Administration.References
- (1) Ali, B., & DePoy, D. L. 1995, AJ, 109, 709 (AD)
- (2) André, P., Ward-Thompson, D., & Barsony, M., 1993, ApJ, 406, 122
- (3) Bally, J., Langer, W. D., Stark, A. A., & Wilson, R. W. 1987, ApJ, 312, L45
- (4) Carpenter, J. M., Hillenbrand, L. A., & Skrutskie, M. F. 2001, AJ, 121, 3160 (CHS)
- (5) Castets, A., & Langer, W. D., 1995, A&A, 294, 835
- (6) Chini, R., Reipurth, B., Ward-Thompson, D., Bally, J., Nyman, L.-Å, Sievers, A., & Billawala, Y. 1997, ApJ, 474, L135
- (7) Dietzsch, E., & Reimann, H. G. 1998, SPIE, 2482, 151
- (8) Ducati, J. R., Bevilacqua, C. M., Rembold, S. B., & Ribeiro, D. 2001, ApJ, 588, 309
- (9) Gatley, I., Becklin, E. E., Mattews, K., Neugebauer, G., Penston, M. V., & Scoville, N. 1974, ApJ, 191, L121
- (10) Hillenbrand, L. A., Strom, S. E., Calvet, N., Merrill, K. M., Gatley, I., Makidon, R. B., Meyer, M. R., & Skrutskie, M. F. 1998, AJ, 116, 1816
- (11) Johnson, J. J., Gehrz, R. D., Jones, T. J., Hackwell, J. A., & Grasdalen, G. L., 1990, AJ, 100, 518
- (12) Johnstone, D., & Bally, J. 1999, ApJ, 510, L29
- (13) Jones, T. J., Mergen, J., Odewahn, S., Gehrz, R. D., Gatley, I., Merrill, K. M., Probst, R., & Woodward, C. E. 1994, AJ, 107, 2120
- (14) Kutner, M. L., Tucker, K. D., Chin, G., & Thaddeus, P. 1977, ApJ, 215, 521
- (15) Lis, D. C., Serabyn, E., Keene, J., Dowell, C. D., Benford, D. J., Phillips, T. G., Hunter, T. R., & Wang, N. 1998, ApJ, 509, 299
- (16) McCaughrean, M. J., & O’Dell, C. R. 1996, AJ, 111, 1977
- (17) Meyer, M. R., Calvet, N., & Hillenbrand, L. 1997, AJ, 114, 288
- (18) Mezger, P. G., Wink, J. E., & Zylka, R. 1990, A&A, 228, 95
- (19) Nyman, L.-Å., Lerner, M., Nielbock, M., Anciaux, M., Brooks, K., Chini, R., Albrecht, M., Lemke, R., Kreysa, E., Zylka, R., Johansson, L. E. B., Bronfman, L., Kontinen, S., Linz, H., & Stecklum, B. 2001, Msngr, 106, 40
- (20) O’Dell, C. R., Wen, Z., & Hu, X. 1993, ApJ, 410, 696
- (21) Rayner, J., McLean, I., McCaughrean, M., & Aspin, C. 1989, MNRAS, 241, 469
- (22) Reimann, H. G., Weinert, U., & Wagner, S. 1998, SPIE, 3354, 865
- (23) Reipurth, B., Rodríguez, L. F., & Chini, R. 1999, A&A, 352, L83
- (24) Schmidt-Kaler, T. 1982, in Landolt-Börnstein, eds. Schaifers & Voigt, Vol. VI/2b, Chpt. 4.1.2, 15
- (25) SEST operating manual 2002, “The SEST Handbook”, Version 4.3, Chpts. 6 and 8
- (26) Siebenmorgen, R., & Krügel 2000, A&A, 364, 625
- (27) Tatematsu, K., Umemoto, T., Kameya, O., Hirano, N., Hasegawa, T., Hayashi, M., Iwata, T., Kaifu, N., Mikami, H., Murata, Y., Nakano, M., Nakano, T., Ohashi, N., Sunada, K., Takaba, H., & Yamamoto, S. 1993, ApJ, 404, 643
- (28) Tsuboi, Y., Koyama, K., Hamaguchi, K., Tatematsu, K., Sekimoto, Y., Bally, J., & Reipurth, B. 2001, ApJ, 554, 734
- (29) Tsujimoto, M., Koama, K., Tsuboi, Y., Chartas, G., Goto, M., Kobayashi, N., Terada, H., & Tokunaga, A.T. 2002, ApJ, 573, 270
- (30) Yu, K. C., Bally, J., & Devine, D. 1997, ApJ, 485, L45
- (31) Wainscoat, R. J., & Cowie, L. L. 1992, AJ, 103, 332
- (32) Williams, J. P., Plambeck, R. L., & Heyer, M. H. 2003, astro-ph/0303443, ApJ preprint doi: 10.1086/375396