Toward a self consistent model of the ionized absorber in NGC 3783
Abstract
We present a detailed model for the ionized absorbing gas evident in the 900 ksec Chandra HETGS spectrum of NGC 3783. The analysis was carried out with PHASE, a new tool designed to model X-ray and UV absorption features in ionized plasmas. The 0.5-10 keV intrinsic continuum of the source is well represented by a single power law () and a soft black-body component (kT keV). The spectrum contains over 100 features, which are well fit by PHASE with just six free parameters. The model consists of a simple two phase absorber with difference of in the ionization parameter and difference of in the column density of the phases. The two absorption components turned out to be in pressure equilibrium, and are consistent with a single outflow ( km s-1) and a single turbulent velocity (300 km s-1), and with solar elemental abundances. The main features of the low ionization phase are an Fe M-shell unresolved transition array (UTA) and the O vii lines. The O vii features, usually identified with the O viii and a warm absorber, are instead produced in a cooler medium also producing O vi lines. The UTA sets tight constraints on the ionization degree of the absorbers, making the model more reliable. The high ionization phase is required by the O viii and the Fe L-shell lines, and there is evidence for an even more ionized component in the spectrum. A continuous range of ionization parameters is disfavored by the fits, particularly to the UTA. Our model indicates a severe blending of the absorption and emission lines, as well as strong saturation of the most intense O absorption lines. This is in agreement with the O vii () and O viii () absorption edges required to fit the spectrum. The low ionization phase can be decomposed into three subcomponents, based on the outflow velocity, FWHM, and H column densities found for three out of the four UV absorbers detected in NGC 3783. However, the ionization parameters are systematically smaller in our model than derived from UV data, indicating a lower degree of ionization. Finally, our model predicts a Ca xvi line for the feature observed at around 21.6 Å (a feature formerly identified as O vii), constraining the contribution from a zero redshift absorber.
1 Introduction
Quasars and Active Galactic Nuclei (AGNs) display a rich and confusing array of atomic emission and absorption features throughout the infrared, optical, ultraviolet and soft X-ray bands. Does this profusion of features reflect an inherent complexity or even randomness within AGNs? Or is there an underlying order that is masked by the overabundance of detail? The case has been made on both sides (for complexity: Baldwin et al. 1996; Korista et al. 1996; Krolik & Kriss 2001; for underlying order: Mathur, Elvis & Wilkes 1995; Elvis 2000; Arav et al. 2003).
One case has been intensively pursued lately, due to the improvement in the quality of UV and X-ray spectra from STIS, FUSE, and the grating spectrometers on Chandra (HETGS, LETGS) and XMM-Newton (RGS): the highly ionized (or ‘warm’) absorbers that appear in about half of all UV and X-ray spectra of AGNs. Both UV and X-ray absorption lines show moderate velocity (1000 km s-1) blueshifts, implying outflows. The mass loss rate from these outflows can be a substantial fraction of the accretion rate needed to power the AGN continuum, and so these ‘quasar winds’ are likely to be dynamically important to AGNs (Mathur, Elvis & Wilkes 1995). Understanding the physical state or states of this gas, and hence the location and dynamics of AGN winds would be a valuable advance in the understanding of quasars.
The UV and X-ray absorbers must be closely related: exactly the same 50% of AGNs show both (Mathur, Elvis, & Wilkes, 1995; Mathur, Wilkes, & Elvis, 1998; Crenshaw et al., 1999; Monier et al., 2001), and each can be used to predict the presence of the other. However, the absorbers show complex, multi-component and time-variable structures in UV spectra, and it is not straightforward to connect these to the X-ray lines, given the order of magnitude lower spectral resolution in the X-ray band. Moreover column densities derived from the UV lines are strongly affected by scattered light into our beam or by partial covering of the continuum source (Arav et al. 2003). While the UV absorbers are dominated by O vi lines, with C iv and N v also appearing, the X-ray absorbers are dominated by O vii and O viii, with many other lines of similar ionization now being seen. Despite being dubbed ‘warm absorbers’ the absorbers respond to changes in the ionizing continuum and so are at least in part photoionized (Nicastro, Fiore, & Matt, 1999). Hence we shall use the less loaded term ‘ionized absorbers’.
Here we take the best existing high resolution X-ray spectrum of an ionized absorber in an AGN, a 900 ksec observation of NGC 3783 with the Chandra HETGS, and analyze the absorption features self-consistently with a new code (‘PHASE’, Krongold et al. 2003, in preparation). We find a strikingly simple solution: well over 100 absorption features can be fitted by a two component solution having only six free parameters. Moreover, allowing for the lower X-ray resolution, the lower ionization component is consistent with two UV absorbers. There is also evidence in the X-rays for a third, high velocity and low column density, UV component in four lines. We discuss in detail why we are able to obtain this simple solution, in contrast to earlier studies of the same object and spectrum that led to more complex answers. The two component solution is strongly suggestive of a two-phase medium in pressure balance, with further likely implications.
1.1 High Resolution X-ray Spectra of NGC 3783
NGC 3783 is an extensively studied bright Seyfert galaxy, at a redshift 0.00976 (2926 km s-1, de Vaucouleurs et al. 1991). NGC 3783 has been the subject of extensive monitoring by the High Energy Transmission Grating Spectrometer (HETGS, Canizares et al. 2000) on board the Chandra X-ray Observatory, with a total exposure of 900 ksec (reported in Kaspi et al. 2002). The resulting spectrum covers the 0.5-10 keV energy range, and is the best obtained so far for an ionized absorber in a Seyfert galaxy, with more than 2000 counts per resolution element at 7 Å. This spectrum showed the presence of more than one hundred absorption lines from a wide range of ionized species. A few weak emission lines, mainly from O and N, were also detected. The spectrum further revealed a wide absorption feature in the Å range. Kaspi et al. (2002) identified this feature as an unresolved transition array (UTA), arising from numerous Fe M-shell inner-shell transitions. The XMM-Newton RGS has also observed NGC 3783 (Blustin et al. 2002). This observation extends to longer wavelengths than the 900 ksec exposure from the HETGS. A complete review of the analyses carried out on these data will be presented in §5.5. To this date, self consistent modelling for the full 900 ksec Chandra high resolution spectrum has not been published.
NGC 3783 has also been studied in the UV band with FUSE and HST-STIS. These observations have revealed intrinsic absorption by Ly, O vi, and N v in this region of the spectrum (Kraemer, Crenshaw & Gabel, 2001, and references therein). The high spectral resolution and signal to noise ratio of both data sets allowed the identification of four absorption systems moving toward us, with outflow velocities of 1320, 1027, 724, and 548 km s-1 (Gabel et al. 2003).
In this paper, we present the first self-consistent model for the 900 ksec X-ray absorption spectrum of NGC 3783. In the following section (§2) we describe the data reduction. The modelling was carried out with “PHASE”, a newly developed code based on CLOUDY (v. 90.04, Ferland 1997) and the Astrophysical Plasma Emission Database (APED v. 1.3.0, Smith et al. 2001), and designed to reproduce absorption features produced by ionized plasmas. This code is briefly explained in section §3. In §4 we present the results obtained for the spectral fitting and in §5 and §6 we discuss the reliability of the model and its implications.
2 Data Reduction

NGC 3783 was observed six times using the HETGS on board the Chandra X-ray Observatory, with the Advanced CCD Imaging Spectrometer (ACIS). The first observation was carried out on January 2000 and had a duration of 56 ksec (reported in Kaspi et al. 2000). Between February and June of 2001, the following five observations were taken, each one with an exposure time of 170 ksec (reported in Kaspi et al. 2002). Figure 1 presents the light curve in the 2.5-4 keV ( 3.0-5.0 Å) range. We chose this range because it avoids the Fe K 6.4 keV complex and most absorption from bound-free transitions. Therefore, it can indicate changes from the central source. In agreement with Kaspi et al. (2002), we found variability at a level of about 50% between the fourth and fifth observations, and smaller in the rest of the cases. In this paper we present a model for the averaged spectrum of the six observations. We do not expect the level of variability to affect our main results. However, a detailed analysis on each observation, and the general effects of variability will be presented in the future.
We retrieved from the public Chandra data archive111http://asc.harvard.edu/cda the primary and secondary data products for these six observations and reprocessed their event files with the Chandra Interactive Analysis of Observations (CIAO222http://asc.harvard.edu/ciao) software (Version 2.3). Following the on-line data analysis “threads”, provided by the Chandra X-ray Center (CXC333http://asc.harvard.edu/ciao/documents_threads.html), we extracted from the CALDB444http://cxc.harvard.edu/caldb (Graessle et al., 1996) the source spectra and the corresponding 1st-order Ancillary Response Files (ARFs) and Redistribution Matrices (RMFs).
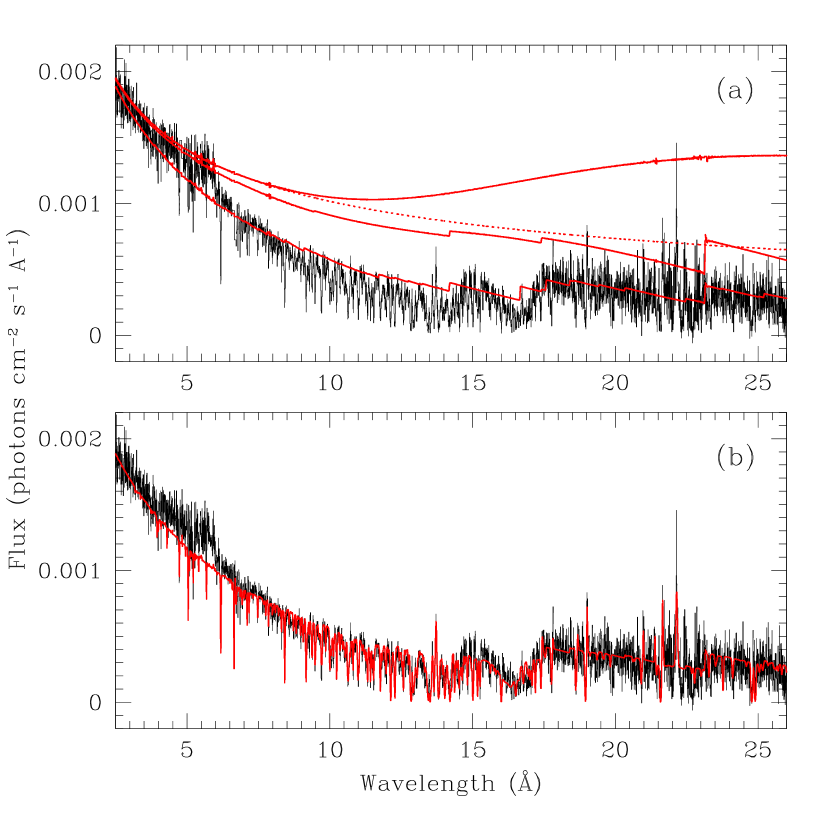
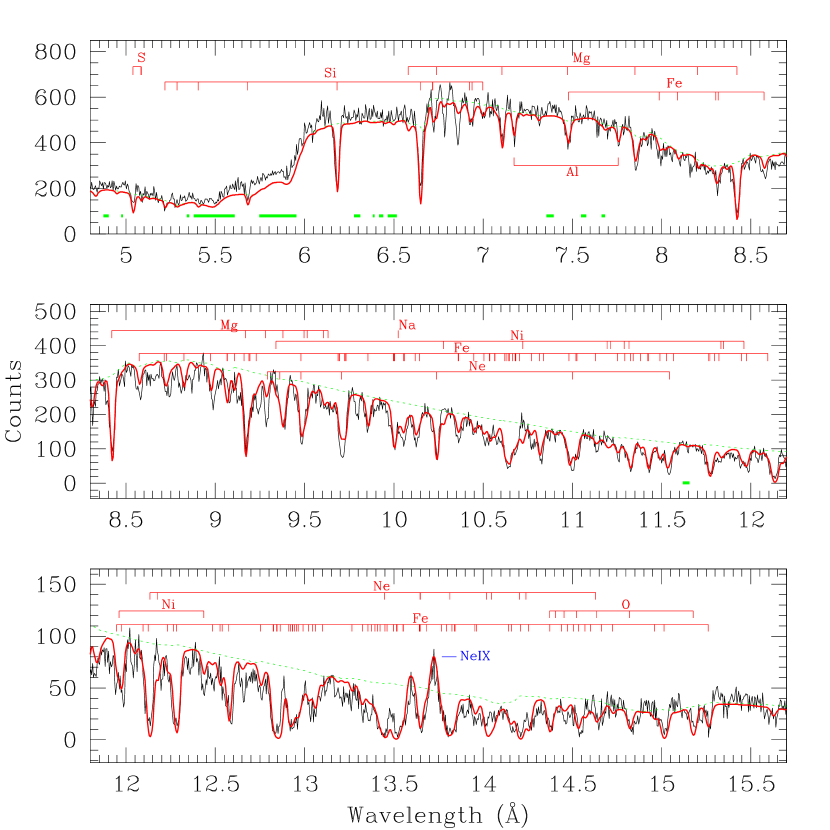
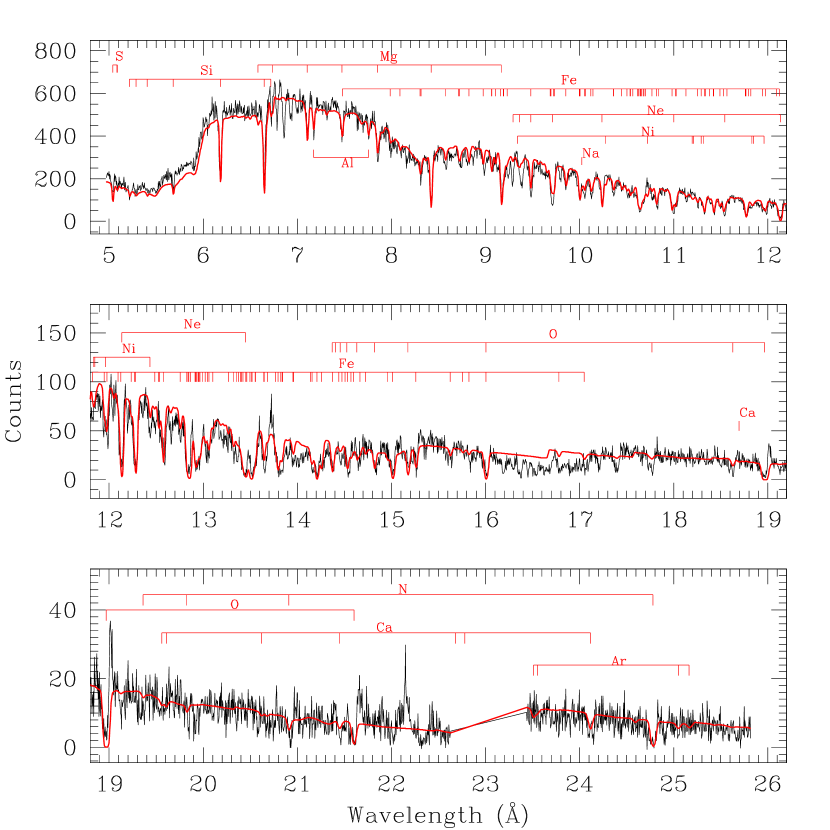
The HETGS (Canizares et al. 2000) produces spectra from two grating assemblies, the high-energy (HEG) and medium energy (MEG) gratings. All the spectra described below and throughout the paper correspond to the MEG. We combined the -1st and +1st orders for each exposure. To further increase the signal to noise ratio of the data, we coadded the spectra and averaged the ARFs, weighting them according to their respective exposure times. The resulting spectrum has a net exposure of 888.7 ksec. The signal to noise ratio per resolution element (0.02 Å for the MEG) varies from to in the 6-25Å ( 0.5-2.0 keV) range. The fluxed spectrum is presented in Figure 2a, and the empirical spectrum is presented in Figure 3.
3 Modelling: PHASE
With the aim of modelling in a self-consistent way all the absorption features observed in the spectra of UV and X-ray sources, we have developed PHASE (PHotoionized Absorption Spectral Engine), a code that calculates absorption due to an ionized plasma based on ATOMDB555http://cxc.harvard.edu/atomdb (v.1.3.0, Smith et al. 2001) and CLOUDY (v. 90.04, Ferland 1997). The calculations assume a simple geometry that consists of a central source emitting an ionizing continuum with clouds of gas intercepting our line of sight. The ionization balance is calculated using CLOUDY with an SED chosen to be consistent with the intrinsic Spectral Energy Distribution (SED) of the source. The parameters of the code are (1) the ionization parameter (defined over the entire Lyman continuum, as with the number of H ionizing photons per second, the distance to the source, the H density, and the speed of light.), (2) the equivalent hydrogen column density, (3) the outflow velocity, and (4) the internal micro-turbulent velocity of each one of the absorbers, as well as (5) the intrinsic SED of the source. A sixth parameter, the electron temperature, can be included, forcing the temperature to be different from photoionization equilibrium. PHASE can thus handle hybrid states, e.g. gas photoionized by a strong radiative source but where another external mechanism (for instance, shock heating) keep the electron temperature at a higher value than the one expected only through photoionization equilibrium. The micro-turbulent velocity and the thermal velocity are added in quadrature to compute the total Doppler broadening parameter of the gas: .
The code proceeds as follows: (1) The absorption produced by each transition of the different ion species is calculated, using the formula
where is the absorption coefficient at the frequency , is the linear size of the cloud, is the column density of the given ion (calculated through the ionization balance), is the electron mass, is the electron charge, is the speed of light, is the oscillator strength of the electron transition (from the lower to the upper level), and is the line profile (which is assumed to be a Voigt profile, Rybicki & Lightman, 1979, and calculated by convolving the natural broadening with the thermal and microturbulent Doppler broadening).
(2) Then the model calculates the continuum absorption produced by bound-free transitions.
(3) The contributions from different absorption lines and edges are added together to produce an absorption spectrum.
(4) This spectrum is finally shifted to the proper outflow velocity.
PHASE includes lines arising from the ground level. The line list was extracted from the Astrophysical Plasma Emission Database (APED v. 1.3.0, Smith et al. 2001). APED includes information up to the 5th principal quantum number for transitions arising from the 14 more abundant elements in the universe, namely H, He, C, N, O, Ne, Mg, Al, Si, S, Ar, Ca, Fe, and Ni (for a detailed list of the ions of each element included in APED visit the ATOMDB web page, http://cxc.harvard.edu/atomdb). To further increase the number of lines in our model, we added nearly 200 features involving principal quantum numbers n=5 to n=10 (levels not present in APED) from the “Atomic Data for Permitted Resonance Lines” (Verner, Verner, & Ferland, 1996) . This compilation includes lines connecting the ground level to excited levels via optically allowed transitions, i.e. transitions between levels of opposite parity with , , and , where is the orbital, the spin, and the total angular momentum quantum number. In order to include in our calculations the Fe M-shell inner transitions (which are responsible for the UTA), we used the abbreviated data set provided by Behar, Sako, & Kahn (2001), the best source of information for these transitions available in the literature. This abbreviated version of the data assumes that mean wavelengths and effective oscillator strengths can emulate the complex absorption produced by several lines of each ion. According to the authors, the approximation can successfully reproduce the general shape and EW of the feature. The only exception is for Fe x-xiii ions; in this case, if the ion column density lies in the range cm-2 and the turbulent velocity is km s-1, the approximation can overestimate the actual value of the EW by as much as 40%. We also included the most intense (oscillator strengths mÅ) inner shell (1-2) transitions from Ne, Mg, Al, Si, S, Ar, Ca, and Fe. These data were extracted from the list of Behar & Netzer (2002), and will be included in APED (v.2.0.0). A full explanation of the present code will be published in a forthcoming paper (Krongold et al., in preparation).
We performed spectral fitting of the NGC 3783 data using PHASE integrated into the Sherpa (Freeman et al. 2001) package in CIAO (Fruscione2002) as a table model.
4 Spectral Fitting
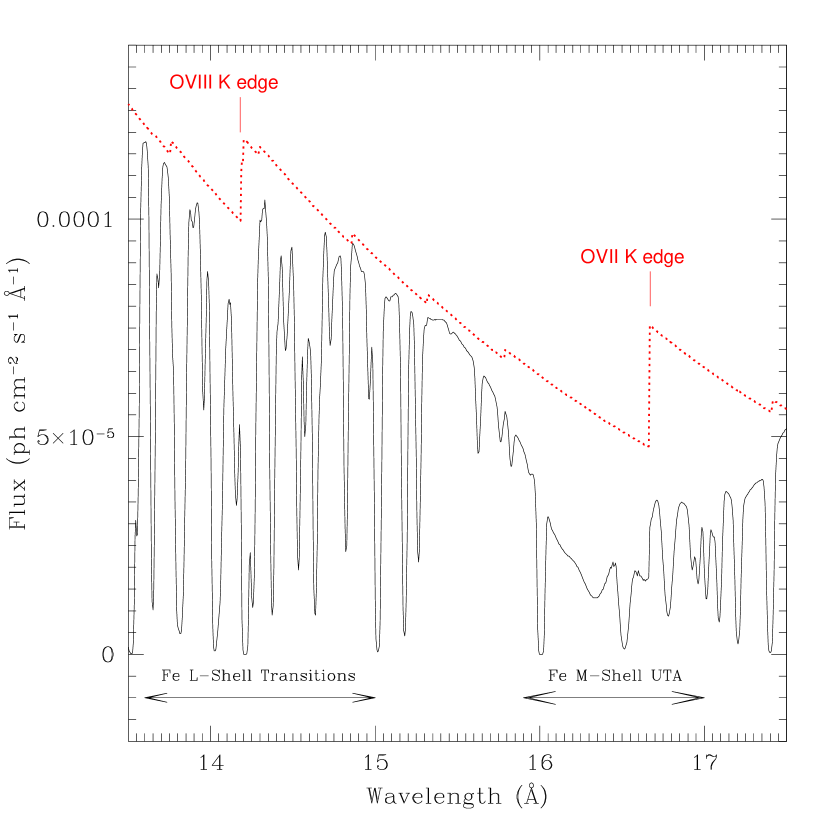
The key point of our modelling was to fit self-consistently the absorption lines and edges from all the ions of all the species at the same time, without any assumption about the absorption of individual ions. Therefore, we did not introduce any prior constraint on the column density or population fraction of any ion. As will be discussed in §5, many lines of different ions are blended, making the measurement of individual ion column densities unreliable in most cases. The determination of individual ion column densities through continuum bound-free absorption is unreliable also due to the contribution of so many different ions. Furthermore, even if the column densities produce edges, these might be hidden by absorption lines. Such a case is clearly exemplified in Figure 4 for the spectrum of NGC 3783: the O vii edge and the UTA at Å are completely blended, making very difficult to isolate the contribution of the former to the absorption. Our model is self-consistent in the sense that given the intrinsic SED of the source, and the column density and ionization parameter of the absorbing media, the ionization balance is fixed. By also including the broadening mechanisms of the line as well as the rules governing the ion transitions, in a self-consistent way, a final global solution consistent with all these processes, can be obtained. This procedure avoids the inconsistencies that may arise in the ionization structure of the gas, as well as the effects of neglecting saturation, that are present in analyses where only an ion by ion (or line by line) approach is used to fit the spectral features.
The intrinsic continuum and the gas absorption were fitted simultaneously. Therefore, we iterated many times to get the final X-ray SED. We further attenuated the continuum by an equivalent hydrogen column density of cm-2 (Murphy et al., 1996) to account for the Galactic absorption by cold gas in the direction to the source. In the calculations reported here, we have explored only photoionization equilibrium models, and we have assumed solar elemental abundances (Grevesse, Noels, & Sauval, 1993).
4.1 Continuum
To model the intrinsic continuum of the source, we first fitted a simple power law with varying photon index and amplitude. However, a single power law could not fit the data over the entire range. We found an excess of flux in the spectrum at energies keV. This excess could be accounted for with the inclusion of a black body component superimposed on the power law. Such a thermal component has been used in the past to describe the NGC 3783 continuum (e.g. De Rosa et al. 2002, and references therein).
To further check our results, we made an independent estimate of the continuum level using the wavelength bands where no line features are present, the “line-free spectral bands” (horizontal green ranges at the bottom of Fig. 3 panels). These bands were determined excluding the regions with lines in our model, plus the obvious features that our model missed
(see §5). The two continuum estimates were consistent with each other. Table 1 shows our results. Figure 2a presents the intrinsic continuum of the source, the continuum attenuated by Galactic absorption, and the observed continuum (i.e. the continuum further attenuated by the bound-free transitions from our model). As shown in this figure (and also in Fig. 3) there is an excess of flux in the observed continuum at around 5.5-6.5 Å. We attribute this excess to a calibration effect due to the rapid changes of the effective area between 1.7 and 2.3 keV, resulting from the Iridium M-edge. As can be inferred from the figure, a lower photon index would account for the difference, but would overpredict the continuum level at shorter wavelengths.
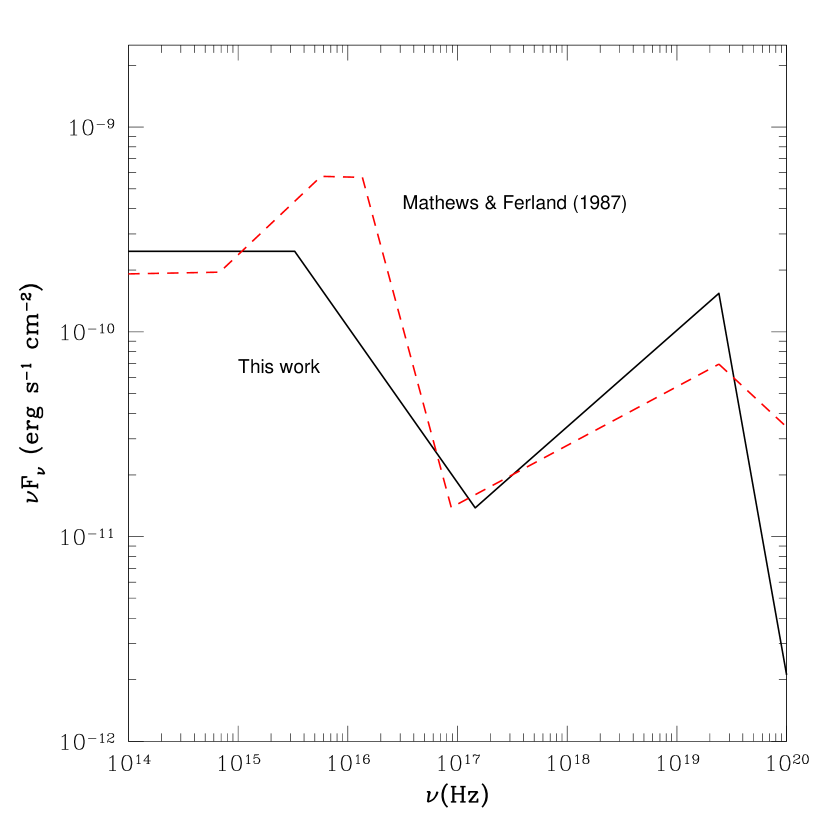
For simplicity, to calculate the ionization balance, we approximated the full SED as a power law with the following photon indices: below 13.6 eV, in the range 13.6 eV 0.6 keV, and above 0.6 keV (i.e. we matched the UV SED derived from UV studies, see below). We further restricted our SED including high and low energy cutoffs ( above 100 keV and below 0.1 eV). The SED is plotted in Figure 5. With the chosen continuum, between 0.6 keV and 0.1 eV, we assumed the same SED used in Kraemer, Crenshaw, & Gabel (2001) for their modelling of the UV spectrum of NGC 3783. Although this approximation appears reasonable, there are important uncertainties associated with it, due to the unobservable region in the UV-X-ray range associated with Galactic absorption and the lack of simultaneous observations in both bands. The shape of the SED in the UV and far UV does not affect the absorption in the X-ray range, as discussed by Kaspi et al. (2001) and Steenbrugge et al. (2003). However, the exact shape of the SED does affect the values predicted for the ionization parameter, as will be discussed in §5.4.
4.2 Emission Features
| Power Law | ||
|---|---|---|
| Photon Index () | NormalizationaaIn photons keV-1 cm-2 s-1 at 1 keV. | (cm-2) |
| 1.53 | 0.011 | |
| Thermal component | ||
| kT (keV) | NormalizationbbIn , where is the source luminosity in units of erg s-1 and is the distance to the source in units of 10 kpc. | |
| 0.10 | 0.00020 | |
Kaspi et al. (2002) identified several emission lines apparent in the 900 ksec spectrum. In our model, these emission lines partly blend with the absorption lines, such that the depths and EWs of both appear reduced when the absorption and emission components are added together (see Fig. 6). In its present stage, our code cannot yet model emission in a self-consistent way. To do so requires modelling the geometry and kinematics of the absorbing gas. Therefore, to account for the filling effect of the absorption lines, we fitted gaussian profiles to the 14 most prominent emission features in the spectrum, and added them to the model. To make the fitting as constrained as possible we used the same outflow velocities and the same FWHMs to model all the emission lines produced by the same ion. The emission lines fitted and their properties are listed in Table 2. We excluded the Fe K 6.4 keV complex.
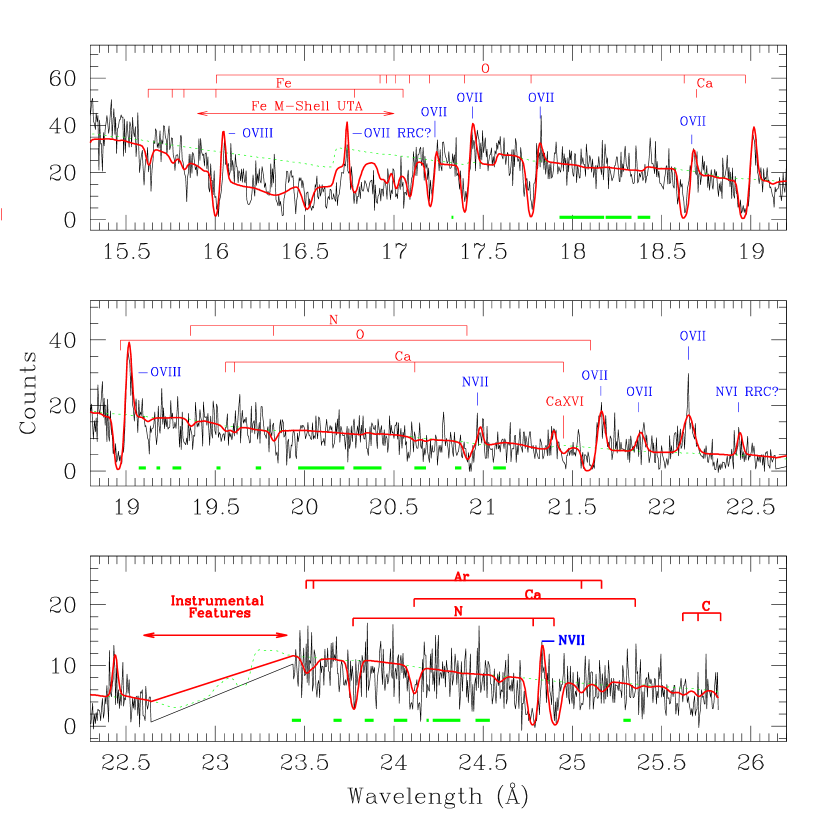
Two features in the spectrum have been tentatively identified as O vii and N vi radiative recombination continua (RRC), because of their wavelengths. By contrast to hot collisionally ionized plasmas where the RRCs are broad extended features, in photoionized plasmas the RRCs are narrow “linelike” features. The “width” of these features can be used, in principle, to estimate the electron temperature (Liedahl & Paerels, 1996). However, due to the heavy blending of these features with absorption components, a measurement of the temperature from the RRCs would be unreliable. To account for this effect, a self-consistent model for emission processes is also required.
Apart from these two features, all the emission lines have outflow velocities smaller than those of the absorption components, and are consistent with being at rest in the system frame (in accordance with Kaspi et al. 2002). This points to a symmetric distribution of the emitting gas. Using the O vii triplet plasma diagnostics by Porquet & Dubau (2000), an upper limit for the electron density in the O vii line formation region of n cm-3 can be imposed, consistent with the one obtained by Morales et al. (2003, in preparation, n cm-3).
| Ion | Rest Frame | FWHM | Outflow Vel. | EWa | |
|---|---|---|---|---|---|
| (Å) | (km s-1) | (km s-1) | (mÅ) | ||
| Neix | 13.699 | 406 | 267 | 15.3 | |
| Oviii | 16.006 | 542 | 102 | 25.3 | |
| RRC Ovii | 16.771 | 715 | 1370 | 16.2 | |
| Ovii | 17.200 | 632 | 35 | 7.3 | |
| Ovii | 17.396 | 632 | 35 | 30.3 | |
| Ovii | 17.768 | 632 | 35 | 34.3 | |
| Ovii | 18.627 | 632 | 35 | 25.8 | |
| Oviii | 18.969 | 542 | 102 | 79.0 | |
| Nvii | 20.910 | 370 | 198 | 23.7 | |
| Ovii | 21.602 | 632 | 35 | 115.1 | |
| Ovii | 21.807 | 632 | 35 | 60.0 | |
| Ovii | 22.101 | 632 | 35 | 144.9 | |
| RRC Nvi | 22.458 | 333 | 1030 | 49.8 | |
| Nvii | 24.781 | 370 | 198 | 43.2 | |
4.3 Absorption Features
4.3.1 Components outflowing at 750 km s-1
As was the case for previous studies, the spectrum of NGC 3783 could not be reproduced by a single absorbing component. Therefore, we included a second one with different ionization. Both components were consistent with an outflow velocity of 750 km s-1. Since the absorption lines in the spectrum are unresolved by the HETGS and many of them are blended, it was impossible to determine the turbulent velocity of the systems. Therefore, in order to fit the data, we set this velocity equal to 300 km s-1, the same value used in Kaspi et al. (2001). The temperature in each gas component was calculated from our models assuming photoionization equilibrium, and is K for the hotter component and K for the cooler one; therefore, the contribution of the thermal velocity to the Doppler velocity is rather small ( % for oxygen). Our results are listed in Table 3. The plot with the model is presented in Figure 3 (and also in Fig. 2b, where we present the model for the full spectral range plotted over the fluxed spectrum).
We find no evidence for cosmic dust or anomalous abundances in any of the absorbers. It is noteworthy that the outflow of both components is consistent with a single velocity. While kinematically indistinguishable and with column densities a factor 4 apart, our two components have dramatically different ionization parameters: the high ionization phase (HIP) has a value times larger than the low ionization phase (LIP). The HIP, presented in Figure 7, gives rise to the absorption by N vii, O viii, Ne ix-x, Mg x-xii, Al xii-xiii, Si xi-xiv, S xiii-xvi, Ar xii-xvii, Ca xiii-xviii, Fe xvii-xxii, and Ni xix-xxi. On the other hand, the LIP (presented in Fig. 8) produces absorption by C vi, N vi, O vii, Ne v-viii, Mg vii-ix, Si vii-ix, and the Fe M-shell inner transitions forming the UTA (Fe vii-xii). The most intense lines, as well as the unblended features, are listed in Table 4, where we show the contribution from the HIP and the LIP separately. All the EWs derived from our model for unblended lines agree with those measured from the data (see Fig. 9).
| Parameter | High-Ionization | Low-Ionization |
|---|---|---|
| Log Ua | 0.76 | -0.78 |
| Log NH (cm-2)a | 22.20 | 21.61 |
| VTurb (km s-1) | 300 | 300 |
| VOut (km s-1)a | 788 | 750 |
| T (K)b | ||
| Log T (K) | 5.98 | 4.41 |
| Log T/U (Pc) | 5.22 | 5.19 |
| Log d | 1.02 | 0.99 |

4.3.2 Component outflowing at 1345 km s-1
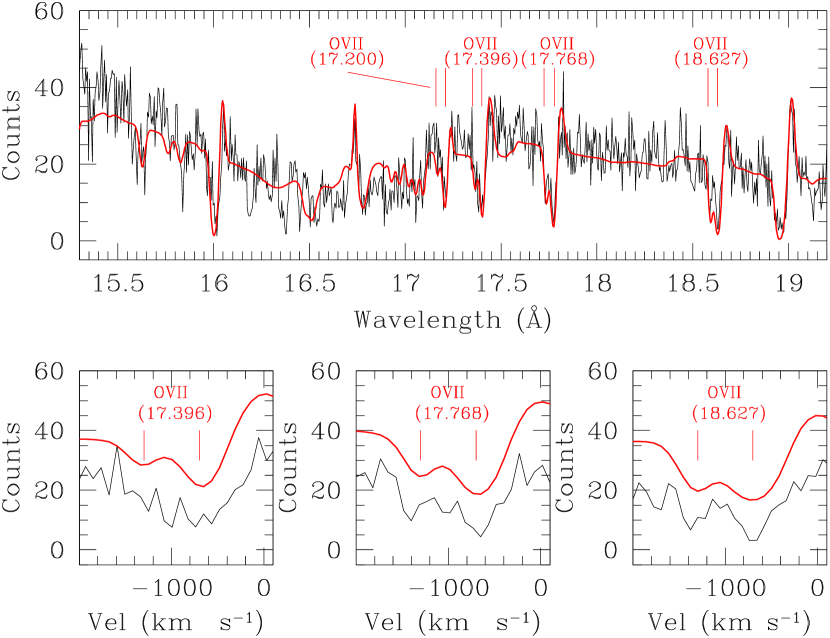
In the 900 ksec spectrum Kaspi et al. (2002) found evidence for two X-ray absorbers in the lines of O vii, but could not conclude the same in those of Ne x. We also see evidence for these O vii lines (lower panels of Fig. 10). As can be inferred from Table 4, while our model indicates that all the absorption produced by Ne x arises in the HIP, most of the O vii absorption originates in the LIP. Furthermore, no evidence of a second absorber in O viii is found, and this ion too is mainly produced by the HIP (Table 4). Therefore, the detection of these O vii features indicates the presence of a low ionization, high velocity component. According to our models (see §4.4 and Table 5) a component capable of reproducing the absorption lines in O vii but no absorption in O viii or Ne x at 1365 km s-1, would need a low ionization parameter, but also a low column density (log N 21) and therefore, would only produce observable absorption features by Ne vi-vii between 13.5 and 14 Å( transitions mainly), and N vi between 23.1 and 23.8 Å and at 24.9 Å( and transitions). Since the Ne vi-vii lines are weak and lie in a region dominated by the Fe L-shell transitions, they are undetectable. The N vi lines are also undetectable due to low signal to noise ratio and calibration uncertainties at long wavelengths. Therefore, the O vii lines are really the only features observable from this component. This component would also produce absorption by O vi, and an absorber at roughly this outflow velocity has been already clearly observed in the UV (see §4.4). This UV detection gives us greater confidence in the reality of the high velocity LIP absorber, which is otherwise of borderline significance in the X-ray data.
4.4 UV Absorbers
Kraemer, Crenshaw & Gabel (2001) and Gabel et al. (2003) have presented the UV spectrum of NGC 3783. Absorption lines due to Civ, Nv, and Ovi are clearly present in the HST and FUSE spectra, with each line showing four different components corresponding to four outflow velocities. One of these components (outflow 1027 km s-1) is too weak to be detected with X-ray instruments (see Fig. 11). However, the other three components are consistent with the outflow velocities of the X-ray LIP O vii absorbers (at 750 km s-1 and the 4 O vii lines at 1345 km s-1). Furthermore, the ionization degree of the LIP X-ray components can also produce UV features (in contrast with the HIP, which is almost transparent in the UV band due to its high ionization degree). Motivated by this, and with the aim of exploring the connection between UV and X-ray absorbers, we decided to model the X-ray data for comparison with the models by Kraemer et al. (2001).
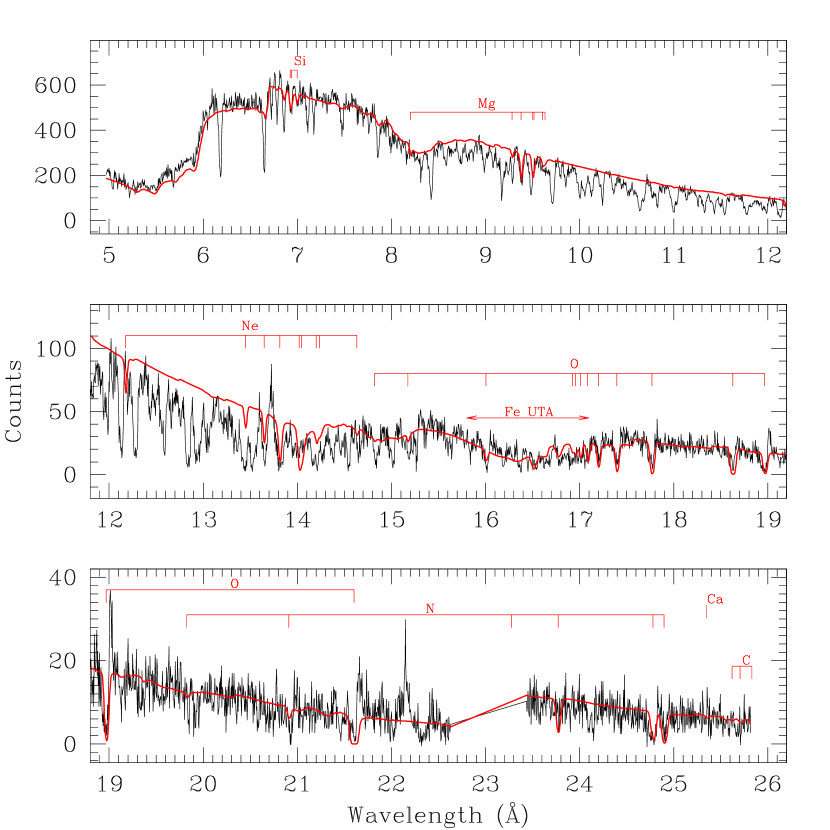
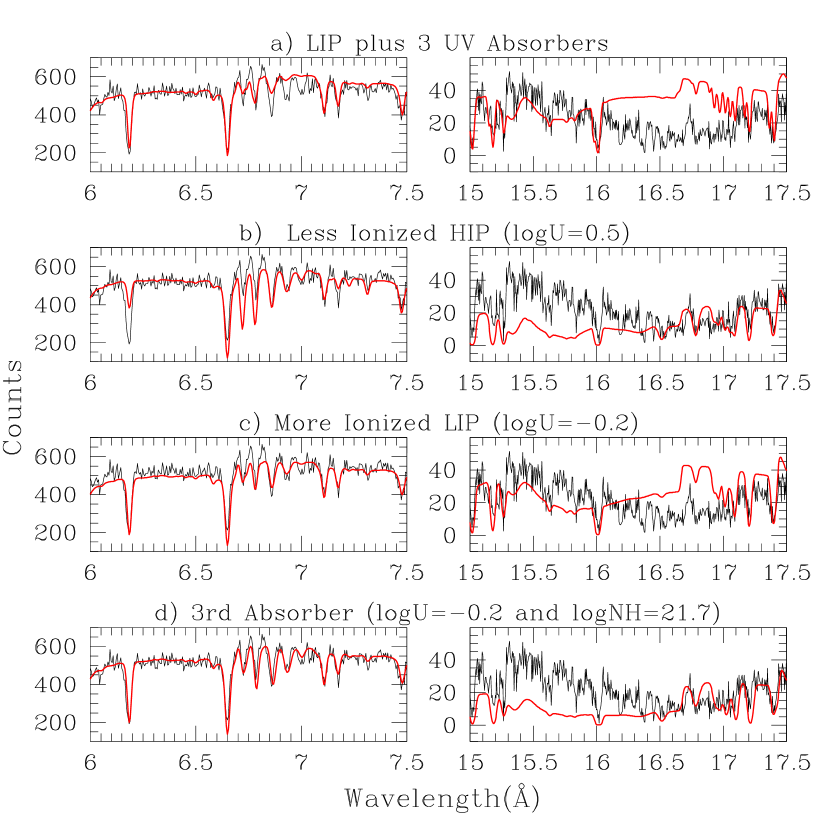
To begin with, we considered model parameters exactly as in Kraemer et al. (2001): the total equivalent column density NH, ionization parameter U, three different velocity components for each line, with FWHM and outflow velocity Vout as for the UV lines (see Table 5). We found that the predicted strengths of X-ray lines do not match the data (see Fig. 12a). Then we changed only one input parameter, the ionization parameter U. We fitted the X-ray spectrum, leaving U as a free parameter, but with all other parameters as given above. A good fit to the data was obtained, as shown in figure 10, for the 15.5 to 19.0 Å range (in other ranges, there is no significant difference with respect to the model presented in Figure 3, as discussed in §4.3.2). However, the best fit value of U is smaller by at least a factor of 3, than that found by Kraemer et al. for the UV spectrum (Table 5). In principle, this can be an effect of the different input continuum that we used, so we repeated the analysis by using exactly the same SED as in Kraemer et al. (i.e. with a value of ) above 0.6 keV and no high/low energy cutoffs). The resulting U still did not match the Kraemer et al. value. The degree of ionization found by Kraemer et al. is too high to fit the X-ray absorber. A naïve interpretation of these facts could be that the UV and X-ray absorbers are two different phenomena, independent of each other. This, however, is not true. As discussed below in §5, the high values of U inferred from the UV data alone, would produce strong absorption by the UTA in the region around 16 Å and this is not consistent with the observations. Figure 12a illustrates this point clearly.
The excellent level of agreement between the data and our new model with three different velocity components for each line (as in the UV) is noteworthy. This strongly indicates a common origin of UV and X-ray absorbers, as we have been suggesting for years (Mathur et al. 1994, 1995, 1997, 1998, 1999; Monier et al.
| Equivalent Width (mÅ) | ||||||
|---|---|---|---|---|---|---|
| Ion | Wavelength (Å) | HIP | LIP | Total | Measured | |
| Sixiv | 6.182 | 16.1 | 16.1 | 17.7 | ||
| Sixiii | 6.648 | 20.4 | 20.4 | 17.6 | ||
| Mgxii | 7.106 | 7.3 | 7.3 | 7.3 | ||
| Alxiii | 7.173 | 3.7 | 3.7 | 4.9 | ||
| Alxii | 7.757 | 3.8 | 3.8 | 3.4 | ||
| Fexxiii | 8.304 | 5.1 | 5.1 | 11.7c | ||
| Mgxii | 8.421 | 24.7 | 24.7 | 27.3 | ||
| Fexxii | 8.714 | 4.5 | 4.5 | 5.2 | ||
| Nex | 10.239 | 20.7 | 20.7 | 23.0c | ||
| Fexix | 10.816 | 18.2 | 18.2 | 18.6 | ||
| Fexxii | 11.770 | 28.4 | 28.4 | 41.0c | ||
| Nex | 12.134 | 45.4 | 45.4 | a | ||
| Fexxi | 12.284 | 39.7 | 39.7 | 47.4c | ||
| Fexx | 12.576 | 35.7 | 35.7 | 34.7 | ||
| Fexx | 12.754 | 9.2 | 9.2 | 12.3 | ||
| Fexx | 12.824 | 26.1 | 26.1 | a | ||
| Fexx | 12.846 | 38.9 | 38.9 | a | ||
| Fexx | 12.864 | 37.0 | 37.0 | a | ||
| Fexix | 13.423 | 26.1 | 26.1 | a | ||
| Neix | 13.447 | 31.5 | 11.0 | 42.6 | a | |
| Fexix | 13.462 | 30.0 | 30.0 | a | ||
| Fexix | 13.497 | 36.4 | 36.4 | a | ||
| Fexix | 13.518 | 48.3 | 48.3 | a | ||
| Fexix | 13.795 | 28.5 | 28.5 | a | ||
| Nevii | 13.814 | 42.3 | 42.3 | a | ||
| Nevi | 14.020 | 41.1 | 41.1 | a | ||
| Nevi | 14.047 | 51.4 | 51.4 | a | ||
| Fexviii | 14.208 | 49.2 | 49.2 | a | ||
| Fexviii | 14.208 | 41.4 | 41.4 | a | ||
| Fexviii | 14.373 | 30.6 | 30.6 | a | ||
| Oviii | 14.821 | 22.3 | 3.1 | 25.4 | 36.5 | |
| Fexix | 14.961 | 9.8 | 9.8 | 9.5c | ||
| Fexvii | 15.014 | 54.6 | 54.6 | 33.7c | ||
| Oviii | 15.176 | 34.6 | 6.5 | 41.1 | 38.7 | |
| Fexvii | 15.261 | 24.5 | 24.5 | 19.8 | ||
| Oviii | 16.006 | 51.0 | 16.7 | 67.7 | 59.8b | |
| Ovii | 17.086 | 24.5 | 24.5 | b | ||
| Ovii | 17.200 | 33.0 | 33.0 | 28.9b | ||
| Ovii | 17.396 | 43.4 | 43.4 | 38.9b | ||
| Ovii | 17.768 | 5.0 | 55.2 | 60.2 | 40.1b | |
| Ovii | 18.627 | 13.2 | 71.0 | 84.2 | 46.3b | |
| Oviii | 18.969 | 89.0 | 54.1 | 143.1 | 55.0b | |
| Nvii | 20.910 | 19.3 | 12.8 | 32.1 | 29.5b | |
| Ovii | 21.602 | 49.5 | 128.3 | 177.8 | 34.2b | |
| Nvi | 23.277 | 24.8 | 24.8 | a | ||
| Nvi | 23.771 | 41.9 | 41.9 | 23.9 | ||
| Caxiv | 24.114 | 25.2 | 25.2 | 26.8 | ||
| Nvii | 24.781 | 67.0 | 54.9 | 121.9 | 66.5b | |
| Nvi | 24.898 | 68.7 | 68.7 | 33.9b | ||
| Parameter | Comp 1 | Comp 2 | Comp 3 | |
|---|---|---|---|---|
| Log NH (cm-2)a | fix | 21.08 | 20.81 | 21.18 |
| FWHM (km s-1)a | fix | 193 | 170 | 280 |
| VOut (km s-1)a | fix | 1365 | 548 | 724 |
| Log U(UV)a | -0.11 | -0.1 | -0.19 | |
| Log U(X-ray)b | free | -1.20 | -0.69 | -0.99 |
2001, although with a one phase model; only high resolution spectra allows the identification of two components). The above exercise also highlights the danger of modelling the absorbers using UV data alone. The UV value of the ionization parameter underpredicts the ionic column densities by as much as factors of ten. The most likely explanation of this discrepancy is that the UV lines are saturated and the saturation effects are often estimated inadequately. This is illustrated beautifully in the case of NGC 5548 by Arav et al. (2003). They find that the Ovi column density measured from UV data by Brotherton et al. (2002) is lower than the robust lower limit obtained from the XMM-Newton data, by at least a factor of seven. When the effects of saturation are dealt with in a more sophisticated way by Arav et al. a good agreement is found.
Saturation was the main point in the models of Mathur et al. who parameterized its effect using the simple technique of curve-of-growth analysis. The key point that we stress again here is that the X-ray data imply a large amount of UV absorption, which cannot be hidden by claiming that the UV and X-ray absorbers are different. We will discuss the relationship between the UV and X-ray absorption in NGC 3783 in a forthcoming paper.
5 Evaluation of the Spectral Fitting Results
The self-consistent absorption model we present in this paper is the first to be carried out for the 900 ksec spectrum of NGC 3783. The extraordinary signal to noise ratio of the data has allowed us to obtain important constraints that make the modelling results more reliable. This is an important point since without the restrictions imposed by the data (see below), small changes in the fitting can give rise to completely different physical interpretations of the medium (see §5.5).
Our model presents a surprisingly simple picture: two kinematically indistinguishable gas outflows with quite different photoionization equilibrium temperatures and two widely separated ionization parameter values. The model also suggests that no third component with high H column density and intermediate U is consistent with the data (see below). Six free parameters are sufficient to model 100 absorption features and to correctly predict the EW of the 23 most intense lines that have little or no blending. Both components are consistent with solar abundances. Our fits are sensitive to departures of the Mg/O, Fe/O, Fe/Mg, Ne/O ratios by any more than a factor of 2 from solar, since transitions from these elements are in regions of high S/N. These data are not sensitive, however, to the C/N relative abundance. A component with low U and NH at 1345 km s-1 is needed to model an asymmetry in 4 O vii lines. A fourth component is evidenced by the presence of two Fe xxv absorption lines at 1.57 and 1.85 Å (identified by Kaspi et al. 2002). However, such component is even more highly ionized, and only contributes with a few lines to the overall spectrum. Almost all these features are below 4 Å, and are only detected by the HEG configuration of the HETG (not modelled here). This component is not well constrained (particularly by the MEG band), and we defer this analysis to a forthcoming paper.
Absorption by iron and oxygen is particularly important in the spectrum of NGC 3783. Even though some of their features are blended, these elements can be regarded as the main “tracers” of the gas, and therefore, can be used to evaluate the validity of a given model. In our case, an important result is that while O viii and Fe xvii-xxii are the main features of the hotter phase (see Fig. 7), the signature of the cooler phase can be attributed to the UTA and the O vii lines (see Fig. 8). Only 2% of the O vii, but 90% of the O viii, arises in the HIP (NLIP(O vii) cm-2 and NLIP(O viii) cm-2 vs. NHIP(O vii) cm-2 and NHIP(O viii) cm-2). This is noteworthy, since traditionally, the O vii absorption has been associated with that of O viii and warm absorbers (e.g. George et al. 1998 and references therein). Otani et al. (1996) have previously suggested two different sources of O vii and O viii (for MCG-6-30-15), but their physical interpretation is completely different than the one presented here, with the two absorption components at completely different regions. In our model, O vii is consistent with a cooler medium producing significant amounts of O vi and other lower ionization species. Without the constraints introduced by the UTA this distinction could not be realized. We also note that the O column densities produce significant K-edge absorption ( for O vii and for O viii).
Our model predicts more than 265 absorption lines with EWs larger than 1 mÅ. As can be appreciated in Figure 3, most of them fit the data in a quite satisfactory way. Table 4 and Figure 9 also show a good agreement between the measured and predicted EWs for unblended lines. The highly ionized phase produces nearly all the features between 15.3 Å and 8.5 Å (Fig. 7), where the spectrum becomes dominated by the Fe L-shell lines, plus the contribution of high ionization lines arising from other ions, such as O, N, and Mg. The predicted form of the UTA by the cooler phase also shows a good agreement with the data. We notice, however, that individual lines at around Å and Å are not predicted by the model. These features are part of the UTA (as can be observed in Figure 4 of Behar, Sako, & Kahn; 2001), but the abbreviated data cannot reproduce them. Our model does not yet include data for the O vi inner shell transitions. However, we notice that these features can be observed in the spectrum, particularly the most prominent one at 22.04 Å. Unfortunately, the signal to noise ratio at these wavelengths is too low to confirm their detection, even at the 1 level (see also Fig. 11). This is also the case of the feature at 22.33 Å, which could arise from O v. However, the presence of these features in the spectrum of NGC 3783 has been established through observations with the XMM-Newton (Blustin et al. 2000). This is an important point, since the LIP in our model predicts that a substantial fraction of the O will exist in these lower charge states (N(O vi) cm-2 and N(O v) cm-2).
There is another region where a discrepancy deserves comment. Between 6.75 and 7.0 Å, two lines clearly show larger EWs than the predictions of the model. These intriguing lines may be identified provisionally as Si x() and Si xi(). To reproduce them, either the high ionization phase would have to be much cooler ( K) with a much smaller value of the ionization parameter (), or the low ionization phase would have to be much hotter ( K) with a much larger value of the ionization parameter (). As will be discussed in §5.1, such values are not consistent with other features observed in the spectra. The presence of a third absorber with intermediate U is also unlikely (see Fig. 12d). A possible explanation for the difference is that our atomic database is incomplete, containing data for only the most intense lines of Si (lines with oscillator strengths larger than 0.1), so that the observed features are in fact blends of several Si x and Si xi lines. Alternatively, the atomic data used to calculate the ionization balance for iron and silicon might be inconsistent.
Our model uses the abbreviated data set to fit the 15-18 Å UTA. Since this is the main feature of the cooler phase, it is important to know the effects that this limited data could have on our results. We believe the approximation is sufficiently reliable in this case for two reasons. First, we are using turbulent velocities km s-1 and for all ions of iron the column density is lower than cm-2 (which according to Behar, Sako, & Kahn (2001), are the limits within which the approximation is valid, see §3). Second, our results are in qualitative agreement with those by Blustin et al. (2000) who modelled the UTA with the complete data set, and find a cooler phase consistent with ours (see §5.5). Therefore, it is unlikely that an overestimate of the absorption is present, but this still has to be confirmed. A quantitative estimation of the uncertainties introduced by the abbreviated data will be presented in a forthcoming paper.
5.1 Ionization constraints on two, three, and multi-component models

Since it is a wide, well resolved feature, the Fe M-shell UTA sets tight restrictions on the ionization level of the gas (see Fig. 12). As can be observed in Figure 13, different values of the ionization parameter lead to unambiguously different shapes for the UTA. For instance, will produce a feature from Fe iii-vii between 16.5 and 17.5 Å, with the peak of absorption around 17 Å (Fig. 13a). Lower values of will give rise to a narrower UTA, centered at wavelengths larger than 17 Å. On the other hand, larger values for the ionization parameter will shift the peak of absorption to shorter wavelengths, and will produce a wider shape. A logarithm of the ionization parameter equal to -0.78, like the one predicted from the LIP in our model, produces absorption between 15.7 and 16.9 Å, with an absorption peak at around 16.4 Å (Fig. 13b). A further increase in the ionization parameter value will further shift the peak of absorption toward smaller wavelengths and will widen even more the shape of the UTA (Fig. 13c).
The UTA can thus be used to estimate a lower limit to the ionization parameter of additional ionization states in the absorber. The spectrum of NGC 3783 shows no trace of the inner shell Fe xiv-xvi M-shell transitions, and hence most of the iron in the HIP has to be at least 15 times ionized. The fractions of Fe xv and Fe xvi for this component are less than and respectively.
The ionization parameter of the HIP is not consistent with a smaller value capable of reproducing the Si absorption features between 6.75 and 7.0 Å, since it would produce a significant fraction of Fe xii-xv, and a UTA similar to the one presented in the lower panel of Figure 13, a feature not observed in the spectrum (see section §5.1). Furthermore, a larger value would underpredict the absorption by Si xiv and other high ionization species. The resulting inconsistencies can be observed in Figure 12b. The low ionization phase is similarly well constrained. Figure 12c shows the effects of a larger ionization parameter. In this case, the absorption by the UTA at wavelengths larger than 16.5 Å is underpredicted by %.
The inclusion of another absorber with intermediate ionization parameter and comparable H column density is also inconsistent with the data. A third component, capable of reproducing the Si lines, would overpredict the UTA absorption between 15.3 and 16 Å by %. Such an absorber would need an ionization parameter U and a column density N. Figure 12d presents the effects of including a third absorber. These constraints strongly suggest that no intermediate values of U with high column density are present. However, the presence of the Si x and xi absorption features not accounted for in our model does not allow us to effectively rule out this possibility. Nevertheless, the use of better data for both the UTA and the Si inner shell transitions may account for the discrepancies. We cannot rule out the presence of additional low column density components or a bumpy continuous distribution with a small contribution to the absorption by low column density gas. However, such putative gas would have to have small column densities (N [cm-2]). Hence, from the above analysis it is clear that only two dominant absorbing components are required by the data in the MEG wavelength range.
As a final remark, we would like to stress that the discussion presented in this section is not dependent on the fact that we are using the abbreviated data to model the UTA. This approximation affects only sharp narrow edges. Figure 4 of Behar, Sako & Kahn (2001) presents three UTA models produced by media with different ionization parameters carried out with the full set of Fe M-shell transitions. A close inspection of their figure leads to the same conclusions presented here.
The physical conditions derived for the ionized absorber in NGC 3783 are thus well constrained.
5.2 Line Saturation
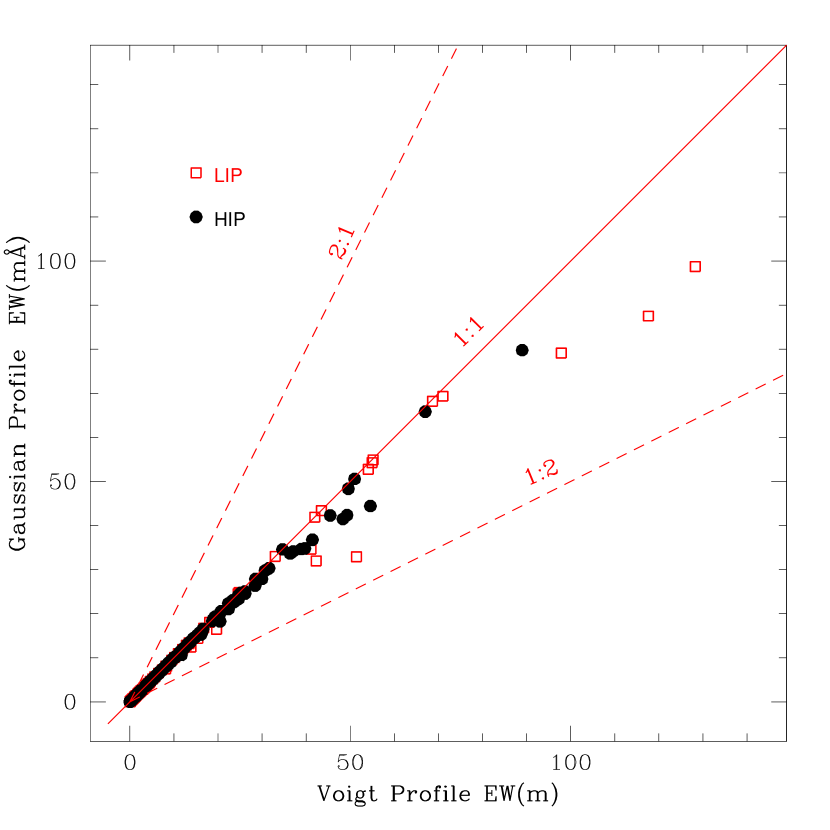
Our model predicts saturation of several absorption lines (see for instance Fig. 6). This saturation is not evident to the eye due either to heavy line blending or to emission and absorption line filling (see §5.3). Figure 14 shows a comparison of the EWs predicted from our model calculated with a gaussian and a Voigt profile. Fewer than 20 lines show saturation. However, as shown in the figure, the most intense absorption lines from the LIP are saturated. From Figure 8, it is evident that the LIP contributes with fewer absorption lines (but is responsible for most of the photoelectric absorption) than the HIP. So, although present in only a few absorption lines (the most intense ones) saturation becomes a significant effect.
5.3 Absorption and Emission Blending
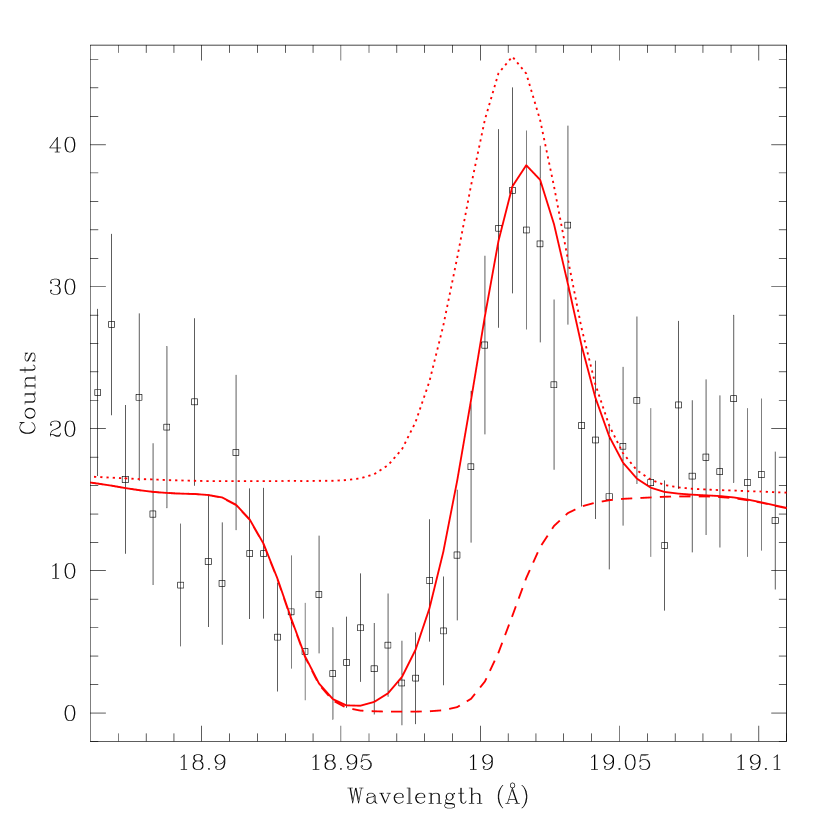
As can be observed in Figure 3, the model predictions are in fairly good agreement with the data for the most intense O vii and O viii absorption and emission lines. However, an inspection of these lines from Table 4 shows that the EWs derived by the model have systematically larger values than those measured from the observations. We believe this effect is a result of the filling of the absorption lines by the emission features. In Figure 6, we illustrate an example of the blending of absorption and emission lines. Therefore, one really needs to take into account absorption and emission together to correctly infer the physical conditions of both the absorber and the emitter. In our case, the emission was not inferred in a self-consistent way, although, it was constrained by the absorption. Therefore our emission fits (Table 2) can be used as a rough estimate of the emission line properties of NGC 3783. An inevitable conclusion is that without modelling of absorption and emission line blending, measurements of the observed EWs from the data will underestimate the actual values. This effect can be observed in Figure 15a, where we present a comparison of the emission line EWs with and without the contribution from absorption. This figure also shows that a factor of 2 for the filling of the absorption lines by the emission lines is present in almost all the resonant transitions (the few forbidden transitions show no effect, as expected).

Additional complexity is introduced to the absorption/emission blending problem by the continuum level: if this level is not modelled globally, inconsistent results can be obtained. In Figure 15b, we compare the emission properties from this paper with those deduced by Kaspi et al. (2002), where no filling correction was applied, and only a local continuum was fitted. For truly unblended lines (such as O vii forbidden and intercombination lines), the values reported by Kaspi et al. are larger than ours, indicating a lower continuum level. By contrast, some emission lines blended with an absorption component have lower EWs in their study (in some cases by a factor 2), a signature of absorption filling. Even more, the fitting of a local continuum can yield highly misleading results. For instance, Kaspi et al. estimated the EW of the resonant Ne ix(13.699) line as 78.1 mÅ, while we computed a value of only 15.3 mÅ. Although this line is filled by absorption, Kaspi et al. found a much larger EW than we do, because they assumed that most of the spectral features near this wavelength were produced by emission (i.e. they fitted a low continuum level). As can be seen in Figure 3 the continuum level at this point from our global fit is rather high, and most of the structures there are produced by absorption, with only a small contribution from this emission line. This is a common problem also faced in analyses of the Lyman forest (e.g. Bechtold et al. 2002).
| Norm.a | log(U) | log(U) | log(N) | log(N) | z(x)/zo | ||
|---|---|---|---|---|---|---|---|
| This paper | 1.53b | .011 | -2.77 | -1.23 | 21.6 | 22.2 | 1 |
| Kaspi et al. | 1.77 | 0.015 | -1.75 | 0.75 | 22.2 | 22.2 | 1 |
| Blustin et al | 1.53 | .018 | 0.3c | 2.4c | 20.7 | 22.45 | 10(Fe) |
| de Rosa et al. | 1.83d | 0.019 | 0.4 | 22.3 | 1 |
5.4 Spectral Energy Distribution
Mathur, et al. (1994) have shown the importance of including the particular SED of an AGN, rather than a typical SED. In the latter case, incompatible physical conditions may arise in the description of a photoionized cloud. As discussed before (§4.1), the SED we used to calculate the ionization balance of the gas is only an approximation to the actual (unknown) SED. This approximation is the best that can be obtained currently for the spectral shape of NGC 3783. This point is important, since the values obtained for the ionization parameters are dependent on the continuum shape, and moreover, so is the difference between the ionization parameter of the two phases.
Our chosen SED (Fig. 5) produces rapid changes of the ionization balance with small changes of the ionization parameter, and therefore the ratio of U between the two phases is small when compared to other SEDs (for instance the SED used by Kaspi et al. 2001). To illustrate this point, we have recalculated the ionization parameters using the Mathews & Ferland (1987) continuum (shown in Fig 5). The values obtained for this SED for the low and high ionization component were and . These values are larger than those predicted with our better chosen SED, and yield a factor 72 between the ionization parameter of the phases, twice as large as we obtain. Therefore, any comparison between models should account for the effects of the different SEDs used. In our case, a factor of only 35 in the ionization parameters produces dramatically different ionization degrees, with a factor between the temperature of the two phases. However, using the Mathews & Ferland continuum gives T(HIP)=8.1 K and T(LIP)=2.1 K, and so a difference factor in temperature of , all of which are close to the factor found with our SED.
5.5 Previous Models
Four different studies have been published in the past for NGC 3783: (1) Kaspi et al. (2001) modelled a much lower quality spectrum, the first HETG-Chandra observation of NGC 3783; (2) Blustin et al. (2002) modelled also lower quality data, a 40 ksec exposure taken with the XMM-Newton; (3) de Rosa et al. (2002) modelled low spectral resolution BeppoSAX observations; and (4) Kaspi et al. (2002) analyzed the same 900 ksec HETG spectrum with an empirical approach. In the following, we review these analyses and contrast them with our results. Table 6 summarizes the results found with the different models (including the one presented in this paper).
5.5.1 The model by Kaspi et al. 2001
These authors established for the first time that two absorption systems were required to fit the wide range of ionization species found in the data. They estimated the continuum SED, including (1) spectral curvature resulting from bound-free absorptions due to a single component ionized absorber and (2) “Compton reflected” continuum. Using this SED, they then modelled the absorption assuming the same turbulent and outflow velocities for the two components (300 km s-1 and 610 km s-1 respectively). They found a photon index and a normalization value A(1keV)=0.0151 photons keV-1 cm-2 s-1. While for their low ionization component they found , for the high ionization one they obtained . In both components NH[cm-2] was estimated to be 22.2.
A comparison between this model and ours (see Table 6) indicates a difference of 0.24 between the photon indexes deduced ( in our case). Compton scattering (not included in our model) is unlikely to contribute a lot to this difference; Kaspi et al. (2002) estimated it to be %. Rather, the source of the discrepancy most likely arises from Kaspi et al. (2001) basing their column density measurements only on the photoelectric edges. The 900 ksec spectrum clearly shows that the two deepest edges, O vii and O viii, are masked by Fe transitions: O vii is hidden in the Fe M-shell UTA (not modelled by Kaspi et al.), and O viii is hidden in the Fe L-shell lines. Since the contribution of these lines was not considered, the edge depths were overpredicted (see Fig. 4), which, in turn, yielded an overprediction of the photon index. This effect has repercussions on any measurements based solely on low resolution CCD spectra. In the case of NGC 3783, based on ASCA data, Reynolds (1997) and George et al. (1998) found for O vii and for O viii, and thus a factor at least 4 times larger than the edges predicted by our model. Figure 4 shows a comparison between models including only photoelectric absorption and models including both photoelectric and resonant absorption. Therefore the depths and the column densities calculated through low resolution spectra, should be considered only upper limits to the actual values. In objects like NGC 3783, where a deep UTA is present, the overestimation is likely to be significant. We do not yet know the importance of this effect in other objects.
To make a comparison of the ionization parameters, we calculated (the ionization parameter in the range 0.538 and 10 keV, George et al. 2000) for the continuum we used. The values we obtained were -2.77 for the LIP and -1.23 for the HIP, factors of 10 and 3 lower than Kaspi et al. (2001) values. While our HIP has an ionization degree between the high and the low ionized components of Kaspi et al., our LIP is much less ionized than either. In both models, the low ionization phase is responsible for the O vii absorption, but the predicted physical conditions of the gas are completely different. The difference in ionization degree is explained by the omission of the UTA in their model. As discussed in §5.1, the ionization parameter of their low ionization component is too high to reproduce this feature.
5.5.2 The model by Blustin et al. 2002
As in the previous case, Blustin et al. (2002) needed two absorption components to fit the XMM-RGS data. Blustin, et al. modelled the continuum with a simple power law with and a normalization value A(1keV)=0.0175. The normalization is larger than what we find, because they have not included a blackbody component in their model. The photon index, however, is consistent with the one we found (see Table 6). Their strategy for modelling the absorption was to measure first the contribution of each ion with the configuration slab of the code SPEX, and then to model the data for a two phase ionized absorber using the configuration xabs. The authors estimated the outflow velocity as 800 km s-1, and fixed a velocity width (rms) of 300 km s-1. This width refers to the gaussian sigma, and corresponds to a Doppler velocity (turbulent plus thermal, see §3) km s-1. The values predicted by their model were erg cm s-1 and cm-2 for their high ionization phase, and erg cm s-1 and cm-2 for the low ionization one (where , defined as , is the ionization parameter). A direct comparison between ionization parameters is not possible since the SEDs used are different (see §5.4). However, our results are not qualitatively in contradiction with theirs.
Nevertheless, there are several quantitative differences that lead to different interpretations of the data: (1) While we were able to fit the data assuming solar abundances, their low ionization phase requires 10 times the solar abundance of iron to reproduce the observed features. This value seems to be rather high. (2) The H column density of their cooler phase is times lower than ours. (3) By contrast with our model, in theirs the hotter component has a significant contribution to the absorption produced by O vii, due to the high column density of this component (and the low column density of their cooler component).
These quantitative differences can be understood from the different continuum fits applied to the data, i.e. due to the inclusion of a soft thermal component in our model. The presence of a soft thermal component requires deeper absorption at long wavelengths to match the data. Therefore, a cooler phase capable of accounting for this absorption needs to have a high H column density. However, this would also result in strong saturation in the C, N, and O lines. Since, as stated by Blustin et al., the abundance of Fe is effectively measured against the abundance of these ions, omitting the soft excess in the presence of a deep UTA would require an overabundance of Fe relative to other elements. Therefore, Blustin et al. concluded that iron was around one order of magnitude more abundant than oxygen (relative to solar values) and, accordingly, that the H column density was around one order of magnitude smaller in the low ionization phase because, at the time, they did not find evidence for a soft excess. However, they emphasize that if saturation is present (along with the presence of a soft excess), the iron abundance could be much smaller. This is in agreement with our results, which require Fe/O to be within a factor 2 of solar and strong saturation. The inclusion of a thermal component, therefore, allowed us to fit the data with solar abundances.
The existence of a soft excess in the spectrum of NGC 3783 has been further evidenced by the X-ray variability properties seen with new XMM data. The overall 0.2-10 keV spectrum gets softer as the source gets brighter, consistent with a variable soft excess, as seen in other Seyfert galaxies (A. Blustin, private communication).
5.5.3 The Model by de Rosa et al. 2002
BeppoSAX observed NGC 3783 5 days in June of 1998. De Rosa et al. 2002 reported this observation and modelled the data. Only modest flux variations ( 20%) were detected. They found a photon index and a normalization value A(1keV)=0.019 photons keV-1 cm-2 s-1. A thermal component with T= 0.21 keV and normalization 4.5 (where is the source luminosity in units of erg s-1 and is the distance to the source in units of 10 kpc) was necessary to fit the spectrum. They also found evidence for the ionized absorber. The results of their fitting are presented in Table 6. As in the case of Kaspi et al. (2001), the differences between fittings can be explained by the fact de Rosa et al. used only the absorption edges (due to the low resolution of their data), and not the lines, in their analysis.
| (Å) | Ion Name and Rest Frame (Å) identification | |
|---|---|---|
| Observed | Kaspi et al. | This paper |
| 10.126 | Fexvii(10.112) | Fexvii(10.112), Fexix(10.119), Fexvii(10.120) |
| 10.524 | Fexvii(10.504) | Fexvii(10.504), Fexviii(10.537) |
| 12.436 | No identification | Nixix(12.435) |
| 12.560 | Fexx(12.576) | Fexx(12.526) |
| 12.592 | Fexx(12.588) | Fexx(12.576,12.588), Fexix(12.538) |
| 13.612 | Fexix(13.645,13.643) | |
| 13.822 | Fexix(13.795) | Nevii(13.814),Fexix(13.795) |
| 14.269 | Fexviii(14.256) | Nev(14.239),Fexviii(14.256) |
| 15.584 | Fexviii(15.625) | |
| 21.466 | Ovii(21.602) zero redshift | Caxvi(21.450) |
| 23.783 | Nevi(23.771) | |
| 24.124 | Caxiv(24.114) | |
5.5.4 Analysis by Kaspi et al. 2002
Kaspi et al. (2002) used a different analysis strategy and did not fit the data with a theoretical model. They empirically identified the lines and measured the EWs directly from the spectrum, using apparent line free zones to estimate the continuum level, but only locally. The appeal of this approach is that it produces directly measured quantities before getting into detailed modelling. The disadvantages are: a conflating of blends into single “features”, the ignoring of the mutual cancelling of emission and absorption, and an inability to derive a global picture of the physical conditions.
There are some discrepancies between their line identifications and the predictions from our model. The most important ones are listed in Table 7. The differences can be attributed mostly to the inclusion in our calculations of Ni and Ca lines, as well as more than 1200 Fe transitions arising from the ground state. According to Kaspi et al. (2001) their models include several hundred. The authors tentatively identified a 14 mÅ absorption line around 21.45 Å (in the rest frame system, Fig 3) as a local component of O vii(). This feature would be produced by intergalactic absorption at zero redshift, or by Galactic absorption (see Nicastro et al. 2002). Our model indicates that this line is produced by the high ionization phase, and corresponds to a Ca xvi() transition (the difference in wavelength is due to the outflow velocity of the absorber). Therefore, any putative contribution from a local medium cannot account for an EW larger than 9.3 mA (at 1 level), consistent with the results found for the local filament by Nicastro et al. (2002, 2003). An EW comparison between Kaspi et al. and our measurements indicate a good agreement for all unblended absorption lines (14 cases) and for some blended features (11 out of 17 cases). The differences found can be ascribed to the different continuum levels. While we fitted the continuum derived from the global spectrum using our model, they measured the continuum locally and in an empirical way. We notice that, as discussed in §5.3, several absorption-emission blended lines present systematic differences between measurements and our model predictions.
6 Absorber Physics Discussion
6.1 Two phases of the same medium?
The simple nature of our two component model, with indistinguishable kinematics and very different ionization parameters, suggests that the absorption observed in the NGC 3783 spectrum may arise from two phases of the same medium.
First, two separate components seem to be the best way of describing the absorbing gas, since the discussion presented in §5.1 and the plots in Fig. 12d strongly suggest that a continuous medium, i.e, a medium with a smooth distribution of temperatures from the HIP to the LIP (as proposed by Krolik & Kriss, 2001) is unlikely to produce the well defined UTA absorption feature observed. Rather, such a medium would produce less deep, continuous, absorption from to Å. A continuous medium also requires strong iron L and K edges (Krolik & Kriss, 1995), features not detected in the spectrum.
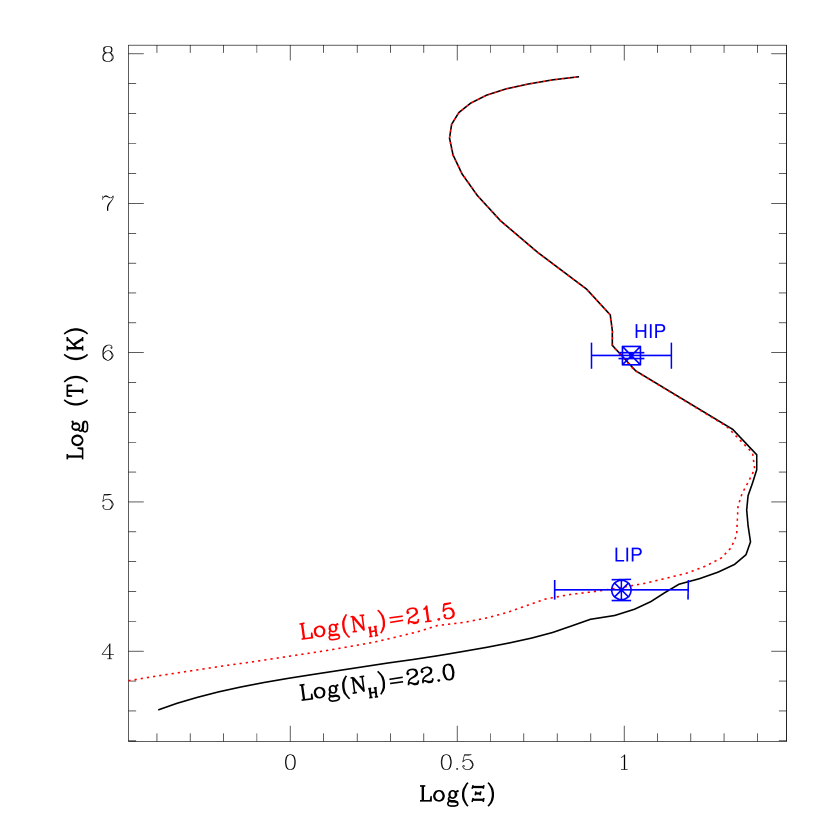
The presence of a two phase medium (and not a continuous medium) is further evidenced by the fact that the two components are in pressure equilibrium: the gas pressure (P) of each phase is proportional to the electron density (ne) and the temperature (T); therefore, with the adopted definition of the ionization parameter, PT/U. Under the assumption that the two components lie at the same distance from the central source, as is plausible given their identical kinematics, the two phases turn out to have the same pressure (see Table 3). To further illustrate this point, we show in Figure 16 the thermal equilibrium curve (S curve) for the SED used in our analysis (see §4.1). To construct this curve we calculated the ionization parameter as defined by Krolik, McKee & Tarter (1981): (where is the luminosity of the source, the distance between the gas and the source, the speed of light, the total particle density of the gas, the Boltzmann constant, and the electron temperature). This representation of the ionization parameter is simply the ratio between the radiation pressure and the gas pressure. In Figure 16 we also plot the values we find for the HIP and the LIP (as listed in Table 3). The pressure equilibrium is evident. Unless imposed by real pressure equilibrium, this pressure equality would have to be assumed to be a coincidence. We notice that the HIP lies in the intermediate part of the curve, in a region where the slope is negative. Regions of the curve with negative slope are thermally unstable. This might be then inconsistent with the equilibrium scenario just presented. Nevertheless, the shape of the thermal equilibrium curve strongly depends on the SED, and particularly on the unobservable region between 100 Å and 912 Å. Considering different shapes for the SED in this unknown gap can give rise to thermal curves with an intermediate stable region in the region occupied by the HIP (see for instance Reynolds and Fabian 1995). Therefore, this apparent instability might be only the result of our chosen SED, a likely possibility, since according to the error bars in Figure 16, our HIP is consistent with the semi-stable intermediate region of our S curve (nearly vertical region of the equilibrium curve with a value close to 1 and T K). Alternatively, this instability could be reflecting the fact that, besides the illumination from the central source, additional cooling/heating processes (for instance shock-heating) might be also working on the gas. In this latter case, the electron temperature would be constant due to the additional source of heating, and the solution found would be stable.
A two phase medium is consistent with the thickness ratio between the phases: the radial thickness occupied by the absorbing gas is roughly equal to the ratio between the H column density and the H density (D=NH/n(H)), and, from the definition of the ionization parameter given in §3, DNHr2U/Q(H). Therefore the thickness ratio between the phases goes as Rtck NH(HIP)r(HIP)2U(HIP)/ NH(LIP)r(LIP)2U(LIP). If we assume again that both phases lie at the same distance from the central source, then the thickness of the HIP is 140 times larger than that of the LIP. This result is consistent with pressure confinement of the LIP by the HIP.
A two phase warm absorber with no intermediate value of U was also detected in IRAS 13349+2438 by Sako et al. (2001). In that case, the UTA was also produced by Fe vii-xii. Are the two phases in IRAS 13349+2438 also in pressure balance? An intriguing possibility is that a two phase medium forms because of the thermal instabilities. In photoionization equilibrium the gas will always be driven to the stable regions of the S curve which are set by the SED and atomic physics. However, not all the regions of the stable branches can be occupied by the absorbing gas, as the two phases will tend to reach pressure balance with each other.
This appealingly simple picture not only suggests the idea of a two phase medium, but also points to a simple view of active nuclei (e.g. the structure for quasars suggested in Elvis 2000). Recent results indicate that the physical properties of the optical ‘High Ionization Nuclear Emission Line Region’ (HINER) are consistent with those of the X-ray warm absorber (Erkens, Appenzeller, & Wagner, 1997; Nicastro et al., 1999; Netzer et al., 2002). Therefore, it is plausible that the high ionization absorption and emission arise from the same gas. If the gas lies in our line of sight, the absorption is observed, if the gas lies out of our line of sight, only the coronal emission from the HINER can be detected. Porquet, et al. (1999) found that this picture could only be supported if the electron densities are high (n cm-3) to avoid overproducing the coronal lines, and concluded that the distance of the ionized absorber from the incident radiation source is of the order of that of the Broad Line Region (BLR). All this evidence also points to models where the hotter gas confines the broad emission lines gas (BELs gas, see, e.g. Turner et al. 1993; Elvis 2000).
Our two phase solution for the warm absorber may also be pointing to this general scenario. The value of the electron density derived from the O vii triplet for NGC 3783 (see §4.2) is consistent with the predictions by Porquet et al. (1999, see above), and therefore this is consistent with a connection between the absorbing and emitting gas. This density, as well as the temperature for the HIP are close to those needed to explain strong O vii emission lines in other objects (George, Turner, & Netzer, 1995; Nicastro, Fiore, & Matt, 1999). However, what is the location of the absorber? We do not have any means of measuring the electron density of the absorber or its distance to the central source at this time. Nevertheless, Nicastro, Fiore, & Matt (1999) and Netzer et al. (2002) have shown through spectral variability studies in NGC 4051 and NGC 3516 respectively, that the location of the ionized absorbing gas is similar or closer to the central source than that of the broad line region.
A simple identification between the absorbing gas and an emission component is difficult to obtain, but from the latter discussion a natural candidate could be the Broad Emission Line region. This has been already suggested by Kuraszkiewicz & Green (2002), who found a correlation between the N v/C iv ratio in broad emission lines and that in narrow absorption lines, and is further supported by the similarity of the temperature of the LIP and the temperature predicted for the BEL (e.g. Kaastra et al. 1995, for NGC 5548). The BEL gas in AGN is clearly radially stratified, as shown by reverberation mapping (Peterson et al., 1999), with a range of ionization parameters. According to the above models, the BELs are produced by the contribution of all the clouds surrounding the AGN, that can have different ionization conditions (simply because of different distances to the central source, or different electron densities), giving rise to the range of ionization parameters. However, the absorption is produced only by those few clouds intercepting our line of sight. Therefore, a discrete value of the ionization parameter for the LIP can in principle be reconciled with the LIP-BEL gas connection. Koratkar & MacAlpine (1992) found that a log(U) range between -1.3 and -0.7 could characterize the UV BEL in NGC 3783. This range could be consistent with the value obtained for the LIP. However, different SEDs were used in the studies, and though they have similarities (for instance, we included a change of slope in the UV, and they included a big blue bump) it is not possible to make a clear connection (see §5.4). Nevertheless, the similarity of U (also found in other AGN, Elvis 2000), as well as the similarity of the temperatures are physically suggestive, and bear further investigation.
This would point to models where the hotter emitting/ absorbing gas confines the BELR/ LIP (see, e.g. Turner et al. 1993, Elvis 2000). Pressure confinement is currently not favored (Peterson, 1997) among other reasons because of the rapid destruction of the BEL clouds by drag forces, when they are moving through a stationary medium. However, pressure confinement is possible if both phases are comoving in a wind with a single outflow velocity, as is the case of our two phases on NGC 3783. Other problems, such as the need for a low Compton depth are solved if a funnel shape geometry is present (Elvis 2000). This geometry is not in contradiction with our results.
As a final remark, we note that the presence of the absorption component detected in O vii with an outflow velocity of 1365 km s-1 is not straightforwardly explained in light of the above models. This component is well constrained, as discussed in section 4.3.2, although contributing to only 4 features out of the 265 with EW larger than 1 mÅ. However, the thickness of the LIP is 9 times that of this component, and that of the HIP is times larger. Therefore, whatever the origin of this absorption, it is not in contradiction with our scenario in which two phases dominate. Nevertheless, what is the true nature of this puzzling component? The velocity matches that of the component discovered in the UV, and in several other AGN multiple velocity UV absorption systems have also been detected. Are these intervening systems unrelated to the AGN? Do they originate at the edge of an obscuring torus? The present data are inadequate to say.
Our results, though strongly pointing to the general scenario presented above, are based only on the analysis of one object. Was this result only a coincidence? Or can all ionized absorbers be represented with a simple two phase medium? IRAS 13349+2438 is another example of an ionized absorber with two different absorption components (Sako et al. 2001). Are these two components always in pressure balance? Further study is still necessary to unravel the answer to these questions, but the simple picture presented here is certainly intriguing.
6.2 The Nature of the UV X-ray Absorption
A warm absorber was first discovered by Halpern in 1984, but the use of warm absorbers to understand the physical conditions in matter close to the central black hole came with the realization that the warm absorbers seen in X-rays also imprint signatures in the UV as associated absorption lines. In a series of papers Mathur and collaborators (1994 through 2001) showed that the high ionization absorption lines seen in the UV, such as Ovi, Civ, Ly could come from the same single phase gas which produced O vii and O viii edges in X-rays. The combination of saturation free X-ray column densities with outflow velocities from UV spectra led to the discovery of a component of nuclear material not previously recognized: highly ionized, outflowing, low density material situated close to or outside the broad emission line region. The mass outflow rates implied are large, a significant fraction of the mass accretion rate needed to power the AGNs, and so must have important dynamical influences within the active nuclei. The insight obtained through these studies led to one of the most comprehensive models of the nuclear regions of AGNs to date (Elvis 2000).
As such, the X-ray/UV absorbers have proved to be powerful tools to understand the physics of AGN outflows. However, the connection between UV and X-ray absorbers has remained a matter of controversy for years, for several reasons:
(1) Intrinsic observational limitations make component identifications difficult: even now, UV spectra have 20 times better spectral resolution, so a simple, one to one, matching of features cannot be performed. In addition, X-ray instrumentation is sensitive to only a limited range of column densities (see Fig. 11), making weak components found in the UV undetectable, even if present. For an ionization parameter U 1, FUSE can detect 100 times smaller NH systems (Kriss et al. 2000) than even high S/N Chandra grating spectra (Fig. 11). The situation gets more complicated because only a limited range of high ionization states can produce features in the UV spectra (Fig. 11), since the low ionization ion populations where the UV transitions are produced become tiny. We now see that a 2-phase medium is required. The high ionization phase in our model, as well as the high velocity system in NGC 4051 (Collinge et al. 2001) represent good examples of this.
(2) As already stressed by Mathur et al. (1994, see also Kaspi et al. 2001), the actual ionization parameters are strongly dependent on the far UV shape of the SED. Although this does not affect the absorption produced in the X-ray region (Steenbrugge et al 2003), it has an important effect on the UV absorption and so on linking the UV and X-ray absorbers. This is an important limitation since this region cannot be observed due to Galactic absorption.
(3) The strong variability of the sources makes the determination of the relative UV and X-ray continuum fluxes unreliable, unless truly simultaneous observations are considered (Crenshaw et al. 2003).
(4) As discussed before, several studies on the UV have neglected the effects of saturation, underestimating the ionic column densities in the UV band. As demonstrated by Arav et al. (2003), when an accurate treatment of saturation is present the column densities found in the UV band become consistent with the X-ray absorbing material. We find here that X-ray column densities have instead overestimated the Oxygen edge depths and column densities due to line blends.
(5) Finally, the presence of a hotter phase (not detectable in the UV), as well as the presence of deep bound-free absorption edges in the X-rays, introduces additional complexity. While the UV absorbers are almost transparent one to the other, photoelectric absorption in the X-ray attenuates significantly the continuum each absorber receives. Hence, the order in which the absorbers are illuminated by the source may affect the final results in a given model. The ionization parameter is very sensitive to this effect, making the comparison of UV and X-rays values unreliable. Therefore, to really infer something about the X-ray UV absorption link, simultaneous self-consistent modelling of each absorber should be applied to simultaneously observed data. This is beyond the scope of this paper (but we notice that simultaneous observations with FUSE and HST-STIS do exist for the Chandra data analyzed here).
Some of the difficulties mentioned above can be overcome with careful analysis and modelling. But the complexity of UV and X-ray spectra have led to many papers with highly complicated models involving multiple physical components to describe AGN absorbers. The general consensus from these studies, using very long observations on the most powerful satellite borne telescopes, seems to be that the absorption system(s) is/are extremely complex. This renders warm absorber studies completely ineffective as probes of circumnuclear environment of AGNs.
In this paper we have shown that the situation is much more promising: the warm absorber in NGC 3783 can be simply described by two gas zones, but no more, with identical kinematics within the power of our measurements (§4.3.1), one having a low and one having a high ionization parameter; these two zones are in pressure equilibrium with each other and lie on the (T,) equilibrium curve for the SED of NGC 3783, and so are two phases of the same medium; the LIP phase also produces the UV absorption lines (§4.4).
Thus, the high resolution Chandra and XMM-Newton spectra can resolve years of controversy surrounding the nature of X-ray/UV absorbers, if analyzed and interpreted carefully. It appears clear that (though multiple components may be present) the X-ray and UV absorbers are different manifestations of the same outflow (e.g. Steenbrugge et al. 2003), confirming the original Mathur et al. models, but refining them to a two phase medium. This is extremely important, since the long baseline of ionization states from UV to X-rays, and superior velocity information from higher resolution UV spectra, can be used to model the absorbing outflow accurately. We will exploit this tremendous potential in a forthcoming paper presenting detailed model of the X-ray/UV absorber in NGC 3783, and will extend the current analysis to more AGNs as high quality X-ray spectra become available.
7 Summary
We have developed PHASE, a new code designed to model the X-ray and UV absorption of ionized gas in the environment of AGN. We have used our model to study the Chandra 900 ksec spectrum of NGC 3783. This X-ray spectrum is the best one available so far from a Seyfert galaxy. We used a global fit approach, which is necessitated by the blending of 75% of the absorption features, compromising line strengths measured empirically. The heavy blending also results in a continuum level that cannot be estimated locally, except in narrow bands. Our main results are as follows:
(1) The intrinsic continuum of the source is well reproduced by a power law () and a thermal component (kT=0.1 keV). We attenuated this continuum by an equivalent hydrogen column density of cm-2 to account for the Galactic absorption.
(2) Our absorption model leads to a simple picture consisting of a two phase wind. The model can reproduce more than 100 features with only 6 parameters. The high quality of the data, plus the inclusion of new atomic data for several lines made the modelling results more reliable than previous studies. The two components of the model are in pressure equilibrium, and are consistent with a single outflow ( km s-1), a single turbulent velocity ( km s-1), and solar abundances. The ionization parameter of the high ionization phase (U=5.754) is times larger than that of the low ionization phase (U=0.166). The equivalent H column densities were estimated as N cm-2 for the hotter phase and N cm-2 for the cooler one. The difference found for the ionization parameters of the phases is strongly dependent on the continuum shape. With our chosen SED, a factor of 35 yields a low ionization phase with a temperature 37 times lower than the high ionization one, and completely different ionization degrees. The main features of the cooler phase are the Fe M-shell UTA and the O vii lines, while the features for the hotter phase are the O viii and the Fe L-shell lines. The O vii, previously identified with the O viii and a hot phase, is consistent with a cooler phase and the O vi.
(3)Our model strongly disfavors a continuous range of ionization parameters to describe the medium because it is not consistent with the observed shape of the UTA.
(4) Thanks to the high resolution spectra, we were able to determine that in the case of NGC 3783, the K edge of O vii is masked by the presence of the UTA and the K edge of O viii is masked by the presence of the Fe L-shell lines. Through our model, we have shown that this produces an overestimation in the measurement of the edge depths (by a factor 4), if the contribution from the absorption lines is not taken into account. An important conclusion derived from this is that only an upper limit to the column densities can be obtained from CCD low resolution spectra (e.g. ASCA). In objects where a deep UTA is present, this effect could be particularly important.
(5) Our model predicts a Ca xvi line at 21.45 Å. This line was formerly identified as a local O vii() feature arising from an intergalactic cloud at zero redshift or Galactic absorption. With the inclusion of the Ca line, if a local feature is present, it cannot contribute more than 9.3 mÅ to the total EW.
(6) Our model does not attempt to predict the emission lines in a self-consistent way. Therefore, we fitted them with gaussian profiles. We restricted the outflow velocities and FWHMs of the lines arising from transitions of the same ion. The emission and absorption lines are blended, making an independent estimation of them unreliable. Our emission lines are constrained by the absorption lines, making our predictions useful as rough estimates of the actual emission line properties of NGC 3783. The emission line EWs increase by a factor 2 when the absorption/emission filling effect is included.
(7) We find an excellent agreement between X-ray data and a model with kinematic components identical to the UV absorption lines. We also find that the UV value of ionization parameter underpredicts ionic column densities by as much as a factor of ten, illustrating the danger of modelling the absorbers using UV data alone. A detailed model of the UV and X-ray data together, however, is beyond the scope of this paper.
The analysis presented in this paper offers new hope that warm absorbers in AGN are relatively simple systems with physical properties that are easily understood. If this turn out to be generally true, then they will provide, particularly through their variability, completely characterized physical conditions for AGN winds. This in turn is likely to lead back to a deeper understanding of the basic physics powering AGN and quasars.
References
- Arav et al. (2003) Arav, N., Kaastra, J., Steenbrugge, K., Brinkman, B., Edelson, R., Korista, K.T., Kool, & M. 2003, ApJaccepted(astro-ph/0303425)
- Baldwin et al. (1996) Baldwin, J. A. et al. 1996, ApJ, 461, 664
- Bechtold et al. (2002) Bechtold, J., Dobrzycki, A., Wilden, B., Morita, M., Scott, J., Dobrzycka, D., Tran, K., & Aldcroft, T. L. 2002, ApJS, 140, 143
- Behar & Netzer (2002) Behar, E. & Netzer, H. 2002, ApJ, 570, 165
- Behar, Sako, & Kahn (2001) Behar, E., Sako, M., & Kahn, S. M. 2001, ApJ, 563, 497
- Blustin et al. (2002) Blustin, A. J., Branduardi-Raymont, G., Behar, E., Kaastra, J. S., Kahn, S. M., Page, M. J., Sako, M., & Steenbrugge, K. C. 2002, A&A, 392, 453
- Brotherton et al. (2002) Brotherton, M. S., Green, R. F., Kriss, G. A., Oegerle, W., Kaiser, M. E., Zheng, W., & Hutchings, J. B. 2002, ApJ, 565, 800
- Canizares et al. (2000) Canizares, C.R., et al. 2000 ApJ, 539, L41
- Collinge et al. (2001) Collinge, M. J. et al. 2001, ApJ, 557, 2
- Crenshaw et al. (1999) Crenshaw, D. M., Kraemer, S. B., Boggess, A., Maran, S. P., Mushotzky, R. F., & Wu, C. 1999, ApJ, 516, 750
- Crenshaw et al. (2003) Crenshaw et al. 2003, ApJaccepted(astro-ph/0305154)
- De Rosa et al. (2002) de Rosa, A., Piro, L., Fiore, F., Grandi, P., Maraschi, L., Matt, G., Nicastro, F., & Petrucci, P. O. 2002, A&A, 387, 838
- de Vaucouleurs et al. (1991) de Vaucouleurs, G., de Vaucouleurs, A., Corwin, H. G., Buta, R. J., Paturel, G., & Fouque, P. 1991, Volume 1-3, XII, 2069 pp. 7 figs.. Springer-Verlag Berlin Heidelberg New York,
- Elvis (2000) Elvis, M. 2000, ApJ, 545, 63
- Erkens, Appenzeller, & Wagner (1997) Erkens, U., Appenzeller, I., & Wagner, S. 1997, A&A, 323, 707
- Ferland (1997) Ferland G.J. 1997, CLOUDY Version 90.04
- Freeman, Doe, & Siemiginowska (2001) Freeman, P., Doe, S., & Siemiginowska, A. 2001, Proc. SPIE, 4477, 76
- Fruscione (2002) Fruscione, A. 2002, Chandra News, 9, 20
- Gabel et al. (2003) Gabel, J. R. et al. 2003, ApJ, 583, 178
- George, Turner, & Netzer (1995) George, I. M., Turner, T. J., & Netzer, H. 1995, ApJ, 438, L67
- George et al. (1998) George, I. M., Turner, T. J., Netzer, H., Nandra, K., Mushotzky, R. F., & Yaqoob, T. 1998, ApJS, 114, 73
- George et al. (2000) George, I. M., Turner, T. J., Yaqoob, T., Netzer, H., Laor, A., Mushotzky, R. F., Nandra, K., & Takahashi, T. 2000, ApJ, 531, 52
- Graessle et al. (1996) Graessle, D. E., Clark, A. M., Fitch, J. J., Harris, B., Schwartz, D. A., & Blake, R. L. 1996, Proc. SPIE, 2805, 18
- Grevesse, Noels, & Sauval (1993) Grevesse, N., Noels, A., & Sauval, A. J. 1993, A&A, 271, 587
- Halpern (1984) Halpern, J. P. 1984, ApJ, 281, 90
- Kaastra, Roos, & Mewe (1995) Kaastra, J. S., Roos, N., & Mewe, R. 1995, A&A, 300, 25
- Kaspi et al. (2002) Kaspi, S. et al. 2002, ApJ, 574, 643
- Kaspi et al. (2001) Kaspi, S. et al. 2001, ApJ, 554, 216
- Kaspi et al. (2000) Kaspi, S., Brandt, W. N., Netzer, H., Sambruna, R., Chartas, G., Garmire, G. P., & Nousek, J. A. 2000, ApJ, 535, L17
- Koratkar & MacAlpine (1992) Koratkar, A. P. & MacAlpine, G. M. 1992, ApJ, 401, 110
- Korista et al. (1996) Korista, K. T., Baldwin, J. A., Ferland, G. J., Verner, D. A., & Ferguson, J. W. 1996, Bulletin of the American Astronomical Society, 28, 825
- Kraemer, Crenshaw, & Gabel (2001) Kraemer, S. B., Crenshaw, D. M., & Gabel, J. R. 2001, ApJ, 557, 30
- Kriss, Peterson, Crenshaw, & Zheng (2000) Kriss, G. A., Peterson, B. M., Crenshaw, D. M., & Zheng, W. 2000, ApJ, 535, 58
- Krolik & Kriss (2001) Krolik, J. H. & Kriss, G. A. 2001, ApJ, 561, 684
- Krolik & Kriss (1995) Krolik, J. H. & Kriss, G. A. 1995, ApJ, 447, 512
- Krolik, McKee, & Tarter (1981) Krolik, J. H., McKee, C. F., & Tarter, C. B. 1981, ApJ, 249, 422
- Kuraszkiewicz & Green (2002) Kuraszkiewicz, J. K. & Green, P. J. 2002, ApJ, 581, L77
- Liedahl & Paerels (1996) Liedahl, D. A. & Paerels, F. 1996, ApJ, 468, L33
- Mathews & Ferland (1987) Mathews, W. G. & Ferland, G. J. 1987, ApJ, 323, 456
- Mathur, Elvis, & Wilkes (1995) Mathur, S., Elvis, M., & Wilkes, B. 1995, ApJ, 452, 230
- Mathur, et al. (1994) Mathur, S., Wilkes, B., Elvis, M., & Fiore, F. 1994, ApJ, 434, 493
- Mathur, Wilkes, & Elvis (1998) Mathur, S., Wilkes, B., & Elvis, M. 1998, ApJ, 503, L23
- Mathur, Elvis, & Wilkes (1999) Mathur, S., Elvis, M., & Wilkes, B. 1999, ApJ, 519, 605
- Mathur, Wilkes, & Aldcroft (1997) Mathur, S., Wilkes, B. J., & Aldcroft, T. 1997, ApJ, 478, 182
- Monier et al. (2001) Monier, E. M., Mathur, S., Wilkes, B., & Elvis, M. 2001, ApJ, 559, 675
- Murphy et al. (1996) Murphy, E. M., Lockman, F. J., Laor, A., & Elvis, M. 1996, ApJS, 105, 369
- Netzer (1996) Netzer, H. 1996, ApJ, 473, 781
- Netzer et al. (2002) Netzer, H., Chelouche, D., George, I. M., Turner, T. J., Crenshaw, D. M., Kraemer, S. B., & Nandra, K. 2002, ApJ, 571, 256
- Nicastro et al. (1999) Nicastro, F., Fiore, F., Perola, G. C., & Elvis, M. 1999, ApJ, 512, 184
- Nicastro, Fiore, & Matt (1999) Nicastro, F., Fiore, F., & Matt, G. 1999, ApJ, 517, 108
- Nicastro et al. (2002) Nicastro, F. et al. 2002, ApJ, 573, 157
- Nicastro et al. (2003) Nicastro, F. et al. 2003, Nature, 421, 719
- Otani et al. (1996) Otani, C. et al. 1996, PASJ, 48, 211
- Peterson et al. (1999) Peterson, B. M. et al. 1999, ApJ, 510, 659
- Peterson (1997) Peterson 1997, An Introduction to Active Galactic Nuclei (Cambridge: Cambridge university Press)
- Porquet & Dubau (2000) Porquet, D. & Dubau, J. 2000, A&AS, 143, 495
- Porquet, et al. (1999) Porquet, D., Dumont, A.-M., Collin, S., & Mouchet, M. 1999, A&A, 341, 58
- Reynolds (1997) Reynolds, C. S. 1997, MNRAS, 286, 513
- Reynolds & Fabian (1995) Reynolds, C. S. & Fabian, A. C. 1995, MNRAS, 273, 1167
- Rybicki & Lightman (1979) Rybicki, G. B. & Lightman, A. P. 1979, New York, Wiley-Interscience, 1979. 393 p.
- Sako et al. (2001) Sako, M. et al. 2001, A&A, 365, L168
- Smith, Brickhouse, Liedahl, & Raymond (2001) Smith, R. K., Brickhouse, N. S., Liedahl, D. A., & Raymond, J. C. 2001, ApJ, 556, L91
- Steenbrugge, Kaastra, de Vries, & Edelson (2003) Steenbrugge, K. C., Kaastra, J. S., de Vries, C. P., & Edelson, R. 2003, åaccepted(astro-ph/0302493)
- Turner et al. (1993) Turner, T. J., Nandra, K., George, I. M., Fabian, A. C., & Pounds, K. A. 1993, ApJ, 419, 127
- Verner, Verner, & Ferland (1996) Verner, D. A., Verner, E. M., & Ferland, G. J. 1996, Bulletin of the American Astronomical Society, 28, 907