Discovery of a Clustered Quasar Pair at z 5:
Biased Peaks in Early Structure Formation
Abstract
We report a discovery of a quasar at within a few Mpc of the quasar SDSS 0338+0021 at . The newly found quasar has the SDSS and magnitudes of , and an estimated absolute magnitude . The projected separation on the sky is 196 arcsec, and the redshift difference . The probability of finding this quasar pair by chance in the absence of clustering in this particular volume is . We conclude that the two objects probably mark a large-scale structure, possibly a protocluster, at . This is the most distant such structure currently known. Our search in the field of 13 other QSOs at so far has not resulted in any detections of comparable luminous QSO pairs, and it is thus not yet clear how representative is this structure at . However, along with the other evidence for clustering of quasars and young galaxies at somewhat lower redshifts, the observations are at least qualitatively consistent with a strong biasing of the first luminous and massive objects, in agreement with general predictions of theoretical models. More extensive searches for clustered quasars and luminous galaxies at these redshifts will provide valuable empirical constraints for our understanding of early galaxy and structure formation.
Subject headings:
cosmology: observations – galaxies: formation – quasars: general – quasars: individual (SDSS 0338+0021, RD 657)∗ Present address: Dept. of Astronomy, Univ. of Illinois, Urbana, IL 61801.
1. Introduction
Quasars at large redshifts represent a powerful probe of structure formation in the early universe. Dissipative mergers and tidal interactions during the early stages of galaxy assembly may be fueling both bursts of star formation and early AGN activity (see, e.g., Silk & Rees (1998), Franceschini et al. (1999), Monaco et al. (1999), Kauffmann & Haehnelt (2000), Granato et al. (2001), etc.). This fundamental connection is supported by the remarkable correlations between the masses of central black holes in nearby galaxies, and the velocity dispersions and luminosities ( masses) of their old, metal-rich stellar populations (Magorrian et al. (1998), Ferrarese & Merritt (2000), Gebhardt et al. (2000)), and by the high metallicities observed in the high- quasar spectra (Hamann & Ferland (1999), and references therein). Quasars can also be used directly to probe evolution of large-scale structure out to high redshifts, as demonstrated clearly by the 2QZ survey (Croom et al. (2001), Hoyle et al. (2002)).
There should also be a fundamental connection between the formation of galaxies and the large-scale density field in the early universe. The highest density peaks, where presumably the first luminous objects formed, should be strongly clustered, due to biasing (Kaiser (1984)). This is a generic and robust prediction for essentially every model of structure formation, independent of any astrophysical details of galaxy formation.
Luminous high- quasars are likely situated in massive hosts (Turner (1991)). Such massive halos should be rare, and may be associated with to - peaks of the primordial density field (Efstathiou & Rees (1988), Cole & Kaiser (1989), Nusser & Silk (1993)). High- quasars can thus be used as biased tracers of the early large-scale structure, possibly marking the cores of future rich clusters.
A search for protoclusters around known high- objects such as quasars thus provides an important test of our basic ideas about the biased galaxy formation. We have conducted a search for clustered protogalaxies and AGN in the fields of selected quasars at . Preliminary results from our program have been described by Djorgovski (1999) and Djorgovski et al. (1999), and a complete account will be presented elsewhere.
Here we present the discovery of a clustered quasar pair at , which we interpret as a signature of a primordial large-scale structure, possibly a core of a forming rich cluster. This is the most distant large-scale structure currently known. One of the quasars, SDSS 0338+0021, was discovered by Fan et al. (1999); the other was found in our much deeper search in its vicinity.
2. Observations and Data Reductions
Deep images of the field were obtained at the Palomar 200-inch Hale telescope using the prime-focus imager (Kells et al. (1998)). The instrument FOV is 9.7 arcmin square, with 0.286 arcsec pixels. Multiple dithered exposures totalling 1800 s, 3000 s, and 7200 s were obtained in Gunn , , and filters respectively on 29 and 30 November 2000 UT, and of 3600 s, 1800 s, and 2400 s in Gunn , , and filters respectively on 31 December 2000 UT, all in good conditions. The data were reduced using standard procedures. Limiting magnitudes (3- in a 3 arcsec apertures) are , , and mag in the SDSS () photometric system. Multi-color selection was used to identify candidates for objects at , as illustrated in Fig. 1. Details of the data reduction and candidate selection procedure will be presented elsewhere.
The first set of imaging data was used to select candidates for multi-slit spectroscopy, and spectra of several objects, including the known QSO (SDSS 0338+0021), were obtained at the WMKO Keck-I 10-m telescope on 29 December 2000 UT in good conditions. We used the LRIS instrument (Oke et al. (1995)) with a 400 lines mm-1 grating (Å) and a GG495 order sorting filter, through 1.2 arcsec wide slitlets, with a mean dispersion in the wavelength region of interest of Å pixel-1. Two exposures of 1800 s each were obtained through a single slitmask at a PA = 340∘, close to the parallactic angle at the time. Exposures of arc lamps were used for wavelength calibration, with the flexure shifts corrected using the measurements of selected night sky lines. An average of archival response curves for this grating was used for the flux calibration.
Only one high-priority color-selected candidate, which we designated RD 657 (for “red dropout” and a serial number in our CCD object catalog), could be accommodated on this slitmask. It turned out to be a quasar at . The position of this object (J2000) is:
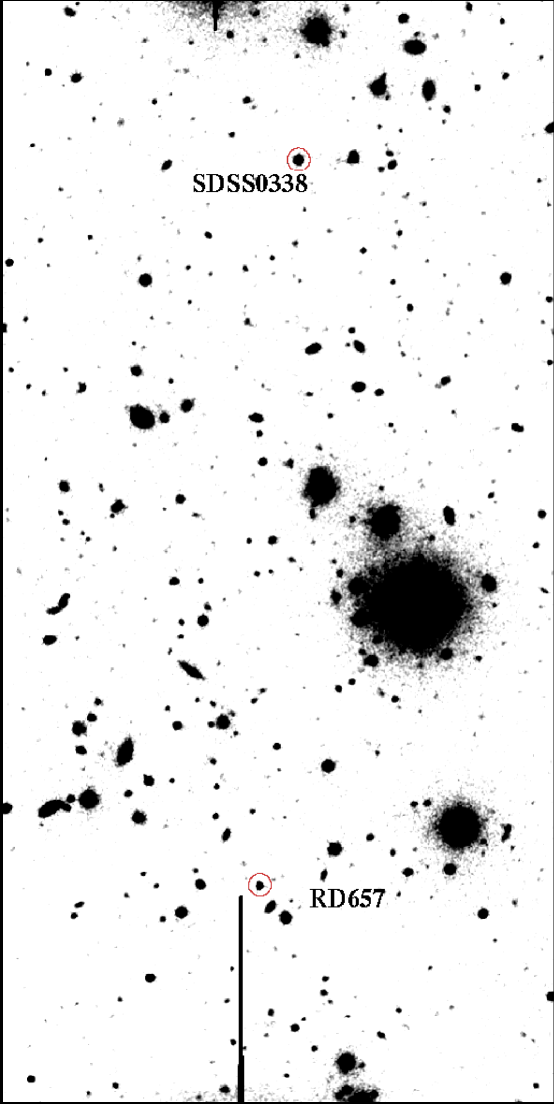
giving the projected separation from SDSS 0338+0021 of 196 arcsec. Setting the photometric zero-points on the magnitudes of SDSS 0338+0021 published by Fan et al. (1999), i.e., , , and , the magnitudes of the new QSO in the same SDSS system are , , and mag, with estimated uncertainties of mag, making it about 3.5 times fainter than the SDSS QSO. Fig. 2 shows the finding chart for the field, with both quasars marked.
Additional long-slit spectra of both objects were obtained using LRIS on 31 December 2000 UT in good conditions. We used a 600 lines mm-1 grating (Å) through a 1.0 arcsec wide slit, covering the wavelength range Å, with a mean dispersion in the wavelength region of interest of Å pixel-1. Two exposures of 1200 s were obtained for SDSS 0338+0021, and four exposures of 1200 s for RD 657, with the object dithered on the slit between the exposures. The slit PA was always close to the parallactic angle. Arc lamps were used for wavelength calibration, with the flexure shifts corrected using the measurements of selected night sky lines, and exposures of standard star Hiltner 600 were used for the flux calibration.
We rebinned both grating data sets to a common sampling grid of 2 Å pixel-1, smoothed with Gaussians with Å (lower than the optimal smoothing filter for these data, thus resulting in no loss of information). Fig. 3 shows the combined spectra of the two objects. The redshifts determined from the emission lines (taking into account the absorption of the blue side of Ly) are for SDSS 0338+0021, and for RD 657, with the large uncertainties due to the intrinsic difficulty of centering of broad emission lines. We also note the presence of a Lyman limit system at in the spectrum of the brighter QSO.
While absolute values of the redshifts cannot be measured very precisely, we used a simple cross-correlation to evaluate the redshift difference between the two objects. We excluded the portions of the spectra blueward of the centroids of the Ly lines, since the differences in the IGM absorption between the two lines of sight could significantly affect the results. We obtain , which corresponds to the restframe velocity difference of km s-1 (these are the formal errors; possible systematic errors due to the mismatch of the spectra are hard to estimate precisely, but could be of the same order). Looking for correlated absorption systems in the two spectra would require data with a higher S/N and a higher resolution.
We obtained preliminary spectra of a number of other, fainter, color-selected candidates in the field. While the results are still inconclusive, none of them are luminous AGN.
3. Discussion and Conclusions
In what follows, for the sake of consistency with the previous work we will use the “standard quasar cosmology” with km s-1 Mpc-1, , and .
In this cosmology, the observed angular separation of 196 arcsec corresponds to a projected spatial separation of proper Mpc, or comoving Mpc at . If we assume that the observed is due entirely to cosmological expansion, the radial separation is proper Mpc ( comoving). Quadratic sum of the two suggests a spatial separation of the two quasars of proper Mpc ( comoving). However, this interpretation of the observed redshift difference as being due only to the Hubble expansion is uncertain. If we did not have any radial separation information, we could estimate the spatial separation from the projected separation alone: statistically, for a pair randomly oriented in space, the ratio of the two is , so that the most probable spatial separation corresponding to our projected separation is proper Mpc ( comoving). In the discussion below (which is similar to that by Schneider et al. (2000)) we will consider both of these possibilities, i.e., comoving separations of Mpc (the cosmological expansion model) and Mpc (the deprojection model).
Individual quasars represent rare events in the general population of galaxies at any redshift; how likely is to have two of them so close together? In order to estimate the probability of finding such a close quasar pair by chance at this redshift, we use the evolving QSO luminosity function (QLF) by Fan et al. (2001). For SDSS 0338+0021, we adopt the absolute blue magnitude from Fan et al. (1999). Using the mean and magnitude difference of mag, we estimate for RD 657. The Fan et al. (2001) QLF gives a number density of Mpc-3 for quasars with at this redshift. The comoving volumes enclosed by spheres with radii equivalent to the physical separations of the quasars of 10.6 and 25.6 Mpc are Mpc3 and Mpc3, respectively.
The first question we can ask is, what is the a priori probability of finding such a close pair of QSOs at this redshift, regardless of the particular survey strategy? Assuming a Poissonian distribution of quasars, the probabilities of finding two QSOs at these luminosities in these volumes are and , respectively. A similar reasoning was applied to the two serendipitously discovered quasar pairs at (Schneider et al. 1994a , Schneider et al. (2000)).
However, the volume in which we found this pair was not selected at random: it is centered on a previously known QSO. We can thus ask an alternative question, which is specific for our experiment, namely, what is the probability that another QSO is found at random in this particular volume? (We note that the same answer would apply whether or not there is an already known QSO in its center.) The probabilities then become and , respectively. Thus, it is still unlikely that this pair represents a chance occurence, suggesting that there is some physical clustering present.
We note that as of early 2003, we observed a total of 14 fields of QSOs at covering the FOV arcmin diameter ( comoving Mpc in the cosmology used here) to a comparable depth. Our spectroscopic follow-up is still incomplete, and thus it would be premature to include this additional volume in the present computation, but to date no other cases of comparably bright QSO pairs have been found, suggesting that this system must be a relatively rare event. A full analysis and estimates of the QSO clustering and bias will be presented in a future paper, once the survey is complete.
We also note that in a deeper Keck survey of QSOs at , but covering a smaller FOV, arcmin2 ( comoving Mpc2) we found at least 2 AGN companions to the known, bright QSOs, with sub-Mpc separations (not gravitational lenses), as well as a number of clustered faint galaxy companions (Djorgovski (1999), Djorgovski et al. (1999), and in prep.).
The clustering strength cannot be meaningfully measured from a single pair of objects in a survey of as yet poorly defined coverage. With this caveat in mind, the small probability of a random occurrence of such a pair implies an effective which could be considerably greater than the observed pair separation, i.e., comoving Mpc. At low redshifts, there is some spread or results between different groups (see, e.g., Boyle & Mo (1993), Croom & Shanks (1996), or Sabbey et al. (2001)), but most authors find that the observed clustering length of quasars is comparable to that of galaxy groups, Mpc (Bahcall & Chokshi (1991); see Hartwick & Schade (1990) for a review and references). A standard parameterization of the evolution of clustering in comoving coordinates is given by the formula
where and is the evolution parameter. For our chosen cosmology, the expected value for the CDM cosmogony is , and this is consistent with observations of the evolution of galaxy clustering at (see, e.g., Carlberg et al. (2000)). Thus, one expects a strong in the clustering strength at higher redshifts, and in any model gravitational clustering is always expected to grow in time. How do we then explain the apparent in the strength of quasar clustering at high redshifts?
The most natural explanation is that quasars represent highly biased peaks of the density field, and that the bias itself evolves in time. Ever since the first detections of QSO clustering (e.g., Shaver (1984), Shanks et al. (1987), Iovino & Shaver (1988), Mo & Fang (1993), etc.) it was considered possible that QSOs represent biased tracers of the density field, but the evolution of such bias was not clear. La Franca et al. (1998) found a turn-up in the clustering strength of quasars even at redshifts as low as , but this was not confirmed in a much larger sample by Croom et al. (2001). Outram et al. (2003) find no evidence for an increase in the QSO clustering power spectrum amplitude out to .
The first hints of such an effect at high redshifts were provided by the three few-Mpc quasar pairs at , found in the statistically complete survey by Schneider et al. 1994b , as first pointed out by Djorgovski et al. (1993), and subsequently confirmed by more detailed analysis (Kundic (1997), Stephens et al. (1997)). Intriguingly, the frequency of the few-Mpc separation quasar pairs at lower redshifts is roughly what may be expected from normal galaxy clustering (Djorgovski (1991); see also Zhdanov & Surdej (2001)). There is even a hint of a possible superclustering of quasars at , on scales comoving Mpc (Djorgovski (1998)), comparable to the scales of the first Doppler peak in CMBR fluctuations. Observations of large numbers of field galaxies at also show a relatively strong clustering, with Mpc, comparable to the galaxy clustering at (Steidel et al. (1998), Adelberger et al. (1998)); this is also almost certainly a manifestation of biasing.
However, the bias should be even stronger at higher redshifts, and what is observed at should be even more pronounced at : the earliest massive galaxies, including quasar hosts, should be strongly clustered. An example may be the possible grouping of Ly emitters at in the Subary Deep Field (Ouchi et al. (2003), Shimasaku et al. (2003)). Strong increase in biasing at high redshifts is also indicated in numerous theoretical studies, e.g., by Brainerd & Villumsen (1994), Matarrese et al. (1997), Moscardini et al. (1998), Blanton et al. (2000), Magliocchetti et al. (2000), Valageas et al. (2001), Basilakos & Plionis (2001), etc. What these studies show is that a simple parameterization of the clustering evolution is inadequate, and that the evolution of the bias factor, , plays a key role. The effective bias factor generally increases with the redshift and the object mass (e.g., especially for the more luminous Lyman-break galaxies or the quasar hosts). For example, Croom et al. (2002) find a marginally stronger clustering for the brighter QSOs, which might be residing in more massive hosts, and thus be more biased.
The chief uncertainty in our current understanding and interpretation of the structure evolution at high redshift, as indicated by luminous objects we can observe, is the evolution of bias. Observations of the clustering of quasars and galaxies around them at and beyond can provide valuable empirical constraints in this endeavor. A better understanding of the primordial clustering of luminous sources is also important for models of the cosmic reionization (see Djorgovski et al. (2001) and references therein), and thus for the interpretation of CMBR fluctuations at high angular frequencies. The quasar pair described here may be indicative of the biased clustering at , and more extensive and deeper surveys will provide additional observational input for the models of galaxy and large-scale structure formation.
References
- Adelberger et al. (1998) Adelberger, K., Steidel, C., Giavalisco, M., Dickinson, M., Pettini, M., & Kellogg, M. 1998, ApJ, 505, 18
- Bahcall & Chokshi (1991) Bahcall, N., & Chokshi, A. 1991, ApJ, 380, L9
- Basilakos & Plionis (2001) Basilakos, S., & Plionis, M. 2001, ApJ, 550, 522
- Blanton et al. (2000) Blanton, M., Cen, R., Ostriker, J., Strauss, M., & Tegmark, M. 2000, ApJ, 531, 1
- Boyle & Mo (1993) Boyle, B., & Mo, H.J. 1993, MNRAS, 260, 925
- Brainerd & Villumsen (1994) Brainerd, T., & Villumsen, J. 1994, ApJ, 431, 477
- Carlberg et al. (2000) Carlberg, R., Yee, H., Morris, S., Lin, H., Hall, P., Patton, D., Sawicki, M., & Shepherd, C. 2000, ApJ, 542, 57
- Croom & Shanks (1996) Croom, S., & Shanks, T. 1996, MNRAS, 281, 893
- Croom et al. (2001) Croom, S., Shanks, T., Boyle, B., Smith, R., Miller, L., Loaring, N., & Hoyle, F. 2001, MNRAS, 325, 483
- Croom et al. (2002) Croom, S., Boyle, B., Loaring, N., Miller, L., Outram, P., Shanks, T., & Smith, R., 2001, MNRAS, 335, 459
- Cole & Kaiser (1989) Cole, S. & Kaiser, N. 1989, MNRAS, 237, 1127
- Djorgovski (1991) Djorgovski, S.G. 1991, in: The Space Distribution of Quasars, ed. D. Crampton, ASPCS, 21, 349
- Djorgovski et al. (1993) Djorgovski, S., Thompson, D., & Smith, J. 1993, in: First Light in the Universe, eds. B. Rocca-Volmerange et al. , p.67, Gif sur Yvette: Eds. Frontières
- Djorgovski (1998) Djorgovski, S.G. 1998, in: Fundamental Parameters in Cosmology, eds. Y. Giraud-Heraud et al. , p.313, Gif sur Yvette: Eds. Frontières
- Djorgovski et al. (1999) Djorgovski, S.G., Odewahn, S.C., Gal, R.R., Brunner, R., & de Carvalho, R. 1999, in: Photometric Redshifts and the Detection of High Redshift Galaxies, eds. R. Weymann et al. , ASPCS, 191, 179
- Djorgovski (1999) Djorgovski, S.G. 1999, in: The Hy-Redshift Universe: Galaxy Formation and Evolution at High Redshift, eds. A. Bunker & W. van Breugel, ASPCS, 193, 397
- Djorgovski et al. (2001) Djorgovski, S.G., Castro, S., Stern, D., & Mahabal, A. 2001, ApJ, 560, L5
- Efstathiou & Rees (1988) Efstathiou, G., & Rees, M. 1988, MNRAS, 230, P5
- Fan et al. (1999) Fan, X., et al. (the SDSS Collaboration) 1999, AJ, 118, 1
- Fan et al. (2001) Fan, X., et al. (the SDSS Collaboration) 2001, AJ, 121, 54
- Ferrarese & Merritt (2000) Ferrarese, L., & Merritt, D. 2000, ApJ, 539, L9
- Franceschini et al. (1999) Franceschini, A., Hasinger, G., Miyaji, T., & Malquori, D. 1999, MNRAS, 310, L5
- Gebhardt et al. (2000) Gebhardt et al. 2000, ApJ, 539, L13
- Granato et al. (2001) Granato, G., Silva, L., Monaco, P., Salucci, P., De Zotti, G., & Danese, L. 2001, MNRAS, 324, 757
- Hamann & Ferland (1999) Hamann, F., & Ferland, G. 1999, ARAA, 37, 487
- Hartwick & Schade (1990) Hartwick, F.D.A., & Schade, D. 1990, ARAA, 28, 437
- Hoyle et al. (2002) Hoyle, F., Outram, P., Shanks, T., Croom, S., Boyle, B., Loaring, N., Miller, L., & Smith, R. 2002, MNRAS, 329, 336
- Iovino & Shaver (1988) Iovino, A., & Shaver, P. 1988, ApJ, 330, L13
- Kaiser (1984) Kaiser, N. 1984, ApJ, 284, L9
- Kauffmann & Haehnelt (2000) Kauffmann, G. & Haehnelt, M. 2000, MNRAS, 311, 576
- Kells et al. (1998) Kells, W., Dressler, A., Sivaramakrishnan, A., Carr, D., Koch, E., Epps, H., Hilyard, D., & Pardeilhan, G. 1998, PASP, 110, 1487
- Kundic (1997) Kundic, T. 1997, ApJ, 482, 631
- La Franca et al. (1998) La Franca, F., Andreani, P., & Cristiani, S. 1998, ApJ, 497, 529
- Magliocchetti et al. (2000) Magliocchetti, M., Bagla, J., Maddox, S., & Lahav, O. 2000, MNRAS, 314, 546 MNRAS, 286, 115
- Magorrian et al. (1998) Magorrian, J. et al. 1998, AJ, 115, 2285
- Matarrese et al. (1997) Matarrese, S., Coles, P., Lucchin, F., & Moscardini, L. 1997, MNRAS, 286, 115
- Mo & Fang (1993) Mo, H.J., & Fang, L.Z. 1993, ApJ, 410, 493
- Monaco et al. (1999) Monaco, P., Salucci, P., & Danese, L. 2000, MNRAS, 311, 279
- Moscardini et al. (1998) Moscardini, L., Coles, P., Lucchin, F., & Matarrese, S. 1998, MNRAS, 299, 95
- Nusser & Silk (1993) Nusser, A., & Silk, J. 1993, ApJ, 411, L1
- Oke et al. (1995) Oke, J. B. et al. 1995, PASP, 107, 375
- Ouchi et al. (2003) Ouchi, M. et al. 2003, ApJ, 582, 60
- Outram et al. (2003) Outram, P., Hoyle, F., Shanks, T., Croom, S., Boyle, B., Miller, L., Smith, R., & Myers, A. 2003, MNRAS, in press
- Sabbey et al. (2001) Sabbey, C., Oemler, A., Coppi, P., Bongiovanni, A., Bruzual, G., Garcia, C., Musser, J., Rengstorf, A., & Snyder, J. 2001, ApJ, 548, 585
- (45) Schneider, D., Schmidt, M., & Gunn, J. 1994, AJ 107, 880
- (46) Schneider, D., Schmidt, M., & Gunn, J. 1994, AJ 107, 1245
- Schneider et al. (2000) Schneider, D., et al. (the SDSS Collaboration) 2000, AJ, 120, 2183
- Shanks et al. (1987) Shanks, T., Fong, R., Boyle, B., & Peterson, B. 1987, MNRAS, 227, 739
- Shaver (1984) Shaver, P. 1984, A&A, 136, L9
- Shimasaku et al. (2003) Shimasaku, K. et al. 2003, ApJ, 586, L111
- Silk & Rees (1998) Silk, J., & Rees, M. 1998, A&A, 331, L1
- Songaila et al. (1999) Songaila, A., Hu, E., Cowie, L., & McMahon, R. 1999, ApJ, 525, L5
- Steidel et al. (1998) Steidel, C., Adelberger, K., Dickinson, M., Pettini, M., & Kellogg, M. 1998, ApJ, 492, 428
- Stephens et al. (1997) Stephens, A., Schneider, D., Schmidt, M., Gunn, J., & Weinberg, D. 1997, AJ, 114, 41
- Turner (1991) Turner, E. 1991, AJ, 101, 5
- Valageas et al. (2001) Valageas, P., Silk, J., & Schaefer, R. 2001, A&A, 366, 363
- Zhdanov & Surdej (2001) Zhdanov, V., & Surdej, J. 2001, A&A, 372, 1