Disks around the Young Stars TW Hya and HD 100546 Imaged at 3.4 Millimeters with the Australia Telescope Compact Array
Abstract
We present observations of the young stars TW Hya and HD 100546 made with the Australia Telescope Compact Array at 89 GHz with resolution and mJy continuum sensitivity. Compact thermal dust continuum emission is detected from disks surrounding both stars. HD 100546 also shows hints of extended emission, presumably a residual protostellar envelope, which is also visible in scattered light at optical wavelengths. For TW Hya, HCO+ J=1–0 line emission from the circumstellar disk is detected and spatially resolved. The observed size and intensity are in good agreement with model calculations based on an irradiated disk with substantial depletions derived previously from single dish observations of higher-J HCO+ transitions.
1 Introduction
Many young stars exhibit emission from circumstellar dust particles distributed in disks with properties similar to the early Solar System, and much activity is currently devoted to characterizing the physical properties of these disks to extract information on planet formation. Observations at millimeter wavelengths are especially important because the disk material beyond a few stellar radii is at temperatures from a few hundreds to a few tens of degrees, and the physical and chemical conditions can be probed in detail in this part of the spectrum (see reviews by Beckwith & Sargent 1996, Wilner & Lay 2000, Langer et al. 2000).
The recent upgrade of the Australia Telescope Compact Array (ATCA) with receivers for the 3 mm atmospheric window provides a new opportunity for high resolution imaging of protoplanetary disks located in the southern sky that are difficult or impossible to observe with the millimeter arrays located in the northern hemisphere. The ATCA millimeter-wave upgrade is in progress, and the completed facility will ultimately rival the northern interferometers in sensitivity and angular resolution (see Wong & Melatos 2002 for a more complete description). Now, three of the array antennas are equipped with 3 mm band InP MMIC receivers, and an interim local oscillator system allows for tuning in two ranges between 85 and 91 GHz. We present interferometric observations of dust continuum and HCO+ J=1–0 line emission at 89 GHz from two southern disk targets: (1) TW Hya, the closest known classical T Tauri star, and (2) HD 100546, a nearby Herbig Be star whose infrared spectrum shows crystalline silicates, indicative of comet-like dust.
TW Hya has received a lot of recent observational attention, largely on account of its close proximity. At a distance of pc (Hipparcos), TW Hya is almost three times closer than the classical T Tauri stars associated with nearby dark clouds like Taurus and Ophiucus, which makes it an especially attractive target for observations with high angular resolution. At an age of Myr, the TW Hya disk appears to be substantially evolved, with indications of significant grain growth. TW Hya is isolated from any molecular cloud but retains a face-on molecular disk visible in scattered light (Krist et al. 2000, Trilling et al. 2001, Weinberger et al. 2002) that extends to a radius of at least (200 AU). The inner disk of TW Hya has been resolved in dust emission by the VLA at 7 mm (Wilner et al. 2000), and its spectral energy distribution has been modeled extensively (Calvet et al. 2001). The available data are well fitted by an irradiated accretion disk with a developing gap of radius AU, interior to which dust coagulation and settling have rendered the disk optically thin.
The isolation of the TW Hya system from any surrounding molecular cloud material facilitates the study of its physical and chemical structure. The TW Hya disk has been detected in a suite of molecular species (CO, HCN, CN, and HCO+) at submillimeter wavelengths using single dish telescopes (Kastner et al. 1997, van Zadelhoff et al. 2001). More recent, deeper, observations have also detected emission from H13CO+ and DCO+, which indicate deuterium fractionation in the disk similar to cold cores and pristine cometary material (van Dishoeck et al. 2003). So far, no observations have been made that spatially resolve the molecular gas surrounding TW Hya. Such spatially resolved observations are important to verify underlying constructs of the models used to interpret the single dish data, since the physical conditions are subject to strong radial and vertical gradients, which result in considerable chemical complexity.
HD 100546, among the nearest Herbig Ae/Be stars at pc (Hipparcos), appears nearby the dark cloud DC296.2-7.9 (Hu, The & de Winter 1989) and shows a disk-like scattered light distribution (Pantin, Waelkens & Lagage 2000, Augereau et al. 2001, Grady et al. 2001) of substantial size, about (8000 AU), as well as strong millimeter emission from dust (Henning et al. 1994, 1998). This relatively isolated system is thought to have an age of Myr (van den Ancker et al. 1997). However, analysis of the full spectral energy distribution suggests the presence of an extended envelope (Henning et al. 1994). Mid-infrared spectroscopy from ISO shows remarkably strong crystalline silicate bands, similar to those observed in comet Hale-Bopp (Malfait et al. 1998) and indicative of unusual and substantial processing of the dust within the disk (Bouwman et al. 2003). Millimeter interferometry has the potential to show directly the presence of a disk component that contains the bulk of the system mass.
2 Observations
We observed TW Hya and HD 100456 at 89 GHz (3.4 mm) with the ATCA during the 2002 austral winter using two compact configurations of three 22 meter diameter antennas equipped with millimeter receivers. Table 1 summarizes the observational parameters.
The ATCA observations provided 6 independent east-west baselines with lengths ranging from 22 to 230 meters, resulting in resolution. For each observation, the target pointing center was set to be west of the star position. The digital correlator was configured for two dual polarization bands: (1) a wide band with 33 channels spanning the maximum bandwidth of 128 MHz for continuum sensitivity, and (2) a narrow band with 256 channels over 16 MHz to provide high frequency resolution on the HCO+ J=1–0 line, which is one of the few potentially detectable spectral lines accessible to the interim system. The sky signal is mixed with a Gunn oscillator locked at 80505.5 MHz and passed through an X-band (8000-10800 MHz) filter and splitter module, which results in an accessible frequency range of 88.506 to 91.305 GHz. A new local oscillator system under construction will allow coverage of the frequency range 85 to 105 GHz, with a possible extension to 115 GHz.
All calibration and imaging was performed with the MIRIAD software. Complex gains were derived from frequent observations of nearby quasars. Because the narrow band provided low signal-to-noise ratios on the quasars, a phase offset between the wide band and narrow band was determined from short observations of a strong source on each day, either J0423-012 or J0538-440. These short observations of strong sources were also used to determine the bandpass response. For TW Hya, additional weaker quasars located close to the star were included in the observing sequence to provide an empirical check on the atmospheric seeing and effectiveness of the phase calibration. Typical system temperatures were 300 to 400 K (SSB), with higher values at low elevations. The flux densities were set with reference to the planet Mars; the scatter in derived fluxes on consecutive days suggests uncertainties of approximately 20%.
Images were made of the sum of the two linear polarizations using natural weighting to obtain best sensitivity. All images were cleaned to a cutoff of twice the r.m.s. noise level. Because Doppler tracking was not applied during the observations, the correspondence between individual frequency channels and velocity changes with time during the course of the observations. Therefore, the spectral data were imaged in resampled velocity bins of 0.5 km s-1 width, coarse compared to these changes, rather than individual frequency channels.
3 Results
3.1 TW Hya
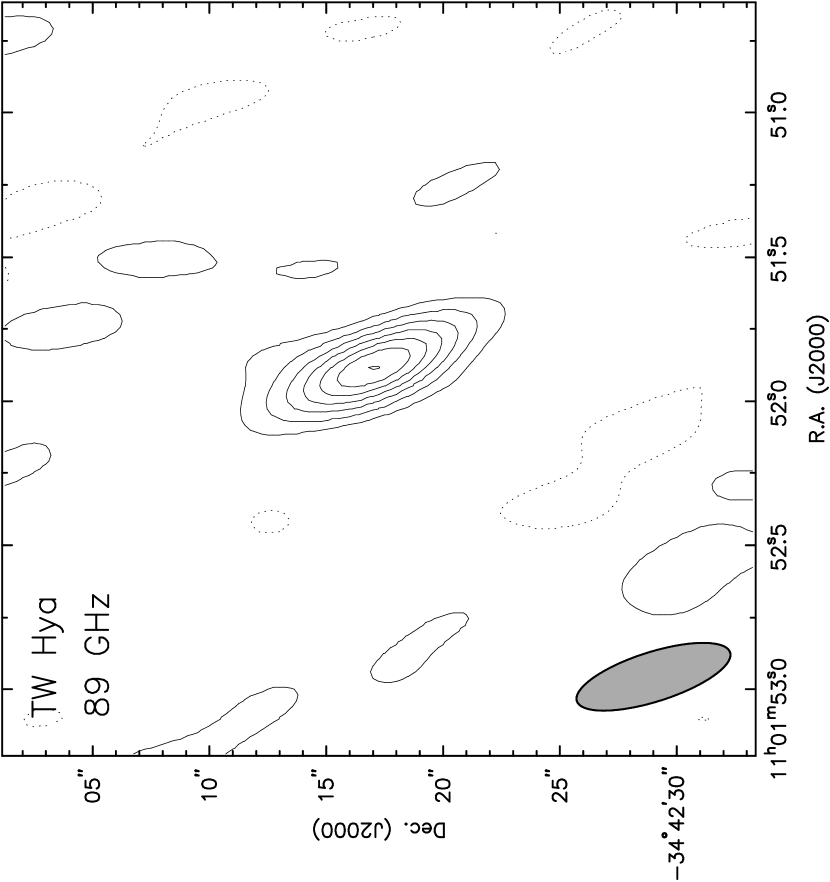
Figure 1 shows the 89 GHz continuum emission detected from TW Hya. The position is coincident with the optical star and radio detections at longer wavelengths. A Gaussian fit to the visibilities gives a flux of mJy (random error only) and an apparent size consistent with an unresolved source slightly broadened by the phase noise on the longer baselines. This Gaussian fit is also compatible with the extended disk seen in scattered light, since the dust emission from the circumstellar disk is strongly centrally peaked by the combination of low opacity and increasing column density and temperature towards the star (see Mundy et al. 1996; Wilner et al. 2000).
The TW Hya 89 GHz continuum flux measurement agrees well with expectations from previously reported measurements at both higher (350 GHz) and lower (43 GHz) radio frequencies (Weintraub, Sandell & Duncan 1989, Wilner et al. 2000, Wilner 2001). In addition, it is consistent with predictions of various disk models based on the radio observations that contain a population of large dust grains to account for the shallow spectral slope with power law index observed in this frequency range (Trilling et al. 2001, Calvet et al. 2002). The good fit of the new 89 GHz measurement with expectations gives confidence in the reliability of the ATCA system, and the accuracy of the absolute flux scale.
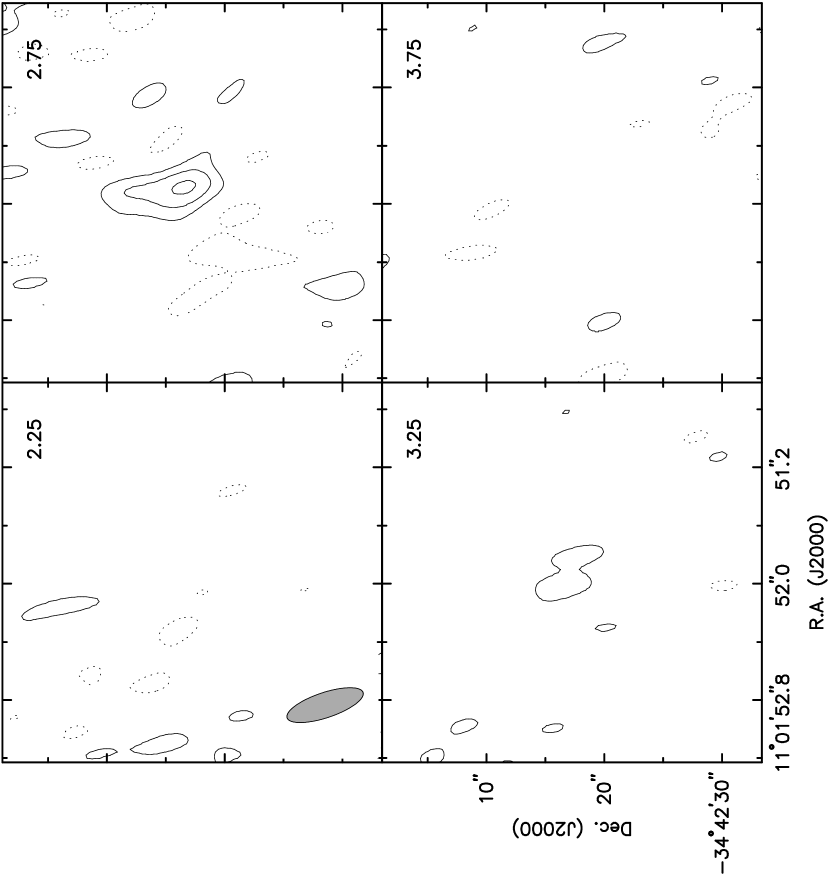
Figure 2 shows a series of images in four velocity bins for the HCO+ J=1–0 line emission near LSR velocity km s-1. A narrow line emission feature is clearly visible at the stellar position with a velocity and linewidth commensurate with previously reported molecular line detections from the face-on disk, which have =2.9 km s-1 and km s-1. Figure 3 shows the spectrum at the continuum position. The peak line flux at 0.5 km s-1 resolution is 0.40 Jy, which corresponds to a brightness temperature of 4.3 K in the beam. The line emission from the disk is clearly spatially resolved; a circular Gaussian fit to the visibilities in a 0.5 km s-1 bin gives a full-width at half maximum size of .
3.2 HD 100546
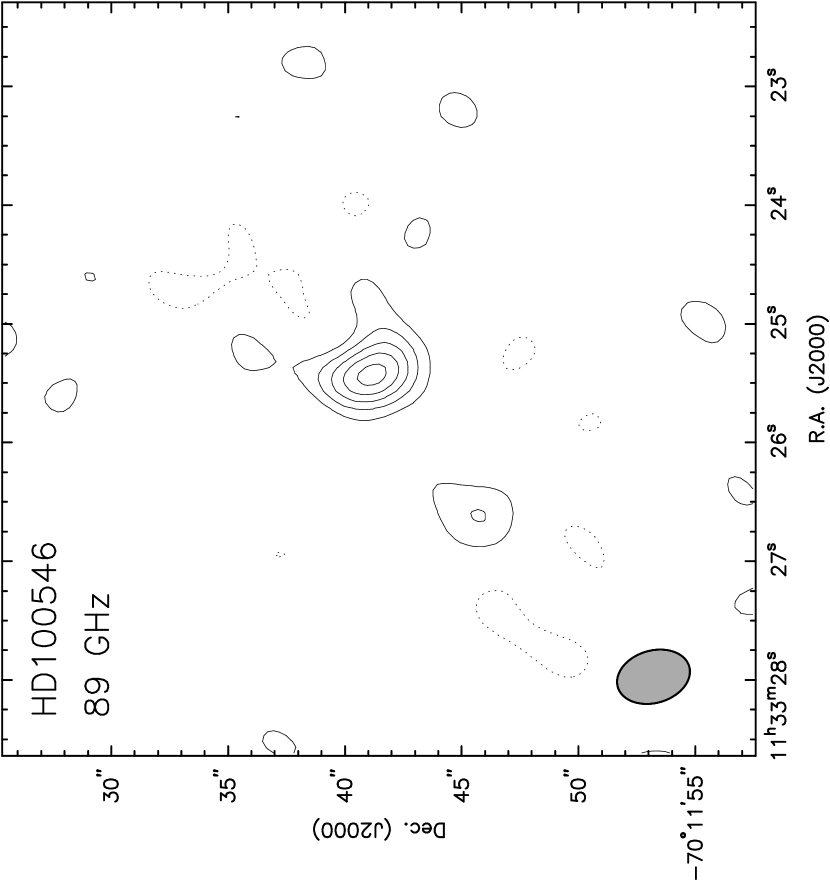
Figure 4 shows the 89 GHz continuum emission detected from HD 100546. The peak position is coincident with the star to better than . A fit to the visibilities gives a point source flux of mJy at the star position. The residuals to this fit provide a hint that additional emission is present. The image shows an extra peak of low significance located to the southeast. This additional peak may be related to the slight extension seen in the single dish 1.3 mm bolometer image of Henning et al. (1998). Extensions along the same position angle are also visible in scattered light, in particular in the sensitive HST/STIS images of Grady et al. (2001), where nebulosity can be seen to extend from the northwest to the southeast. No line emission is detected to a limit of 0.17 Jy per channel (), either at the LSR velocity of the cloud DC296.2-7.9 of 3.6 km s-1 (Otrupcek, Hartley & Wang 2000), or at the stellar LSR velocity of about -1 km s-1, which derives from the heliocentric “astrometric” radial velocity of km s-1 determined from Hipparcos (Madsen 2002).
4 Discussion
4.1 TW Hya
The spatially resolved observations of the HCO+ J=1–0 emission from TW Hya allow for a check of the basic paradigm that trace molecules are present in an extended upper layer of the disk, with overall abundances depleted with respect to molecular hydrogen by large factors by comparison with those of interstellar dark clouds (Aikawa & Herbst 1999, Willacy & Langer 2000, Aikawa et al. 2002). In the disk midplane, which contains most of the mass, the combination of high densities and low temperatures results in nearly all trace molecules sticking to grain surfaces and disappearing from the gas. At the disk surface, the molecules are photo-dissociated. In between, below the surface, is a layer that is warm and shielded from stellar radiation and activity where molecules survive and abundances peak.
The TW Hya disk structure and chemistry has been considered in detail by van Zadelhoff et al. (2001), whose model calculations suggest that the depletion of species like CO and HCO+ results from a combination of photodissociation in the warm surface layers and freezing-out in the cold, dense parts of the disk. In these models, the molecular emission largely originates from the region just below the disk surface where the HCO+ abundance climbs to a few times . In general, the HCO+ abundance follows the CO abundance in the disk, since its formation is primarily from CO reacting with H, with destruction by dissociative recombination with free electrons.
Figure 5 shows the visibility amplitude of the HCO+ J=1–0 emission from TW Hya as a function of baseline length; the falloff at longer baselines demonstrates that the emission region is resolved. A circular Gaussian FWHM “size” of provides a crude description of the full line brightness distribution. Figure 5 includes the visibility amplitudes derived from four of the favored models of van Zadelhoff et al. (2001), which provide reasonable fits to higher-J HCO+ single dish observations. Two models are based on the radiatively heated accretion disk structure of D’Alessio et al. (1999), and two models are based on the passive two-layer description of Chiang & Goldreich (1997). Two chemical scenarios are presented for each of these physical models. The interstellar HCO+ abundance is assumed to be , and in one model HCO+ is depleted by a factor of 100 with an additional order of magnitude drop when the temperature falls below 20 K, while in another model HCO+ is depleted by a factor of 500 throughout. Table 2 summarizes the models. Figure 5 shows that all of these models, which have disk masses of 0.03 and disk radii of 200 AU, agree well with the ATCA observations, for both the size scale and the absolute intensity of the HCO+ line emission. (Note that visibility amplitude is a positive definite quantity, which results in a positive bias in Figure 5.)
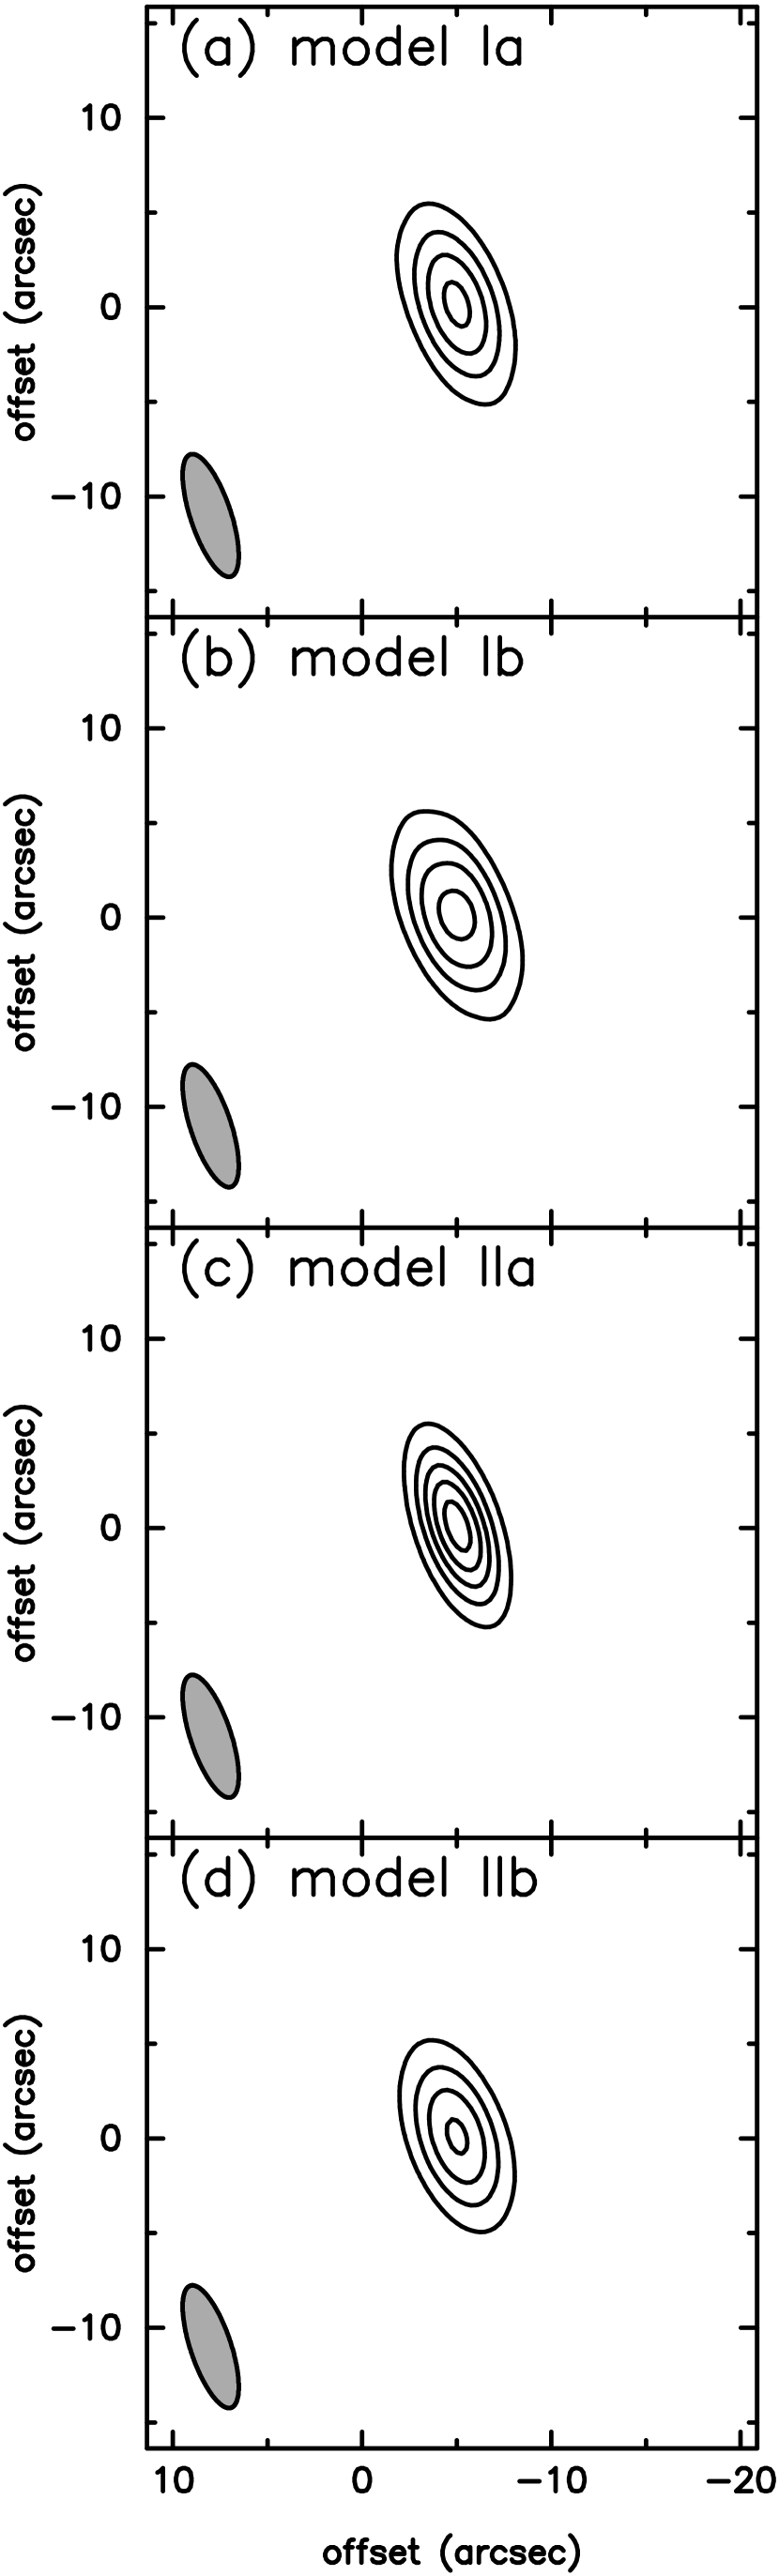
Figure 6 provides another view of the four models in the form of synthetic images. These images were made by sampling each of the models with the same visibility distribution as obtained by the ATCA observations, taking a 0.5 km s-1 bin centered on the line. These images may be compared with the panel in Figure 2 for LSR velocity 2.75 km s-1, where the line emission peaks. In this view, it is not easy to see that the line emission is well resolved spatially, but the similarity of the models in overall brightness and spatial extent is clearly apparent.
While none of the models of van Zadelhoff et al. (2001) were fine-tuned to match all of the available constraints, and none provides a unique best fit to the ATCA data, the high HCO+ depletion factors are a robust feature. All four models are indistinguishable within the noise of the observations, though there are differences in detail in the visibility distributions among the models. There is perhaps a hint that the models that produce the more concentrated emission distributions are best. The model curves in Figure 5 suggest that resolved observations with better signal-to-noise have the potential to discriminate between subtly different physical and chemical scenarios.
HCO+ depletions of an order of magnitude or more have been inferred for other T-Tauri systems from millimeter imaging and analysis, in particular the disks around the GG Tau binary (Guilloteau, Dutrey & Simon 1999) and around LkCa15 (Duvert et al. 2000, Qi 2001). These isolated pre-main-sequence systems are located in holes of the Taurus dark cloud complex, which make their disks readily accessible without confusion. The radii of the gas disks in these systems, 800 AU and 600 AU, respectively, are among the largest known, and larger by factors of 3 to 4 than the AU radius disk surrounding TW Hya. That the depletion is similarly high in all of these disks provides further evidence that substantial depletion must occur in the dense shielded midplane material, rather than simply in the colder, outer parts of the disks.
Since the critical density of the HCO+ J=1–0 line for collisional excitation is cm-3, the detection of extended emission indicates high densities must be present to large radii, independent of any detailed physical and chemical model for the disk. This in situ measurement of local density confirms indications from scattered light models and also analysis of dust emission that relied on extrapolation of the inner disk density distribution. Resolved images of multiple transitions of multiple species may be used to constrain the disk mass (see Dutrey, Guilloteau and Guelin 1997).
4.2 HD 100546
For HD 100546, the spherical radiative transfer models of Henning et al. (1994) that reproduce the far-infrared emission do not account for the observed millimeter flux, even with a population of “fluffy” dust grains, which suggests that a circumstellar disk component must be present in the system. The compact 89 GHz dust continuum emission detected in the ATCA observations provides direct evidence for this disk. An extrapolation of the 1.3 mm flux of 0.69 Jy (Henning et al. 1998) to 89 GHz gives 40 mJy, for a dust opacity power law index near unity, compared with our detected flux of mJy. Thus, the disk component nominally accounts for a substantial fraction of the detected 89 GHz flux, though the uncertainties are large. Detailed modeling of the disk properties awaits additional millimeter and submillimeter observations with sufficient angular resolution to separate the disk and envelope components.
The similar continuum fluxes of HD 100546 and TW Hya suggest that the disk in the more distant and warmer HD 100546 system is substantially more massive than the disk around TW Hya. Since HCO+ J=1-0 emission is not detected from HD 100546 with comparable sensitivity to the TW Hya detection, it is likely that the abundance reduction is even more extreme. Perhaps photodissociation of CO in the disk atmosphere is enhanced in the environment of this more massive, hotter star.
Grady et al. (1997) suggest that much of the accreting gas seen in the optical along the line-of-sight to HD 100546 is associated with star-grazing planetesimals, such as comets or asteroids. This may explain both the lack of observed boundary-layer emission, which might be expected from accretion of mostly gaseous material, and signatures of bipolar outflow in forbidden line emission that is characteristic of an optically thick, gaseous accretion disk. This fact, together with the non-detection of HCO+ emission and the highly processed nature of the dust around HD 100546, perhaps indicates that the gas is nearly fully depleted in the disk, in which case the planet building process may be well advanced.
5 Conclusions
We have made high resolution observations of the nearby young stars TW Hya and HD 100546 with the ATCA using three antennas equipped at 89 GHz. These observations indicate the promise for future millimeter-wave observations of protoplanetary disks located deep in the southern sky. The observations of the TW Hya disk resolve emission from the HCO+ J=1–0 line, and the measured extent and brightness support disk models with high depletion factors inferred from previous, spatially unresolved, measurements of higher J transitions. The detailed modeling of the TW Hya disk represents a first step towards probing the gas content of this important system, whose dispersal and chemistry may be similar to the early Solar System. A more complete understanding of the details of disk chemistry will require spatially resolved images with higher sensitivity, eventually sampling species that probe all of the relevant chemical families.
Thermal dust continuum emission from these sources was easily detected and promises to be resolved with observations using longer baselines. The available ATCA antenna stations will offer baselines up to 1.5 km in length, corresponding to an angular resolution better than at this frequency, which will be adequate to probe the disk surface density and to start to disentangle disk structure from opacity effects. Both TW Hya and HD 100546 will be prime protoplanetary disk targets for the Atacama Large Millimeter Array, the next generation millimeter interferometer sited in northern Chile, whose construction has just started and will continue for the next decade.
References
- (1)
- (2) Aikawa, Y. & Herbst, E. 1999, A&A, 351, 233
- (3)
- (4) Aikawa, Y., van Zadelhoff, G.J., van Dishoeck, E.F., Herbst, E. 2002, A&A, 386, 622
- (5)
- (6) Augereau, J.C., Lagrange, A.M., Mouillet, D., Menard, F. 2001, A&A, 365, 78
- (7)
- (8) Beckwith, S.V.W. & Sargent, A.I., Nature, 383, 139
- (9)
- (10) Bouwman, J., de Koter, A., Dominik, C., Waters, L.B.F.M. 2003, A&A, in press (astro-ph/0301254)
- (11)
- (12) Calvet, N., D’Alessio, P., Hartmann, L., Wilner, D., Walsh, A., Sitko, M. 2002, ApJ, 568, 1008
- (13)
- (14) d’Alessio, P., Calvet, N., Hartmann, L., Susana, L., Jorge, C. 1999, ApJ, 527, 893
- (15)
- (16) Dutrey, A., Guilloteau, S., Guelin, M. 1997, A&A, 317, L55
- (17)
- (18) Duvert, G., Guilloteau, S., Menard, F., Simon, M., Dutrey, A. 2000, A&A, 355, 165
- (19)
- (20) Grady, C.A., Sitko, M.L., Bjorkman, K.S., Perez, M.R., Lynch, D.K., Russell, R.W., Hanner, M.S. 1997, ApJ, 483, 449
- (21)
- (22) Grady, C.A. et al. 2001, AJ 122, 3396
- (23)
- (24) Guilloteau, S., Dutrey, A., Simon, M. 1999, A&A, 348, 570
- (25)
- (26) Henning, Th., Launhardt, R., Steinacker, J., Thamm, E. 1994, A&A, 291, 546
- (27)
- (28) Henning, Th., Burkert, A., Launhardt, R., Leinert, Ch., Stecklum, B. 1998, A&A, 336, 565
- (29)
- (30) Hu, J.Y., The, P.S. & de Winter, D. 1989, A&A, 208, 213
- (31)
- (32) Kastner, J.H., Zuckerman, B., Weintraub, D.A. & Forveille, T. 1997, Science, 277, 67
- (33)
- (34) Krist, J.E., Stapelfeldt, K.R., Menard, F., Padgett, D.L., Burrows, C.J. 2000, ApJ, 538, 793
- (35)
- (36) Langer, W.D., van Dishoeck, E.F., Bergin, E.A., Blake, G.A., Tielens, A.G.G.M., Velusamy, T., Whittet, D.C.B., in Protostars and Planets IV, eds. V. Mannings, A. Boss and S. Russell 2000 (Tucson: University of Arizona Press), p. 29
- (37)
- (38) Madsen, S. 2002, Ph.D. Thesis, Lund University
- (39)
- (40) Malfait, K., Waelkens, C., Waters, L.B.F.M., Vandenbussche, B., Huygen, E., de Graauw, M.S. 1998, A&A, 332, L25
- (41)
- (42) Mundy, L.G., Looney, L.W., Erickson, W. Grossman, A., Welch, W.J., Forster, J.R., Wright, M.C.H., Plambeck, R.L., Lugten, J., Thornton, D.D. 1996, ApJ, 464, L169
- (43)
- (44) Otrupcek, R.E., Hartley, M., Wang, J.-S. 2000, Pub. Astron. Society Australia, 17, 92
- (45)
- (46) Pantin, E., Waelkens, C., Lagage, P.O. 2000, A&A, 361, L9
- (47)
- (48) Qi, C. 2001, Ph.D. thesis, California Institute of Technology
- (49)
- (50) Trilling, D.E., Koerner, D.W., Barnes, J.W., Ftaclas, C., Brown, R.H. 2001, ApJ, 552, L151
- (51)
- (52) van den Ancker, M.E., The, P.S., Tjin A Djie, H.R.E., Catala, C., de Winter, D., Blondel, P.F.C., Waters, L.B.F.M. 1997, A&A, 324, L33
- (53)
- (54) van Dishoeck, E.F., Thi, W.F., van Zadelhoff, G.J. 2003, A&A, 400, L1
- (55)
- (56) van Zadelhoff, G.-J., van Dishoeck, E.F., Thi, W.-F., Blake, G. A. 2001, A&A, 377, 566
- (57)
- (58) Weinberger, A.J., Becklin, E.E., Schneider, G., Chiang, E. I., Lowrance, P.J., Silverstone, M., Zuckerman, B., Hines, D.C., Smith, B.A. 2002, ApJ, 566, 409
- (59)
- (60) Weintraub, D.A., Sandell, G. & Duncan, W. 1989, ApJ, 340, L69
- (61)
- (62) Willacy, K. & Langer, W.D. 2000, ApJ, 544, 903
- (63)
- (64) Wilner, D.J. and Lay, O.P. 2000, “Subarcsecond Millimeter and Submillimeter Observations of Circumstellar Disks”, in Protostars and Planets IV, eds. V. Mannings, A. Boss and S. Russell (Tucson: University of Arizona Press), p. 509
- (65)
- (66) Wilner, D.J., Ho, P.T.P., Kastner, J.H. and Rodriguez, L.F. 2000, ApJ, 534, L101
- (67)
- (68) Wilner, D.J. 2001, “Millimeter Observations of the TW Hya System”, in Young Stars Near Earth: Progress and Prospects, eds. R. Jayawardhana and T. Greene, p. 191
- (69)
- (70) Wong, T., Melatos, A. 2002, Publ. Astron. Soc. Aust., 19, 475
- (71)
| TW Hya | HD 100546 | |
|---|---|---|
| Observations: | 2002 Jun 1 | 2002 May 31 |
| 2002 Aug 7 | 2002 Aug 8 | |
| Min/Max baseline: | 22 to 230 meters | |
| Pointing center (J2000): | ||
| Phase calibrator: | J1147-381 | J1058-800 |
| Flux calibrator: | Mars | Mars |
| Primary beam HPBW: | ||
| Synthesized beam HPBW: | P.A. | P.A. |
| K/Jy: | 10.6 | 21.1 |
| r.m.s. (continuum image): | 3 mJy/beam | 3 mJy/beam |
| detected flux: | mJyaaIncludes random error only; the systematic uncertainty in the flux scale is estimated to be %. | mJyaaIncludes random error only; the systematic uncertainty in the flux scale is estimated to be %. |
| Spectral Line Correlator: | 257 channels, 16 MHz | |
| species/transition: | HCO+ J | |
| frequency: | 89.188518 GHz | |
| center velocity: | 0 km s-1 | |
| channel spacing: | 0.21 km s-1 | |
| r.m.s. (line images): | 60 mJy/beam | 60 mJy/beam |
| Model | Physical Structure (mass 0.03 , radius 200 AU) | HCO+ depletion |
|---|---|---|
| Ia | irradiated accretion disk (D’Alessio et al. 1999) | 100 (1000 for T K) |
| Ib | irradiated accretion disk (D’Alessio et al. 1999) | 500 |
| IIa | passive two-layer disk (Chiang & Goldreich 1999) | 100 (1000 for T K) |
| IIb | passive two-layer disk (Chiang & Goldreich 1999) | 500 |