11email: mosorio@laeff.esa.es 22institutetext: Instituto de Astrofísica de Canarias, E-38205 La Laguna, Tenerife, Spain. 33institutetext: Consejo Superior de Investigaciones Científicas. Spain.
Photometric variability of a young, low-mass brown dwarf††thanks: Based on observations made with the Isaac Newton Telescope (INT) operated on the island of La Palma by the Isaac Newton Group in the Spanish Observatorio del Roque de Los Muchachos of the Instituto de Astrofísica de Canarias; with the 2.2 m telescope at the German-Spanish Astronomical Center at Calar Alto in Spain; with the Nordic Optical Telescope of the Observatorio del Roque de Los Muchachos; and with the 1.5 m Carlos Sánchez Telescope operated on the island of Tenerife in the Spanish Observatorio del Teide.
We report differential -band and -band photometry of S Ori 45, a cool (spectral type M8.5), young (1–8 Myr) brown dwarf of the Orionis cluster with a likely mass estimated at around 20 times the mass of Jupiter. We detect variability (amplitudes ranging from 34 to 81 mmag) and observe a modulation at a period of 2.5–3.6 h in both optical and near-infrared light curves. The most recent optical data set, however, presents a modulation at the very short period of 46.4 1.5 min, which remains a mystery. The origin of the 2.5–3.6 h modulation is analized in terms of various scenarios: inhomogeneous features (dust clouds or magnetically induced dark spots) co-rotating with the object’s surface, and presence of an unseen very low-mass companion that is steadily transferring mass to the primary. Because of the very young age of the object and its persistent strong H emission, the possible presence of an accreting disk is also discussed. If the period of a few hours is related to rotation, our results suggest that Orionis low-mass brown dwarfs are rotating faster than more massive cluster brown dwarfs at a rate consistent with their theoretically inferred masses and radii, implying that all of these objects have undergone similar angular momentum evolution.
Key Words.:
stars: low mass, brown dwarfs – stars: rotation – stars: pre-main sequence – stars: formation1 Introduction
Variability is an important phenomenon in very low-mass stars and brown dwarfs that may contribute to the understanding of the stellar/substellar atmospheric physics. These objects are fully convective with quite cool atmospheres capable of forming condensates. In addition, they appear to be faster rotators than slightly more massive stars (e.g., Basri & Marcy basri95; Tinney & Reid tinney98; Basri basri01; Reid et al. reid02). This high rotation may drive some atmospheric dynamics. However, very low-mass stars and brown dwarfs show significantly less activity as measured from H emission, which suggests that the well-known connection between rotation and magnetic activity operating in G–F type stars is not functioning in objects cooler than spectral type M5 (Tinney & Reid tinney98; see Basri basri00 for a review).
Photometric monitoring is a powerful tool to explore variability. Various time-dependent phenomena can be detected, like rotational modulation caused by surface inhomogeneities, evolution of magnetically induced dark spots, accretion from surrounding envelopes, and eclipses due to unseen companions or disks. Time-resolved photometric observations have been recently reported for several late-M and L-type field dwarfs (e.g., Bailer-Jones & Mundt bailer01a, bailer01b; Martín et al. martin01; Gelino et al. gelino02; Clarke et al. clarke02a, clarke02b), confirming that variability can be detected in such cool objects. Some of them show very short periods, which may be associated to rotation. Obtaining more rotational data in very low-mass objects of different ages would help to constrain models of angular momentum evolution. High rotation of very low-mass stars and brown dwarfs may have important implications for the modelling of their structure and evolution. Martín & Claret (martin96a) have shown the important impact of rotation on pre-main sequence evolution and lithium depletion.
In this paper we present differential photometry of the young brown dwarf S Ori 45 (S Ori J053825.6–024836; Béjar et al. bejar99). These observations were obtained as part of our on-going efforts to characterize young substellar objects. Béjar et al. (bejar99, bejar01) published the photometry and optical spectroscopy of S Ori 45, concluding that it is a bona-fide member of the star cluster Orionis. Thus, its age and mass are constrained at 1–8 Myr (most likely age of 3 Myr, Oliveira et al. oliveira02; Zapatero Osorio et al. osorio02) and 0.020 , respectively. From low-resolution spectroscopy, Béjar et al. (bejar99) classified this object as an M8.5-type dwarf; its optical and near-infrared colors are consistent with this classification. S Ori 45 displays weak K i and Na i atomic lines and strong VO and TiO molecular absorptions, as compared to similar type field dwarfs. This is expected for reduced gravity atmospheres and young ages. One of the most intriguing properties of S Ori 45 is its persistent, intense H emission, which is observed with pseudo-equivalent widths between 20 and 60 Å over a period of several years (Zapatero Osorio et al. osorio02; Barrado y Navascués et al. barrado03). This might suggest the presence of significant activity in S Ori 45, which can be studied by time-resolved photometric observations.
2 Observations and data reduction
We monitored S Ori 45 in the -band filter from 1998 December 5 through 7 using the near-infrared camera MAGIC mounted at the Cassegrain focus of the 2.2 m telescope on the Calar Alto (CA) Observatory. This camera has a Rockwell 256 256 pixel nicmos3 array, which, in its high-resolution mode, provides a pixel projection of 064 onto the sky and a field of view of 27 27. In 2001 October 8 and December 8 we continued monitoring S Ori 45 in the -band using the near-infrared camera of the 1.5 m Carlos Sánchez Telescope (TCS) on the Teide Observatory. This camera has a HgCdTe 256 256 element array with an image scale of 10 pixel (“wide optics”) and a field of view of 42 42. Nights were clear (except for 2001 December 8), with mean transparency, and atmospheric seeing conditions ranged from 10 up to 30. The night of 2001 December 8 was hampered by few cirrus. A five-position (sometimes nine-position) dither pattern was used to obtain the images; each image consisted of several (5–8) co-added exposures of 10–20 s. The dither pattern was repeated several times during the nights. We reduced raw data within the iraf111IRAF is distributed by National Optical Astronomy Observatory, which is operated by the Association of Universities for Research in Astronomy, Inc., under contract with the National Science Foundation. environment. Dithered images were combined in order to obtain the sky background, which was later substracted from each single frame and used to construct a median normalized flat-field of the CA data. Flats for the TCS data were obtained at dusk and dawn. To produce better signal-to-noise images of the field of S Ori 45, individual sky substracted and flat-fielded frames of each dither pattern were finally averaged with a clipping algorithm based on the known read out noise, gain, and sensitivity noise parameters of the detectors.
| Obs. Date | Telescope | Fil. | Exposure | Time | No. of | Seeing | Airmass |
|---|---|---|---|---|---|---|---|
| (starting UT) | (s) | (h) | data points | (″) | |||
| 1998 Dec 5 | 2.2 m CA | 9520 | 5.2 | 12 | 1.6–1.9 | 1.3–2.3 | |
| 1998 Dec 6 | 2.2 m CA | 9520 | 6.8 | 19 | 1.3–1.6 | 1.3–2.3 | |
| 1998 Dec 7 | 2.2 m CA | 9520 | 6.7 | 13 | 1.3–1.9 | 1.3–2.1 | |
| 2000 Dec 30 | 2.5 m INT | 1500 | 1.9 | 5 | 1.5–1.8 | 1.2–1.7 | |
| 2000 Dec 31 | 2.5 m INT | 1500 | 4.7 | 10 | 1.0–1.4 | 1.2–1.5 | |
| 2001 Jan 1 | 2.5 m INT | 1500 | 3.3 | 6 | 1.4–1.9 | 1.2–1.6 | |
| 2001 Oct 8 | 1.5 m TCS | 10620 | 3.7 | 9 | 2.0–2.3 | 1.2–1.8 | |
| 2001 Dec 8 | 1.5 m TCS | 10610 | 3.1 | 15 | 2.2–2.9 | 1.2–1.6 | |
| 2002 Oct 25 | 2.5 m NOT | 300 | 1.7 | 17 | 1.2–1.8 | 1.2–1.4 | |
| 2002 Oct 26 | 2.5 m NOT | 300 | 1.7 | 17 | 0.9–1.2 | 1.2–1.4 |
We also observed S Ori 45 in the optical -band filter from 2000 December 30 through 2001 January 1 using the Wide Field Camera mounted at the primary focus of the 2.5 m Isaac Newton Telescope (INT) on the Roque de los Muchachos Observatory. This camera is a four chip mosaic of thinned AR coated EEV 4096 2048 element devices. Consecutive images taken in the -band have allowed us to derive the optical light curve of S Ori 45. Our target was observed in CCD#2, which has an image scale of 0333. The three INT nights were photometric, and the atmospheric seeing conditions were fairly stable between 1″ and 18. Further -band data were obtained with the 2.5 m Nordic Optical Telescope (NOT) on the Roque de los Muchachos Observatory on 2002 October 25 and 26. Nights were not photometric and seeing conditions were between 09 and 18. We used the filter i#12 (with a passband similar to that of the Johnson-Cousins filter) and the alfosc instrument, which is equipped with a Loral/Lesser 2048 2048 CCD (0188 pixel). The optical frames were reduced using iraf and following standard techniques, which include bias substraction and flat-fielding. Fringing is visible at the 0.1–0.5% level on a scale of 10″ in the INT data. Our target was monitored both in and filters for a few hours during a total of ten nights since 1998. Table 1 provides the log of all observations.
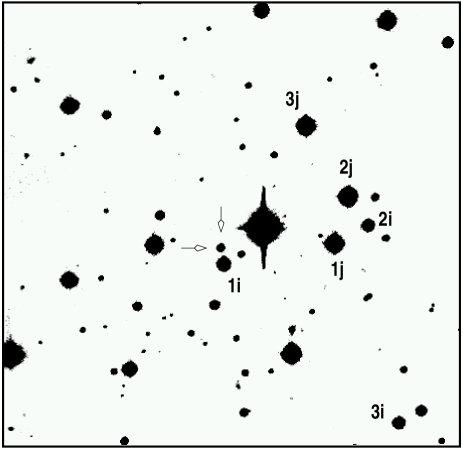
To obtain the light curves of S Ori 45, we performed differential photometry, i.e., we compared the target apparent brightness with the brightness of surrounding comparison stars. This procedure cancels the effects of apparent brightness changes due to variable extinction, instrument performance or exposure time. The three comparison stars that we have selected for each filter are indicated in Fig. 1. They are brighter than S Ori 45 (but still within the linearity regime of the detectors) in order to minimize their noise contribution to the differential photometry. Aperture photometry was performed using vaphot, an iraf script written by Hans Deeg (Deeg et al. deeg98), which operates within daophot. We verified that the three comparison stars are not variable on the time scales of our observations. Images were first aligned, and the nonoverlapping parts were removed. Changes in the seeing conditions and in the telescope focus throughout a night implied variations in the size of the point-spread function (psf) of the sources from frame to frame. To take this into account we derived an average psf of the three comparison stars by fitting a circular Gaussian on each frame. All three sources comply with the requisites for a good definition of the psf. Apertures were chosen as the fwhm of the average psf, and the sky intensity was defined as an outer ring 5 pixels wide. S Ori 45 was detected with a relatively low signal-to-noise ratio in the NOT data. In this case, we checked that psf photometry produced better results than aperture photometry. S Ori 45 is much redder than the comparison stars, and hence has a longer effective wavelength in the -band filter. This means that late type objects have a smaller effective extinction coefficient at these wavelengths. To correct for this effect, we have substracted the dependence of the instrumental photometry on airmass by fitting a second-order polynomial curve to the data of each object. The three INT nights were treated at once because of their similarly good quality, while the two NOT nights were treated separately due to their poorer weather conditions. Nevertheless, we note that this correction typically affects our differential photometry by less than 0.5%, checking that no significant long-term variations were removed. Relative magnitudes of S Ori 45 with respect to the sum of the flux of the three reference stars were derived. Hence, an increase in the differential magnitude represents a dimming of the target.


3 Data analysis: photometric periodicity
Figures 2 through 5 display the light curves of S Ori 45 obtained with the CA, INT, TCS and NOT telescopes. Error bars are given by the iraf scripts. The photometry of reference star 1 with respect to reference stars 2 and 3 is also shown for comparison (except in Fig. 4). The optical light curves have better quality in general. We checked that the wings of reference star #1i (Fig. 1), which is located at 54 from the brown dwarf, do not contaminate considerably the photometry of S Ori 45. Both objects are always resolved. This contamination might be expected for large seeing values (or large fwhm values), but it is not observed in any of our data as shown in Fig. 6. We also checked for the presence of correlations between differential magnitude and seeing or airmass, which might have resulted from our data reduction procedure and/or color-dependent differential photometric effects. Figs. 6 and 7 show plots of the differential photometry of S Ori 45 against seeing and airmass, respectively. There is no evidence for a correlation in either of these plots.


S Ori 45 does not display large photometric variability in any of the filters as illustrated in Figs. 2–5. We note that the peak-to-peak variation of the -band and -band light curves is of the order of 0.2–0.3 mag. We searched for a periodic signal in the 1998 data by calculating the power spectrum (or periodogram) via the method developed by Lomb (lomb76) and further elaborated by Scargle (scargle82). It is possible to detect a periodic variation of amplitude less than the photometric errors, because the noise is spread over many frequencies in the power spectrum. We find a cluster of peaks between frequencies 7.5 and 11.5 day (3.2–2.09 h) in the periodogram of the 1998 -band light curve (Fig. 8), being the highest peak at 2.82 h with a false alarm probability of 0.01. This low false alarm probability may indicate a rather significant periodic signal. However, one of the drawbacks of the Scargle’s (scargle82) method is that it makes no attempt to remove the spectral window function from the data. The sampling in our data sets is such that the window function shows high sidelobes at small multiples of about 1 day and 0.1 h. In principle, these could create an ambiguity in the determination of the real period. Hence, we applied the clean algorithm (Roberts et al. roberts87) to iteratively remove the spectral window function from the raw power spectrum. We ran several solutions using different values of the gain and number of iterations. The solutions for our cleaned periodograms remained stable. For consistency in our period computations and plots shown in this paper, we used a gain of 0.1 and 5 iterations.

The cleaned power spectrum of the 1998 -band differential photometry is displayed in Fig. 8. It shows a strong peak at a frequency of 9.3667 day, corresponding to a period of 0.107 day (2.56 h). The error of this measurement is difficult to estimate (e.g., see the discussion by Schwarzenberg-Czerny czerny91). We will adopt an uncertainty that accounts for the width of the pedestal of the peak in the periodogram, i.e, 0.004 day (0.10 h). This peak was also present in the raw power spectrum; it was not the highest one, but the second highest, indicating that other peaks have been artificially enhanced by the window function. The significance of the peak is usually referred to the noise of the power spectrum. The clean algorithm does not provide any indicator for this noise. Thus, we attempt to estimate it by calculating the periodogram of the differential photometry of a source of similar magnitude than S Ori 45, which was observed in the same field of view and with the same temporal sampling as the brown dwarf. Photometric errors of this source and our target are alike. We take the primary peak power of this periodogram as the noise level in S Ori 45 power spectrum. The detection of the 2.56 0.10 h peak is at around eight times the noise.


We also applied the clean algorithm to the 2000 -band data to search for periodic variability in the light curve of S Ori 45. This allows us to investigate further the reliability and stability of the periodicity detected in the previous near-infrared data. The two highest and lowest data points were excluded because they deviate by more than 2- with respect to the mean differential photometry. Figure 9 illustrates the resulting cleaned power spectrum, where one single, strong peak is observed at a frequency of 8.8167 day (about five times the noise level), corresponding to a period of 0.113 0.005 day (2.72 0.12 h). If no data points are removed, this peak appears less significant. Also shown in Figs. 8 and 9 is the power spectrum of the photometry of one comparison star minus the other two comparison stars. There is no peak at the frequencies detected in the S Ori 45 photometry, and the maximum power in the periodograms is about an order of magnitude lower. This confirms that the periodic variability detected in S Ori 45 is due to the brown dwarf rather than to the comparison stars.
The TCS -band differential photometry of S Ori 45 is plotted in Fig. 4. We have performed the time-series analysis over the 2001 Dec. photometry by considering 13 of the 15 data points (the two brightest photometric points were removed). The power spectrum is not reliable because it is based on a small number of points; however, it shows a peak at around 0.15 0.05 day, which is about the time interval of the observations. It is possible that the dimming we see from HJD = 51.68 to the end of the observations in Fig. 4 is analogous to the dimming from HJD = 51.56 to 51.58. The peak at 0.15 0.05 day is compatible with the TCS data modulating with a period similar to that of the 1998 CA and 2000 INT data sets.

The two peaks at 2.56 0.10 h and 2.72 0.12 h are consistent with each other within 1 . They clearly indicate the presence of a long-lived, sinusoid-like variation with a modulated amplitude that could be related to a rotation period. The cleaned power spectra of Figs. 8 and 9 do not reveal any other significant periods over the range of frequencies we can study. If we increase the number of iterations up to 50–100 (bottom panel of Fig. 8), a few more (although considerably less intense) peaks appear at different frequencies, but none of them produce clear modulated light curves. We note, however, that a secondary cluster of peaks appears at 34 day (42 min) in the 1998 -band data.
The 2002 NOT -band data also present a periodicity. Both the Scargle (scargle82) and the cleaned powed spectra are depicted in Fig. 10. Surprisingly, we found a single peak at 31.0100 day, which corresponds to a very short period of 0.0322 0.001 day (46.4 1.5 min, about four times the noise level, and false alarm probability = 0.2), and no evidence for the periodicity at 2.6 h. To investigate further the periodicity detected, we treated each night separately. Both data sets show the same periodicity within the error bar, although first night’s data display quite large photometric variations as compared to second night’s data. A related periodicity might be present in the 1998 -band differential photometry (the 34 day peak of the bottom panel of Fig. 8), but at a considerably lower amplitude. We could not investigate the presence of this short period in the 2000 -band photometry because of the small Nyquist critical frequency of the INT data.
The optical and near-infrared light curves of S Ori 45 folded on their respective periods are shown in Figs. 11 through LABEL:notphase. In Fig. 11, 1998 -band data points are binned in groups of three to increase the signal-to-noise ratio, and a sinusoid fit is overplotted. Each individual error bar corresponds to the standard deviation of the group of three data points. A least-square minimization technique yields that the amplitude that best reproduces the sinusoidal variation is 52 18 mmag. We did not attempt to obtain the amplitude from the cleaned power spectra because the amplitude of the peaks is usually altered by the number of iterations of the algorithm. Figure 12 displays the 2000 INT phased -band data points with no binning. As for the previous Figure, the amplitude of the fitting sinusoidal curve is 13 4 mmag. Note that the two brightest and faintest points are excluded from the fit. Figure LABEL:tcsphase depicts the 2001 folded -band data. Each night’s data are plotted with different symbols. We did not attempt to fit a sinusoid to these data. The 2002 -band differential photometry is folded in Fig. LABEL:notphase. Because of the different amplitude of the variations, each night’s photometry is plotted in two separate panels. The best sinusoidal fits have amplitudes of 126 29 and 35 12 mmag. Note that all these fits are intended to provide a visual guide to the data. It is remarkable that the scatter of the photometric data appears larger at phase 0.5 in almost all light curves. We will discuss S Ori 45 phased light curves further in Sect. LABEL:discussion. Table 2 summarizes the results of the analysis of the optical and near-infrared differential photometry.

| 1998 -band | 2000 -band | 2001 -band | 2002 -band | |
|---|---|---|---|---|
| Period | 2.56 0.10 h | 2.72 0.12 h | 3.6 1.2 h | 46.4 1.5 min |
| Amplitude (mmag) | 52 18 | 13 4 | — | 126 29, 35 12 |
| Peak-to-peak (mmag) | 294 46 | 212 10 | 297 47 | 294 34, 141 24 |
| Standard deviation, (mmag) | 66 10 | 44 9 | 72 19 | 81 20, 34 8 |
| Rotational velocity (km s) | 150 | 140 | 105 | — |
Data are given for the two observing nights.
Sinusoid-like fits of Figs.11 through LABEL:notphase (see text).
Obtained from the unbinned data.
Definition of amplitude used by many groups.
Estimated from the observed period and theoretical radii.