Optical and near-infrared photometry of the Type Ia Supernova 2000E in NGC 6951
Abstract
We present optical () and near-infrared () photometry, along with optical spectra, of the Type Ia supernova SN 2000E in the spiral galaxy NGC 6951. It was discovered by the staff of the Teramo Observatory during the monitoring of the SN 1999el. The observations span a time interval of 234 days in the optical and 134 days in the near-infrared (starting days and days before maximum light, respectively). Optical spectra are available from 6 days before maximum light to 122 days after it. The photometric behavior of SN 2000E is remarkably similar to that of SN 1991T and SN 1992bc: it exhibits a , thus being classifiable as a slow-declining Type Ia SN and showing the distinctive features of such a class of objects both in the visible and in the near-infrared. Spectroscopically, SN 2000E appears as a “normal” Type Ia supernova, like SN 1990N. We could constrain reddening [ mag] and distance ( mag) using a number of different methods. The bolometric luminosity curve of SN 2000E, which displays a bump at the epoch of the secondary near-infrared peak, allows a determination of the 56Ni mass, amounting to 0.9 M☉.
1 Introduction
Type Ia Supernovae (SNe Ia) are of great interest as one of the most powerful tools for measuring the Hubble constant and investigating the rate of expansion of the universe. This is not only because of their large intrinsic luminosity, but is also due to the small dispersion in absolute magnitude at maximum light, which is less than 0.4 mag (Hamuy et al. 1996a). The hope of further reducing this scatter has long driven the search for empirical relations that could correlate the luminosity at maximum to morphological parameters of the light curves. The Phillips’s relation and its subsequent modifications (Phillips 1993, Hamuy et al. 1996a, Phillips et al. 1999), use the decay in the -band light curve from peak to 15 days after peak, , and, although quite simple, have proved effective in reducing the scatter around the Hubble flow to less than 0.14 mag, after reddening corrections. A more complex method based on light curve shapes in multiple optical passbands (i.e., multicolor light-curve shapes, or MLCS) has been developed by Riess, Press & Kirshner (1996) and allows one to simultaneously estimate the SNe Ia luminosity and the amount of extinction, further reducing the scatter to only 0.12 mag. While probably more work is still needed, these studies clearly indicate that light curve parametrization can be used to correct for the intrinsic range in the absolute brightness of SNe Ia.
The reliable use of SNe Ia for cosmological purposes requires an extremely good calibration of the empirical relations. In this respect, the main problems are the accuracy of independent distance determinations of nearby events and the effects of reddening. In particular, the latter has highlighted the need for infrared observations, that are less affected by interstellar dust. It has been already noted also that in the near-infrared (NIR) SNe Ia appear generally quite homogeneous. However, the coverage of NIR light curves is still much inferior to that achieved in the optical region. So far, only for a handful of events well sampled NIR light curves around peak are available (see, e. g., Meikle 2000, Krisciunas et al. 2000, and references therein; Krisciunas et al. 2001, Strolger et al. 2002, Candia et al. 2003, Krisciunas et al. 2003). Nevertheless, the absolute NIR magnitudes at a given epoch past maximum light show a dispersion of about mag for SNe with (Meikle 2000). Therefore, NIR light curves could be used in principle to determine cosmological distances with an equal or probably greater accuracy than the optical ones. In addition, combining NIR and optical photometry, it is possible to estimate the extinction due to the host galaxy (Krisciunas et al. 2000). At NIR wavelengths, the light curves of SNe Ia display a secondary peak after the optical maximum, whose shape and time of occurrence appear loosely related with the decline rate (Phillips et al. 2002, and references therein). This suggests that other parameters characterizing the brightness evolution of SNe Ia in a wide range of wavelengths may exist which still need an in-depth exploration. A detailed knowledge of those parameters could not only allow one to find more reliable indicators of the absolute magnitudes at peak, but might also provide stronger constraints on the theoretical models of SNe Ia progenitors and explosions.
The use of empirical relations to minimize the uncertainty in the intrinsic luminosity of SNe Ia would greatly benefit by their fitting a well understood theoretical scenario. Several physical parameters [progenitor mass (if rotation is accounted for, see Piersanti et al. 2003) or thermal content, energy delivered during the explosion, mass of produced 56Ni, opacity of the photospheric layers] probably combine to shape the display of a SN Ia. However, the role of radiation transfer within the expanding structure in correlating some of the observed features has been suggested as being crucial (Arnett 1982, Pinto & Eastman 2000a, Pinto & Eastman 2000b). This is not unrelated to an in-depth understanding of the explosion mechanisms and their effects on the final chemical composition and the physical conditions within the SNe.
In the framework of the SWIRT (Supernova Watch-dogging InfraRed Telescope) project, a collaboration between the Observatories of Collurania-Teramo, Rome and Pulkovo, we have been gathering accurate NIR data for close-by SNe of all types since the late ’90s. These can be usually complemented by optical photometry from a few facilities operated by Italian Institutions. For SNe Ia, we aim to obtain a large data set of infrared light curves in order to fully characterize and parameterize their behavior. Herein, we present the results of our follow-up of SN 2000E. The paper is laid out as follows: in Sect. 2, observations and data reduction procedures are summarized, in Sect. 3 our main results are described, Sect. 4 is devoted to discuss these results and in Sect. 5 we list our main conclusions.
2 Observations and data reduction
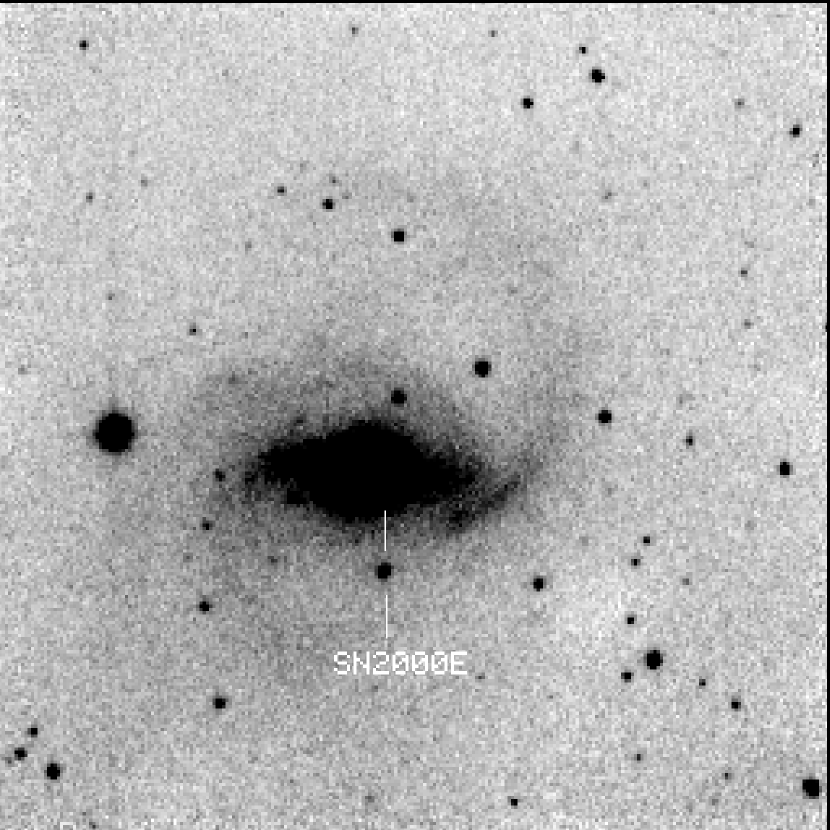
SN 2000E was discovered on January 26.73 UT (JD 2451561; henceforth, JD+561) on CCD images obtained with the TNT telescope, located at the Teramo observatory (Italy), during routine observations of SN 1999el (Valentini et al. 2000). It was identified as a Type Ia by Turatto, Galletta & Cappellaro (2000) through spectral observations obtained with the 1.82-m telescope at Cima Ekar (Asiago, Italy) on January 27.83 UT. It was located west and south of the nucleus of NGC 6951 (see Fig. 1), an inclined () barred spiral galaxy hosting a type 2 Seyfert AGN whose coordinates are and . For a list of galaxy properties, see Kohno, Kawabe & Vila-Vilaró (1999) and references therein. The quoted distance is Mpc. Although Valentini et al. (2000) report having obtained no images from December 18.78 UT (when the object does not appear on the frames) to the discovery day, SN 2000E was clearly detected at an epoch preceding the time of maximum. The earliest record is claimed by Evans & Corso (2000), who found the object on and images taken on January 24.03 UT.
The NIR observations were carried out using the AZT-24 telescope at
Campo Imperatore (Italy).
On JD+691.62, we also obtained images
with ARNICA (Lisi et al. 1996) at the 3.58 m Telescopio Nazionale Galileo
(TNG; La Palma, Canary Islands, Spain).
The AZT-24 is a 1.1 m Ritchey-Chrétien system
equipped with the near-infrared camera SWIRCAM (D’Alessio et al. 2000),
which is based on a 256256 HgCdTe PICNIC array.
The detector is sensitive to radiation in the spectral
range from 0.9 to 2.5 micron and allows a resolution of
arcsec/pixel, for a total field-of-view of 4.44.4 arcmin2.
The available JHK filters are in the standard of the Johnson photometric system (1965).
The scientific data were acquired collecting 5 dithered images of the
target and of a nearby sky location in each
of the , , bands.
The final scientific images were then obtained subtracting the sky
background, flat-fielding, removing the bad pixels and
finally registering and combining the dithered exposures.
The instrumental magnitudes were obtained via PSF (point-spread function)
fitting photometry and the
calibration to the standard system was performed through comparison with
a local sequence of field stars. Two of these stars were calibrated
on images taken with the ARNICA
camera at the TNG,
using the standard star AS 40-5 (Hunt et al. 1998), as described
in Di Carlo et al. (2002; see also their Fig. 1 for the local
sequence and the text for further details).
The photometry of SN 2000E is listed in Table 1. The
uncertainties due to photon statistics and fitting are also indicated.
| Julian Day | Epoch | Telescope | ||||||
|---|---|---|---|---|---|---|---|---|
| (2451000+) | (days) | (mag) | (mag) | (mag) | (mag) | (mag) | (mag) | |
Most of the optical images were collected with a 512x512 Tektronics optical camera mounted at the focal plane of the 0.72 m TNT telescope at the Teramo Observatory. During several nights spanning January to March 2000, we obtained different sets of images of the supernova field in the bands. These images were processed using standard bias-subtraction and flat-field normalization techniques and the instrumental magnitudes were obtained via PSF photometry on each image after averaging four or more measurements available per night.
Optical images at were also taken with the 1.82-m Copernicus telescope (henceforth CT) operated by the Osservatorio Astronomico di Padova and sited in Asiago, Cima Ekar (Italy), equipped with AFOSC. The instrument is a focal reducer type spectrograph/camera with a 1K 1K Site Thinned CCD (m). The scale of 0.473 arcsec/pixel gives a field of view of arcmin2.
Some photometry was obtained with the Optical Imager Galileo (OIG) mounted on TNG and equipped with a mosaic of two thinned, back-illuminated EEV42-80 CCDs with pixels each (pixel size m; pixel scale in 2x2 binned mode arcsec/pixel). Some of these nights were photometric and were used to calibrate the local sequence around the SN which in turn was used for calibrating non-photometric nights at all of the telescopes. The instrumental color equations were obtained through observations of stars in the standard fields of Landolt (1992).
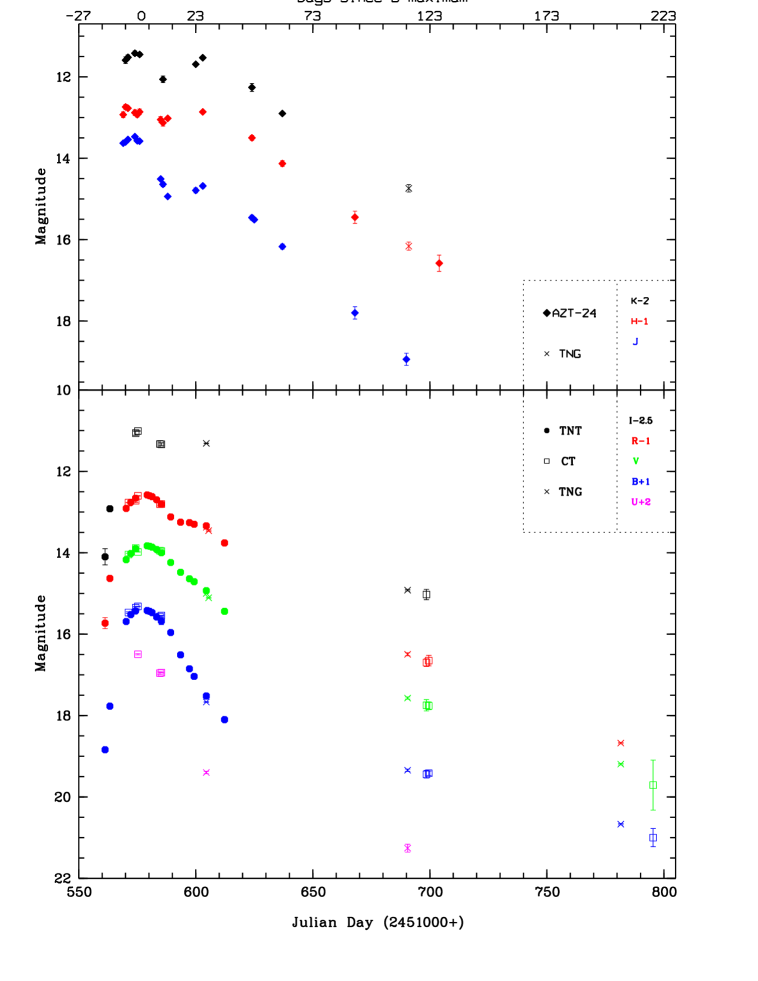
Table 2 lists the results of optical photometry for SN 2000E, also shown in Fig. 2. All UBVRI magnitudes have been standardized to the Johnson-Cousins filter system (Bessel 1979). Quoted errors are the uncertainties arising from the photon statistics and fitting. As can be seen in Fig. 2, there are small discrepancies at -band between data points from the TNT and the CT. The effect can be described to first order as an offset between the two sets of measurements of mag, at least during the period from JD+570 to JD+590. The small systematic differences are not unexpected and probably arise owing to the non-stellar nature of SN spectra which enhances filter and detector differences between instruments (see, e. g., Stritzinger et al. 2002). Although spectro-photometric methods to correct for these effects are currently being attempted (see, e. g., Stritzinger et al. 2002, Candia et al. 2003, Krisciunas et al. 2003), it is not one of our aims to perform such corrections. Anyway, these discrepancies between measurements are taken into account in the following.
As reported by Di Carlo et al. (2002), the local sequence used here for differential photometry includes 3 stars among those selected by Vinkó et al. (2001) to perform their own differential photometry of SN 2000E. The magnitudes of the 3 objects agree within with 2 exceptions in the and band (where, however, the difference is mag), confirming the validity of both our and their calibrations.
We compared the magnitudes given by Vinkó et al. (2001) in their Tab. 3 with the values obtained by spline fits to our data (see Sect. 3.5). This allows one to circumvent the shortage of overlapping observations in their and our datasets. The differences (in the sense their values minus ours) are summarized in Table 3. Between JD+572 and JD+589, when we have a good time coverage, and coincide within mag (often within mag). The same is true for , although we lack points between JD+575 and JD+586 (just the spline curve); at JD+576, however, differs by mag, but the quality of their -band datum seems lower (see their Fig. 4). Between JD+656 and JD+667, differ by mag, yet we lack any measurements between JD+612 and JD+690 and the quality of spline interpolation over such a large interval is then poor. After JD+690, again coincides within mag and the only comparable point at (JD+696) is somewhat discordant ( mag). Also in this case, inspection of their Fig. 3 suggests that the value given by Vinkó et al. (2001) may be somewhat less accurate. Part of the differences may be due to the different techniques employed: whereas they perform aperture photometry, we adopted a PSF-fitting photometry.
| Julian Day | Epoch | Telescope | ||||||||||
|---|---|---|---|---|---|---|---|---|---|---|---|---|
| (2451000+) | (days) | (mag) | (mag) | (mag) | (mag) | (mag) | (mag) | (mag) | (mag) | (mag) | (mag) | |
| Epoch | ||||
|---|---|---|---|---|
| (mag) | (mag) | (mag) | (mag) | |
| From JD+572 to JD+589 | - | |||
| From JD+656 to JD+667 | - | |||
| From JD+696 to JD+727 | - | - |
3 Results and analysis
3.1 Light curves
The light curves of SN 2000E are shown in Fig. 2. As can be seen there and in Tab. 2, we began our observations through the , and filters about 16 days before maximum brightness. However, the detection by Evans & Corso (2000) sets the rise time to , to at least 17–18 days. The NIR observations began days before , allowing a good coverage around that epoch at these wavelengths, as well. Currently only a few studies of SNe Ia, almost all quite recent, cover the epoch of maximum NIR light (preceding a few days). This is instrumental in characterizing the LCs at all wavelengths, even more so if we consider that, e. g., emission at suffers from a reddening which is a factor less than at , making the NIR suitable for a more accurate determination of absolute brightness, decreasing the uncertainties for the estimate of distances (Meikle 2000).
The time and magnitude at maximum light were estimated in each band (excepted ) via third-order polynomial fits to the data around the peaks. The results are listed in Tab. 4. Since the fits to the optical light curves may be sensitive to systematic differences between photometry from different instruments already pointed out at , we gave the same weight to all data assigning them a minimum error of 0.05 mag. For the -band, we chose to limit the data set to the measurements from the TNT only. However, the values obtained shifting the latter ones by 0.1 mag to have them agree with the photometric points from the CT are also indicated. For , we give a conservative estimate of the error because of the shortage of data points (implying a less reliability of the results). Finally we could not fit the main peak of with the polynomial curve, so we performed instead a spline fit (note that spline fits to and yield roughly the same values as the polynomial fits). From the estimated magnitude at maximum and a linear fit to the declining part of the curve (for the TNT data set), we derive a decline rate at , as defined by Phillips (1993), . Since the discrepancies between the two sets of optical data (TNT and CT) can be described as a constant offset, using the one with the best time coverage should result in an accurate enough estimate of the decline rate regardless of the photometric differences. According to Phillips et al. (1999), is for a typical SN Ia and it has been reported to range from (SN 1999aa; Krisciunas et al. 2000) to (SN 1999da; Krisciunas et al. 2001). Hence, SN 2000E may be considered as a “slow decliner” and is therefore very likely overluminous, as predicted by the empirical correlation found between and the intrinsic magnitudes of SNe Ia (Phillips 1993; Hamuy et al. 1996a; Phillips et al. 1999).
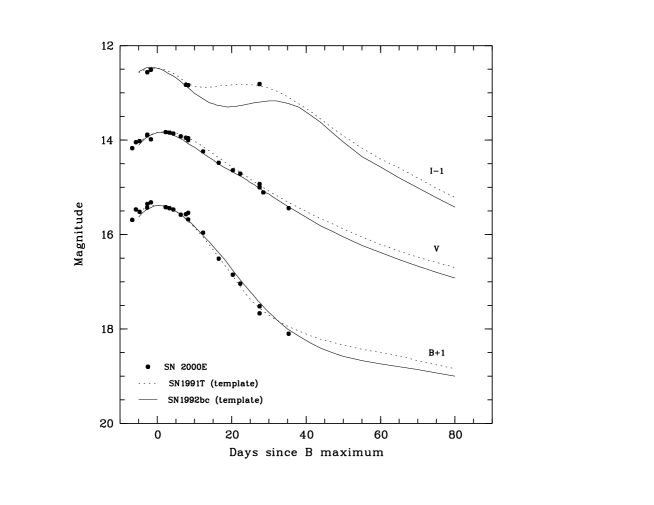
We also compare the optical light curves with the templates of Hamuy et al. (1996b). In Fig. 3 our LCs at are overlaid with those of the slow decliners SN 1992bc () and SN 1991T (). We note that at and the LCs of SN 2000E are well approximated by the two templates, confirming our estimate of . The few data points at are better represented by the template of SN 1991T. The differences between LCs at may suggest that a single parameter, e. g. , cannot actually describe the brightness evolution of SNe Ia at all wavelengths, a conclusion depending only on few points.
| Band | Julian Day | Magnitude |
|---|---|---|
| at maximum | at maximum | |
| aaFrom TNT data only. | ||
| bbShifting the TNT data onto the CT data. | ||
| ccFrom spline fits to the data. | ||
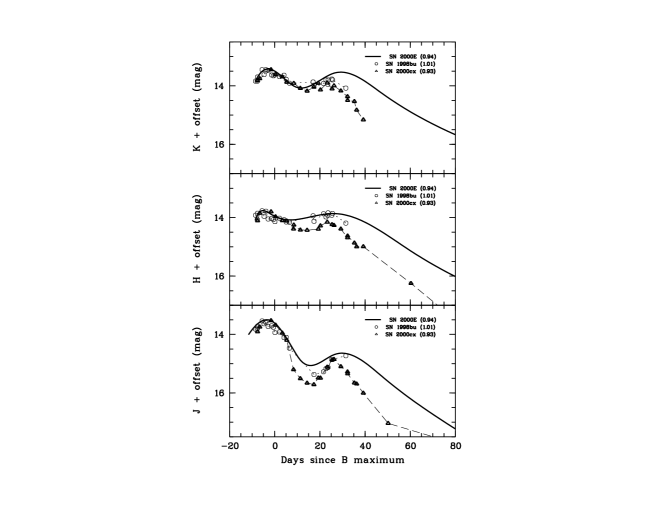
In the NIR, the LCs display the characteristic double peak which is also noticeable at and (see Fig. 2). The earlier (and brighter) peak occurs at around JD+571–574, 3 to 6 days before , whereas the secondary one occurs roughly on JD, i. e., 30 days past . A comparison between the NIR light curves of SN 2000E and those of SN 1998bu (Meikle 2000) and SN 2000cx (Candia et al. 2003), with and 0.93, respectively, is shown in Fig. 4, which further emphasizes the inadequacy of a uniparametric characterization of LCs. All share a well developed secondary peak, although it seems to occur later for SN 2000E at and probably also at . The LC of SN 2000E is extremely flat between maxima at and the minima are the shallowest at both and . SN 2000E appears also the one with the slowest decline in the NIR of the three objects (SN 2000cx is however a peculiar slow decliner).
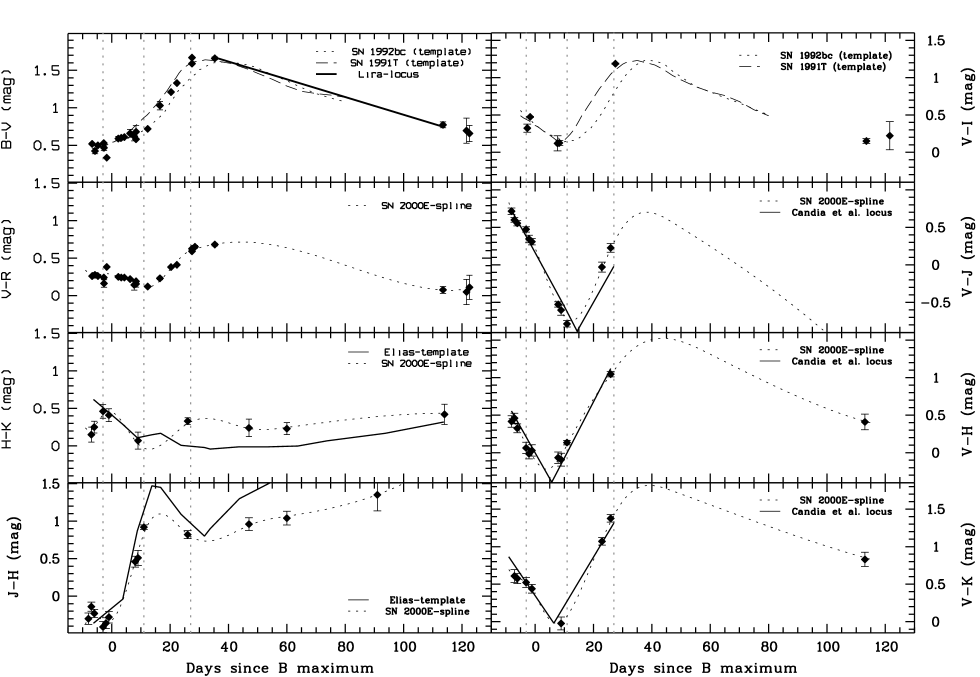
3.2 Color curves
Optical and NIR colors are plotted in Fig. 5. In the upper left panel we compare with template curves given by Hamuy et al. (1996b). Again we find that the curve of SN 2000E has a similar shape as those of SN 1992bc and SN 1991T. SNe Ia with and little or no reddening from their host galaxy, show a very uniform color evolution at late epochs past maximum light (Lira 1995, Riess et al. 1996). Such color uniformity has proven useful as an indicator of host galaxy reddening, and has been important in revising the empirical relations characterizing LCs. Lira (1995) found that the colors of Type Ia SNe from 30 to 90 days past maximum evolve in the same manner and derived a relation to describe the intrinsic colors (Phillips et al. 1999). During this time interval (JD+609 to JD+669) we have only one data point, so we derived colors also from template fits to the LCs at and . We find that the offset between the Lira relation and the colors of SN 2000E is consistent with the reddening (see Sect. 3.3).
Also in the minus NIR color evolution, spectroscopically normal SNe Ia show an impressive uniformity in their intrinsic colors around maximum light. Krisciunas et al. (2000, 2001) found that for mid-range decliners these are uniform from 9 days before maximum to 27 days after maximum. Candia et al. (2003) construct the same loci but for slow decliners. Using weighted fits to the LCs at , after deriving the , and colors from JD+569 to JD+604, we found that the differences between them and the relations given by Candia et al. (2003; see also their Fig. 13) are fully consistent with reddening (see Sect. 3.3). This result, and the agreement of colors with the Lira relation after dereddening, both shown in Fig. 5, not only allow an estimate of extinction, but also confirm that SN 2000E is a slowly declining Type Ia SN without peculiar behavior.
It is interesting to follow the evolution of NIR
colors in between the two peaks.
As can be checked in Fig. 5, and display
a different behavior: appears to decrease from to
mag after the first peak, until the minimum between the two peaks
is reached. Then, it increases to mag
at the epoch of the secondary peak. On the other hand, increases
from mag to mag after the earlier maximum,
until the minimum between the two peaks is reached, then it slowly
fades to mag before the secondary maximum. Fig. 2
indicates that this essentially reflects the different main-peak-to-dip
height, which is smaller in than in and .
The time evolution of NIR colors is fully consistent with that envisaged
by Meikle (2000) for SNe Ia.
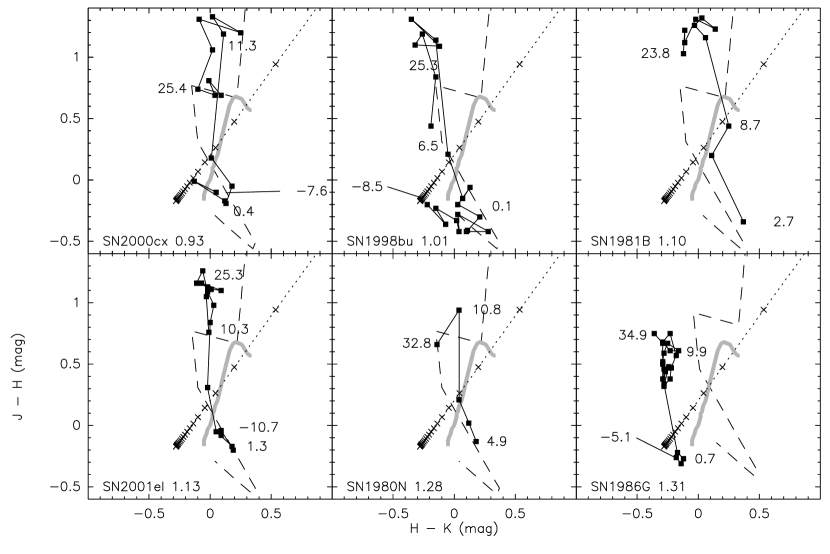
The variation of NIR colors roughly follows a characteristic path in the
vs. diagram, as can be seen in Fig. 6.
Figure 7 compares NIR color-color diagrams, after
dereddening, for 6 SNe Ia which are well sampled at (from Meikle 2000,
Candia et al. 2003,
Krisciunas et al. 2003). All resemble SN 2000E in their shift of colors
from below to above the blackbody locus.
We identify a common evolutionary sequence in two phases.
First, earlier than , the data points tend to lie below the main
sequence locus and move towards bluer and redder .
It seems that the path followed by SN2000E in the color-color diagram well
before maximum light can be extrapolated backward in time up to the
blackbody locus at a color temperature of 10000–20000 K. This is what is
obtained in Fig. 6 and Fig. 7 through the
intersection of the straight line connecting the data points earlier than
phase d, and the blackbody locus. The same is suggested by the NIR
colors of a few of the SNe that have been sampled at very early epochs and may
reflect the resemblance of spectra longward of to blackbody curves of K (see Sect. 3.7).
Soon before the earlier NIR maximum, the data points cross the
main sequence locus and move above it.
The change occurs roughly perpendicular both to the reddening law and to the
blackbody sequence. However, it is obvious that this picture differs for each
SN in some details. For example the maximum displayed color excess before
: a slow decliner like SN 2000E shows the largest color excess
during the first phase, whereas a fast decliner
like SN 1986G shows almost no color variations before .
From these data it
is difficult to assess whether some of the differences are related to the
declining rate. Past the secondary NIR peak, the differences in color
evolution become even more noticeable probably because of the beginning of
the nebular phase and the growing importance of line emission.
Anyway, some of the differences as well as part of the displayed “oscillations” could
be due to errors and color effects on the photometry. These problems should be
considered in more detail.

3.3 Reddening
From the maps of Schlegel, Finkbeiner, & Davis (1998) we obtain a Galactic extinction mag towards NGC 6951. As noted in Di Carlo et al. (2002), these maps appear to systematically overestimate the extinction where mag, which is also the case for NGC 6951. The value from Burnstein & Heiles (1982), mag, is more consistent with the equivalent width of the interstellar NaID line in the spectra of SN 2000E (which we present in Fig. 11). NaID lines are also found at the systemic velocity, suggesting absorption from the host galaxy, with EW(NaI) Å, which, following the relations given in Turatto, Benetti & Cappellaro 2003, yields mag. Using the extinction law from Cardelli, Clayton & Mathis (1989), assuming , the total is mag ( mag using the value from Schlegel et al. 1998).
Purely photometric methods agree with the spectroscopic constraints. Following the prescriptions by Phillips et al. (1999), we determine the reddening for SN 2000E. This analysis yields: mag [ mag for the sparser CT data set; see Sect. 2]; mag [i. e. mag assuming ]. Although we have only one point that can be shifted on the Lira relation [yielding mag], just at the beginning of the time interval defining the locus, we can circumvent this by using a template , that is fit by mag.
As for the minus NIR colors, their fits to the relations found by Candia et al. (2003) for slow declining Type Ia SNe yield , and mag. Assuming and the reddening law of Cardelli et al. (1989), we find in the range 1.47–1.50 mag [ mag]. So also these values are consistent within the errors with the spectroscopic indications. Using a lower , e. g., , would result in mag and mag, which lies above the highest (and less likely) end of the spectroscopic range.
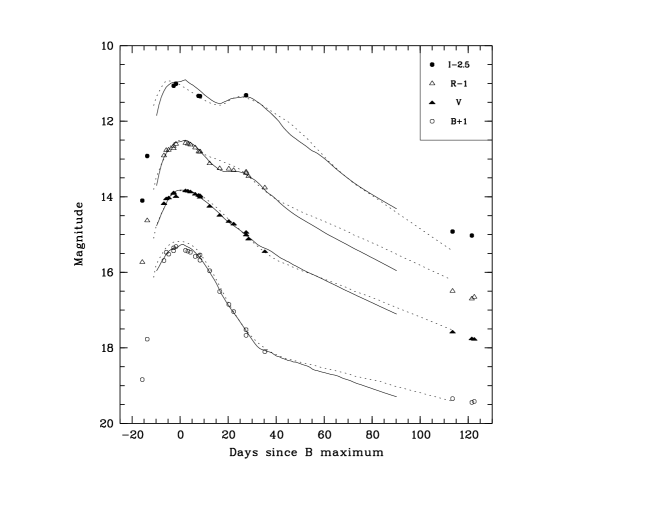
3.4 MLCS fits and estimates of distance
The distance to NGC 6951 is discussed by Vinkó et al. (2001). They report Tully-Fisher determinations of the distance modulus mag from the literature; based on their own data of SN 2000E, they revise the distance modulus to mag. Herein, we attempt to refine the estimates of extinction and distance using our own data set of SN 2000E and different techniques.
The MLCS method is defined by Riess et al. (1996). Assuming the reddening law given by Cardelli et al. (1989) for and using the linear solution given by Riess et al. (1996), we performed 3 different fits, one to the TNT data set only, one shifting by 0.1 mag from the TNT onto the CT values and one shifting by 0.1 mag from the CT onto the TNT values. We obtained a ranging from 173 to 727, but these large numbers are obviously due to the smallness of some of the photometric errors. So we repeated the 3 fits increasing the minimum error to 0.05 mag; this yielded (reduced ). Summarizing the six results by using the average values and their standard deviations, we found mag [i. e., mag], mag and (the latter is the -difference at maximum between SN 2000E and a “fiducial” Type Ia SN). Note that the formal errors on from the fits ( mag) are always larger than the standard deviation of the six values. We also performed the fits varying from 2 to 5 and checked that smaller values of give a slightly smaller . E. g., using only the TNT data, the smallest is found for , with mag [i. e., mag], mag and . However, the difference in between and 3.1 is only % (), and we managed to mimick a decrease of in test fits with templates simply using slightly greater epochs of maximum at than the actual one. These also produced slightly smaller ’s and slightly greater distance moduli. It is noteworthy that the MLCS method yields extinction values in agreement with the estimates given in Sect. 3.3 and most of the estimated distances lie between 32.1–32.2 mag.
The linear MLCS method uses training vectors based on a very limited number of SNe. An updated version employing a larger data set is described in Riess et al. (1998). We performed fits to the light curves following the updated MLCS method, with the templates kindly provided us by Adam Riess. Each model light curve includes also a second order term in (see Eq. A6 in Riess et al. 1998) and we adopted the extinction law computed by Nugent, Kim & Perlmutter (2002) for Type Ia SNe as a function of epoch. We used a routine which simultaneously fits four model light curves to the four optical ones determining the four free parameters , , and through minimization of the deviations between data and model weighted by the sum of the squared photometric errors and the two-point correlation terms. The zero points of the templates have been set invoking , , and mag at (the epoch of maximum light at ). We repeated the calculations varying the data set in the 6 ways already selected for the linear MLCS, always obtaining quite similar results, but with large values () when the photometric errors are unchanged and acceptable ones (, i. e., reduced ) when the minimum errors are increased to 0.05 mag. Still using average values and standard deviations to summarize the six sets of results, we obtained , mag, mag and . The standard deviations are always of the same order (or slightly greater) than the formal fit errors. Hence, also the updated MLCS method yields an which agrees with the estimates given in Sect. 3.3, but the SN appears even more overluminous (more distant) with respect to the results of the linear MLCS method. The same trend is obtained by Vinkó et al. (2001), although they find an underluminous object through the linear MLCS method. The template LCs at obtained by the updated MLCS fit appear to reproduce the shape of the observed LCs, as can be seen in Fig. 8, better than those from the linear MLCS fit.
| Method | |
|---|---|
| (mag) | |
| NaID lines | |
| Lira | |
| MLCS | |
| updated MLCS | |
| max. aaFit to max. (Hamuy et al. 1996a). | |
| max. bbFit to max. (Phillips et al. 1999). | |
| average value |
Further constraints can be put on the previous results by using other available techniques for the distance estimate. Hamuy et al. (1996a) and Phillips et al. (1999) find updated relations between absolute magnitudes at maximum and , so and can be simultaneously estimated by fitting to the magnitudes given in Tab. 4. Still, we adopted the reddening law by Cardelli et al. (1989) assuming . From Hamuy et al. (1996a) we obtain mag and mag ( mag and mag for mag), whereas the Phillips et al.’s (1999) yields mag and mag ( mag and mag for mag). A conservative estimate of the formal uncertainty for is mag. Note that Phillips et al. (1999) give only the variation of absolute magnitude with for ones where mag (however quoted by Stritzinger et al. 2002). Our estimated extinction agrees well with that from spectroscopy, which confirms the reliability of the results.
Checks can also be performed using our NIR data. Meikle (2000) finds that 6 out of 8 examined Type Ia SNe have similar coeval absolute magnitudes at ( days past ). Using the mean values and our interpolated magnitudes for that epoch, we obtain and mag at , and respectively. Note that is discrepant with respect to and for any reddening law, in the sense that no common exists yielding a single distance modulus. Using our preferred value of mag results in and mag from , and respectively. Although and estimates agree with previous determinations, produces a much smaller value. This suggests that SN 2000E must have a brighter intrinsic magnitude with respect to the sample of Meikle (2000), if the distance modulus derived from needs to be larger (so as to agree with those derived from H and K). Clearly, more data are needed to establish meaningful absolute magnitudes at NIR wavelengths. Furthermore, whereas the previous distance determinations are based on the Cepheid scale as given by Sandage et al. (1996) and Saha et al. (1997), Meikle (2000) adopts the revised Cepheid scale of Gibson et al. (2000), whose zero point is mag less (i. e., the values according with the older scale are to be decreased by 0.12 mag).
Similarly, Krisciunas et al. (2003) show that the absolute magnitude of SNe Ia at -band 10 days past maximum light is a flat function of and find a mean value . Assuming mag and the reddening law of Cardelli et al. (1989), along with an interpolation of our data to this epoch, this yields mag. This is significantly less than all other determinations, except for the one from the absolute magnitude at . However, the discrepancy appears to be due to the different Cepheid scale used by the authors. In fact, the given is on the Cepheid scale as revised by Freedman et al. (2001); a comparison between their distances (see their Tab. 3) and those listed by Sandage et al. (1996) and Saha et al. (1997) and adopted in the previous methods indicates a mean difference of mag, in the sense that distance moduli from Freedman et al. (2001) are smaller.
In summary, different techniques produce distance moduli ranging
from to mag, with most of them consistent
with mag. When the calculation of is also
involved, the estimated extinction is always consistent with the constraints
given in Sect. 3.3. This appears to lie within
mag, so its uncertainty cannot contribute more than mag to
the estimated variations of .
An average of all values found through
the brightness and colors of SN 2000E yields mag.
However, using the determinations consistent with the older Cepheid scale
of Sandage et al. (1996) and Saha et al. (1997) yields mag. This choice is being made because our estimates are mainly based
on the MLCS method, whose results are being so far reported in the literature
mostly with respect to the older scale. Anyway, MLCS distances can be
shifted to the latest Cepheid scale by subtracting mag from
(A. Riess, private communication).
3.5 Bolometric behavior of SN 2000E
All measurements in the bands were dereddened according to the extinction mag derived in Sect. 3.3. The optical magnitudes were converted to fluxes according to Bessel (1979) and, in the NIR bands, the calibration given for the UKIRT standard. We constructed the curve of the bolometric luminosity using the results of spline fits to the LCs in order to have homogeneous sets of magnitudes at all wavelengths for each epoch. was estimated by assuming mag before JD+575 (according to the earliest measurement) and by approximating the LC using three different segments through the available data points after JD+575.
Experiments with blackbody fits according to the technique described in Di Carlo et al. (2002) indicates that the SN emission is reminiscent of a blackbody only at earlier epochs (before ). So, we determined the bolometric luminosity just as the area of the trapezium connecting the fluxes. We used a distance of Mpc, as previously estimated. We did not use magnitudes before JD+575; after this epoch, the same values as estimated for the blackbody fits were adopted and we set the flux to 0 at 3000 Å (see Suntzeff 1996). Table 6 lists the (uvoir) bolometric luminosity and Fig. 9 shows the time evolution of the uvoir luminosity, compared with that of SN 1994D, a fast declining SN Ia (Salvo et al. 2001). Integrating the bolometric curve from JD+561 to JD+690 (i. e., 16 days before to 113 days past it) yields ergs.
| Julian Day | Epoch | Bolometric |
|---|---|---|
| Luminosity | ||
| (uvoir) | ||
| (2451000+) | (days) | ( erg s-1) |
The uncertainty, excluding that inherent to distance and reddening, should be below %. Nevertheless, before JD+575 (phase d) uvoir fluxes should be corrected of a factor up to due to the lack of measurements at . This explains the small break in the uvoir curve around phase d evident in Fig. 9. Leibundgut & Pinto (1992) note that the use of broad-band filters to integrate the uvoir fluxes tends to overestimate the bolometric luminosity for emission-line objects; they infer, however, that the effect should be %. At late time (beyond days after ), the derived bolometric luminosities are less reliable, due to the poorer representation of the true light curves given by the spline fits between JD+612 and JD+690. The estimate of the total initial mass of 56Ni follows from the prescription of Arnett (1982), according to which the bolometric luminosity at maximum equals the radioactive input of 56Ni. However, this requires a knowledge of the rise time; we assumed it to be 18 days, which is the least value consistent with the earliest detection of SN2000E. Using the relation given by Branch (1992) for the radioactive decay of 56Ni, we obtained a 56Ni mass of M☉. The given uncertainty only reflects that in and the lower value of 56Ni mass would be obtained from the Tully-Fisher distance. Since the uvoir integration is performed from 3000 Å to m, it is very unlikely that the bolometric flux (hence, the 56Ni mass) is underestimated by more than 10 % at maximum light. Increasing the rise time to 21.4 days (the value envisaged by Riess et al. 1999 for ) would result in a 56Ni mass 19 % larger. Another error of % accounts for an uncertainty of 0.3 mag in . The radioactive decay curve (Branch 1992) for 0.9 M☉ of 56Ni assuming a rise time of 18 days is shown in Fig. 9.

3.6 Spectroscopy
Figure 10 illustrates the spectroscopic evolution of SN 2000E from phase to d (i. e., time since ).

The spectral evolution of SN 2000E follows the normal SNe Ia pattern (cfr. Figure 18.3 of Wheeler & Benetti 2000). The SiII 6355 Å and the CaII H&K absorptions are always the most intense features of the spectrum. Also typical is the evolution of the SII doublet at about 5000 Å(labeled in Fig. 10), which remains almost unchanged before maximum, while it is disappearing by phased. The photospheric expansion velocities deduced from the SiII 6355 Å minima show a small decline from 10900 km s-1 roughly 6 days before maximum to 10300 km s-1 at phase of d. Most SNe show changes in expansion velocities from -6 to +8 days in the range km s-1 (see, e. g., Fig. 10 of Patat et al. 1996 and Fig. 11 of Salvo et al. 2001), whereas SN 2000E shows a decrease of only 600 km s-1. Therefore one may wonder whether this exceptional behavior of SN 2000E is manifest in other ways.
Small differences between spectroscopically normal Type Ia SNe are seen as small spectral details when spectra at similar epoch are compared (Fig. 11). This is particularly true well before maximum (S. Benetti et al., in preparation).

Vinkó et al. (2001) discuss spectral characteristics of overluminous SN 1991T-type objects and their analogy with SN 2000E. This subgroup of Type Ia SNe show peculiar pre-maximum spectra consisting of less prominent features with a few ionized Fe lines but without Si or S lines (Li et al. 2001). Conversely, these lines can be easily identified in our pre-maximum (6 days before ) spectrum of SN 2000E taken with the CT. This is shown in Fig. 11 along with others of comparable phase from three SNe Ia (including SN 1991T) exhibiting the same . The spectra are all in the rest frame of the host galaxies and have been dereddened [see S. Benetti et al., in preparation, for SN 2002bo, Hamuy et al. 2003 for SN 1999ee, Mazzali, Danziger & Turatto 1995 for SN 1991T although this has been corrected for mag following Phillips et al. 1999]. In the Figure, the spectra have been plotted following the intermediate mass elements (mostly CaII, SII and SiII) P-Cygni line strength: with SN 2002bo having the strongest lines, down to the peculiar SN 1991T with no intermediate mass elements lines in the spectrum. While all the SNe shown in the figure have similar continua, which means they have similar photospheric temperatures, the SiII 6355 Å trough shows different shapes: broad and slightly asymmetric in SN 2002bo; with a composite profile (broad wing and narrow core) in SN 2000E and SN 1990N; again, broad and slightly asymmetric in SN 1999ee (even if it is less deep than in SN 2002bo); absent in SN 1991T. However, Figure 11 shows that the spectrum of SN 2000E is almost identical to that of the SN 1990N, that is a spectroscopically normal SN Ia with mag (Lira et al. 1998). In fact, Hamuy et al. (2003) show that not all slow-decliners are spectroscopically peculiar before and distinguish between 1991T-like events and 1999aa-like events.
3.7 The photosphere before maximum light
The available spectroscopic data for SNe Ia indicate that longward of , pre-maximum spectra are roughly approximated by blackbody spectra, although the fit quality worsens with time (see Meikle et al. 1996, Hamuy et al. 2003; also Suntzeff 2003). Pre-maximum NIR spectra of SN 1999ee, a slow-declining SN Ia, are remarkably almost featureless (Hamuy et al. 2003). But, also in the optical, pre-maximum spectra down to -band wavelengths appear much less line-dominated than those past maximum, as can be seen from those shown in Fig. 10 and 11. Figure 6 of Meikle et al. (1996) suggests that the blackbody approximation is no longer satisfactory later than one week before , but it is acceptable probably until the diffusion time remains longer than the elapsed one (see also Arnett 1982). If this is true, a color temperature may be derived from a blackbody fit to the fluxes. In turn, this can be used in order to estimate the surface flux and the evolution of the photosphere during the rise time. After that epoch, the spectra shown in Meikle et al. (1996) and Hamuy et al. (2003) are evidently poorly fitted by blackbodies.
Unfortunately, we do not have a full coverage before at all wavelengths, so we adopted the magnitudes from the spline fits to only. These were dereddened assuming mag. We used the fitting procedure described in Di Carlo et al. (2002) in order to derive the blackbody temperature; with three points only, it is more or less equivalent to determine the slope of the SED from to . Once a temperature is derived as a function of phase, photospheric radii are computed for each passband effective wavelength from the ratio of blackbody to observed (dereddened) flux scaled to the assumed distance. The velocity is then obtained assuming a rise time of 18 days. These are illustrated in Fig. 12b. The photospheric velocities are of the same order of magnitude as the expected ones ( km s-1). However, a comparison with the velocities obtained from the absorption of the SII line at 5640 Å (also drawn in Fig. 12b) in the spectra of SN 2000E shows that the two estimates are similar 6 days before , but whereas the spectroscopic values decline quite slowly at least until two days after , the photometric values fastly decrease. This may be due to the increasing departure of the SED from a blackbody when approaching . If taken at face value, our blackbody estimates would suggest that the photosphere started receding not later than JD+569–JD+570 (phase tod). This behavior is determined by the changing in temperature, first decreasing from K to K between JD+561 (phase d) and JD+565 (phase d), then increasing again. This causes the reverse of velocity and, later, of radius evidenced in Fig. 12b. It is clear from the color-color diagram of Fig. 12a, after dereddening according mag and =3.1, that the temperature evolution is mainly driven by the increase of from phase to d and the subsequent decrease within the range of blackbody colors for K to K (also shown in figure). Although , unlike , does not lie within this range, the difference is only 0.1-0.2 mag and the approximation may still be good. The increasing departure of from the locus of blackbody colors starting at phase d and the decrease of towards values typical of temperatures of K may be just other symptoms of the worsening of the blackbody approximation.

4 Discussion
A careful comparison of optical and infrared LCs with templates and data from other SNe Ia has shown that SN 2000E is what is usually referred to as a slow decliner. We can check the overluminous nature of SN 2000E through its absolute magnitudes at peak as derived from the only independent distance estimates available (based on the Tully-Fisher relation). These may be compared with those of an overluminous SN Ia on the same distance scale. SN 1991T is well suited to this; using the photometry from Lira et al. (1998) and the distance (which is also in the Tully-Fisher scale) and extinxtion given by Mazzali et al. (1995), we obtain mag, mag, mag and mag. Even with a reddening as low as mag, SN 2000E would have mag, mag, mag and mag. Most of the values are only mag larger, hence it is quite likely that SN 2000E is an overluminous Type Ia SN, in the sense that it lies at the high luminosity end of the observational range.
It appears that the photometric behavior of SN 2000E is quite standard for a slow-declining overluminous Type Ia SN. The reduced extinction at NIR wavelengths may pave the way towards a significant reduction of uncertainty in distance determinations using SNe Ia as standard candles, if relations between morphological features of LCs and absolute magnitudes do exist. The first results (e. g., Meikle 2000) are encouraging, but more work is needed, especially more NIR observations of a number of representative objects which allow one to understand the complex behavior of LCs around the two peaks as a function of luminosity. Yet, the characteristic shape of light curves in the NIR appears potentially suitable for testing the physical mechanisms occurring in Type Ia SNe. These mechanisms should account not only for the double-peak morphology of LCs, but also for the color evolution at NIR wavelengths, such as the “crossing” of main sequence in a color-color diagram during the period spanning the first peak and the minimum between peaks. This appears as the main common behavior of Type Ia SNe in a vs. diagram (see Fig. 7). NIR spectra (Meikle et al. 1996, Hamuy et al. 2003) indicate that the crossing is mainly caused by a flux deficit around m which develops past . In the case of SN 2000E, not only the same double-peak morphology exhibited at is apparent in the and LCs (see Fig. 2), but the same physical mechanism involved does appear to affect the light curve at , as well, and this is clearly noticeable in the colors of SN 2000E (Fig. 5). In fact, from the time of the first NIR peak to that of the NIR minimum, gets redder roughly linearly; then this reddening continues with a steeper slope, until the time of the secondary NIR peak, which appears to coincide with that of the peak at . Afterwards, the Lira sequence starts. This analogy between and must not be unexpected, in view of the existence of well defined loci in the minus NIR diagrams both for mid-decliners and for slow-decliners (see Sect. 3.3).
The effect imprinting all LCs longward of leaves its signature also in the bolometric curve showing up as a well marked shoulder around the epoch of the secondary maximum (Fig. 9). The bump on bolometric LCs days past was pointed out by Suntzeff (1996) and Contardo, Leibundgut & Vacca (2000). Although the strength of this feature varies even among overluminous SNe Ia, it seems that underluminous SNe Ia do not exhibit it (see Fig. 5 of Contardo et al. 2000, also Suntzeff 2003). All this suggests that the double-peak structure is not a mere redistribution of photons from blue to red wavelengths. As noted by Candia et al. (2003), both the energy source for the bolometric LC and the optical depth to gamma rays are monotonically declining at the epoch of the shoulder (see also our Fig. 9), so it must be associated with cooling mechanisms and not to energy input. Two explanations have been suggested for the NIR double-peak morphology. Hoflich, Khokhlov & Wheeler (1995) find that in some of their delayed detonation models the photospheric radius still increases well after . Since the NIR flux is roughly , the decrease in is at a point compensated by the increase of . Conversely, Pinto & Eastman (2000b) propose that the photosphere recedes rapidly to the center of the supernova in the NIR. Hence, after peak the temperature of the photosphere and the ionization state of the gas decrease leading to a reduction in opacity and to an increase in emissivity at longer wavelengths. This allows energy previously stored within the SN to rapidly escape in the infrared. This view seems to be confirmed by the most recent spectroscopic data (Hamuy et al. 2003) and would explain the deficit causing the “crossing” in vs. diagrams. Moreover, if our finding of a receding photosphere well before is real, this would also favor the suggestion of Pinto & Eastman (2000b).
The noticeable slowing down of the SiII velocities in all SNe around -5 days is plausibly due to the fact that the cores of that absorption line are being formed above the photosphere and therefore at higher velocities than the photosphere, which in fact has receded quickly consistent with the proposal of Pinto & Eastman. It is interesting to note that the velocities of SN 1990N and SN 1999ee (see Fig. 2 of Hamuy et al. 2003), obtained from the absorption minimum of the SiII line at 6355 Å, exhibit a strong decrease from to km s-1 until 5 days before . This early decrease is quite similar to that found for SN 2000E using the blackbody approximation. The same behavior is found also in other Sne Ia (Salvo et al. 2001, in particular their Fig. 11). Whether a particular distribution of Si in the envelope could plausibly have a similar effect is not clear. The reasons for the different behavior of the velocities among SNe Ia is still unknown and remains to be elucidated. This is obviously a critical point which needs also a greater knowledge of the physics of SNe Ia envelopes.
SN 2000E appears to fit a phenomenological sequence describing the behavior of
SNe Ia, which may be summarized as follows. The luminosity is linked
to the mass of synthesized 56Ni (Arnett’s Rule). Overluminous objects show
slow declining light curves at , whereas the opposite occurs for
underluminous objects. Increasing the luminosity, the double-peaked morphology
of NIR LCs develops and the secondary maximum tends to occur later (Phillips
et al. 2003); it also extends shortward, producing a secondary peak at
and a shoulder at . At the same time, this enhances an inflection in the
bolometric LC, as well.
Whether the sequence has a spectroscopic analogue is still debated.
Hamuy et al. (2003) conclude that the photometric properties of luminous SNe
Ia cannot be used to predict spectroscopic peculiarities.
A number of physical processes at work may account for variations of this
picture. For example, the kinetic energy may not be strongly coupled to the
mass of 56Ni; whereas 56Ni drives the luminosity, the kinetic energy
may affect the cooling of the photosphere and, hence, the morphology of LCs
(see the working hypothesis proposed by Candia et al. 2003 to explain the
bolometric behavior of SN 2000cx). The distribution of 56Ni or the
degree of mixing are possibly other important variables.
The nature of these differences arising in the context of the “explosion”
of a white dwarf at the Chandrasekar limit is still an open issue and requires
more theoretical work.
5 Conclusions
We have presented optical and NIR infrared photometry of the Type Ia SN 2000E spanning a period from days ( days in the NIR) before maximum light to days ( days in the NIR) after it, with a good coverage at peak. These data have been complemented with optical spectra from 6 days before maximum light to 122 days after it. However, previous detections set the rise time to at least days. The available optical data show slight discrepancies between different instruments up to mag. Although these differences have a negligible effect on our conclusions it still seems imperative to always acquire high accuracy photometry. Our main conclusions have been:
-
1.
SN 2000E is clearly reddened; we estimated an mag.
-
2.
It is a slowly declining overluminous SN, with and (as defined in the MLCS method).
-
3.
Within the group of overluminous SNe, it is quite a typical representative, exhibiting a double-peak morphology at , and a shoulder both at and in the bolometric light curve at the epoch of the secondary IR maximum.
-
4.
SN 2000E is a spectroscopically “normal” SN Ia; the spectra of slow decliners with the same trace a sequence where the lines of SII and SiII display a decreasing intensity down to the spectroscopically peculiar SN 1991T.
-
5.
SN 2000E fits a phenomenological picture of SNe Ia in which more luminous objects exhibit slowly-declining optical light curves and more strongly developed two-peak morphology of NIR light curves, with imprints at even shorter wavelengths (down to ) and in the bolometric light curve.
-
6.
The shoulder in the bolometric light curves at the epoch of the secondary IR peak and the width of wavelength range involved (from to ) clearly indicate that the double-peak morphology in the NIR light curves is not due to mere redistribution of flux from blue to red, but implies some sort of photospheric cooling and opacity variation with rapid escape of previously stored energy.
-
7.
In a vs. diagram, all SNe Ia exhibit a continuously evolving NIR excess with a similar crossing of the locus of main sequence during the period spanning the date of the main NIR peak and that of the minimum between peaks.
-
8.
Based on the optical and NIR data, we revised the distance to the host galaxy, NGC 6951, through the MLCS method, decline-rate estimated intrinsic brightness, and absolute NIR magnitudes 10 and 13.75 days past maximum light. We found an average value mag, based on the Sandage-Saha Cepheid calibration.
-
9.
At the estimated distance, the peak bolometric luminosity is ergs s-1 corresponding to a mass of 56Ni of (assuming a rise time of 18 days).
-
10.
If the photosphere can be approximated by a blackbody during the LC rising phase, then we find that it starts receding well before maximum light. The approximation is probably no longer valid already one week before maximum light.
References
- Arnett (1982) Arnett, W. D. 1982, ApJ, 253, 785
- Bessel (1979) Bessel, M. S. 1979, PASP, 91, 589
- Branch (1992) Branch, D. 1992, ApJ, 392, 35
- (4) Burnstein, D., & Heiles, C. 1982, AJ, 87, 1165
- (5) Candia, P., et al. 2003, PASP, in press
- Cardelli et al. (1989) Cardelli, J. A., Clayton, G. C., & Mathis, J. S. 1989, ApJ, 345, 245
- Contardo (2000) Contardo, G., Leibundgut, B., & Vacca, W. D. 2000, A&A, 359, 876
- (8) D’Alessio, F., et al. 2000, in Proc. SPIE 4008, ed. I. Masanori & A. F. Moorwood (SPIE Press), 748
- (9) Di Carlo, E., et al. 2002, ApJ, 573, 144
- (10) Elias, J. H., Frogel, J. A., Hackwell, J. A., & Persson, S. E., 1981, ApJ, 251, 13
- (11) Evans, R., & Corso, G., 2000, IAUC 7359
- (12) Freedman, W., et al. 2001, ApJ, 553, 47
- (13) Gibson, B. K., et al. 2000, ApJ, 529, 723
- (14) Hamuy, M., Phillips, M. M., Suntzeff, N. B., Schommer, R. A., Maza, J., & Aviles, R. 1996a, AJ, 112, 2391
- (15) Hamuy et al. 1996b, AJ, 112, 2408
- Hamuy et al. (2002) Hamuy M., et al. 2002, AJ, 124, 417
- (17) Hamuy, M., et al. 2003, AJ, in Press
- (18) Höflich, P., Khokhlov, A. M., & Wheeler, J. C. 1995, ApJ, 444, 831
- (19) Hunt, L. K., Mannucci, F., Testi, L., Migliorini, S., Stanga, R. M., Baffa, C., Lisi, F. & Vanzi, L. 1998, AJ, 115, 2594.
- Kohno et al. (1999) Kohno, K., Kawabe, R., & Vila-Vilaró, B. 1999, ApJ, 511, 157
- Koornneef (1983) Koornneef, J. 1983, A&A, 128, 84
- (22) Krisciunas, K., Hastings, N. C., Loomis, K., McMillan, R., Rest, A., Riess, A. G. & Stubbs, C. 2000, ApJ, 539, 658
- (23) Krisciunas, K., et al. 2001, AJ, 122, 1616
- (24) Krisciunas, K., et al. 2003, AJ, 125, 166
- Landolt (1992) Landolt, A. U. 1992, AJ, 104, 340
- Leibundgut et al. (1991) Leibundgut, B., Kirshner, R. P., Filippenko, A. V., Shields, J. C., Foltz, C. B., Phillips, M. M., & Sonneborn, G. 1991, ApJ, 371, 23
- (27) Leibundgut, B., & Pinto, P. A. 1992, ApJ, 401,49
- (28) Li, W., Filippenko, A. V., Treffers, R. R., Riess A. G., Hu, J., & Qiu, Y. L. 2001, ApJ, 546, 734
- (29) Lira, P. 1995, Master thesis, Univ. Chile
- (30) Lira, P., Suntzeff, N. B., Phillips, M. M., & Hamuy, M. 1998, AJ, 115, 234
- Lisi et al (1996) Lisi, F., et al. 1996, PASP, 108, 364
- Mazzali (1995) Mazzali, P. A., Danziger, I. J. & Turatto M. 1995, A&A, 297, 509
- (33) Meikle, W. P. S., et al. 1996, MNRAS, 281, 263
- (34) Meikle, W. P. S. 2000, MNRAS, 314, 782
- (35) Nugent, P., Kim, A., & Perlmutter, S. 2002, PASP, 114, 803
- Patat et al. (1996) Patat, F., Benetti, S., Cappellaro, E., Danziger, I. J., della Valle, M., Mazzali, P. A. & Turatto, M. 1996, MNRAS, 278, 111
- (37) Phillips, M. M. 1993, ApJ, 413, L105
- (38) Phillips, M. M., Lira, P., Suntzeff, N. B., Schommer, R. A., Hamuy, M. & Maza, J. 1999, AJ, 118, 1766
- (39) Phillips, M. M., et al. 2002, preprint (astro-ph/0211100)
- (40) Phillips, M. M., et al. 2003, in From Twilight to Highlight - The Physics of Supenovae, ESO/MPA/MPE Workshop, in press
- (41) Piersanti, L., Gagliardi, S., Iben, I. J., & Tornambé, A. 2003, ApJ, 583, 885
- (42) Pinto, P. A., & Eastman, R. G. 2000a, ApJ, 530, 744
- (43) Pinto, P. A., & Eastman, R. G. 2000b, ApJ, 530, 757
- (44) Riess, A. G., Press, W. H. & Kirshner, R. P. 1996, ApJ, 473, 88
- (45) Riess, A. G., et al. 1998, AJ, 116, 1009
- (46) Riess, A. G., et al. 1999, AJ, 118, 2675
- (47) Saha, A., Sandage, A., Labhardt, L., Tammann, G. A., Macchetto, F. D. & Panagia, N. 1997, ApJ, 486, 1
- (48) Salvo, M. E., Cappellaro, E., Mazzali, P. A., Benetti, S., Danziger, I. J., Patat, F.,& Turatto, M. 2001, MNRAS, 321, 254
- (49) Sandage, A., Saha, A., Tammann, G. A., Labhart, L., Panagia, N., & Macchetto, F. D. 1996, ApJ, 460, L15
- (50) Schlegel, D., Finkbeiner, D., & Davis, M. 1998, ApJ, 500, 525
- (51) Stritzinger, M., et al. 2002, AJ, 124, 2100
- (52) Strolger, L. G., et al. 2002, AJ, 124, 2905
- (53) Suntzeff, N. B. 1996, in IAU Colloquium 145, Supernovae and Supernovae Remnants, ed. R. McCray & Z. Wang (Cambridge: Cambridge University Press), 41
- (54) Suntzeff, N. B. 2003, in Proc. of the ESO/MPA/MPE Workshop, From Twilight to Highlight: The Physics of Supernovae, ed. B. Leibundgut & W. Hillenbrandt (Springer-Verlag), preprint (astro-ph/0212561)
- (55) Turatto, M., Benetti, S., & Cappellaro, E. 2003, in Proc. of the ESO/MPA/MPE Workshop, From Twilight to Highlight: The Physics of Supernovae, ed. B. Leibundgut & W. Hillenbrandt (Springer-Verlag), preprint (astro-ph/0211219)
- (56) Turatto, M., Galletta, G., & Cappellaro, E. 2000, IAUC 7351
- (57) Valentini, G., et al. 2000, IAUC 7351.
- Vinko et al. (2001) Vinkó, J., et al. 2001, A&A, 372, 824
- Wheeler & Benetti (2000) Wheeler, J. C., & Benetti, S. 2000, Chapter of Allen’s Astrophysical Quantities (IVth edition, AIP Press), 451