MULTICOLOR PHOTOMETRY OF THE GALAXIES IN ABELL 2255 BY THE BATC AND SDSS SURVEYS
Abstract
We present our optical multicolor photometry for the nearby cluster of galaxies Abell 2255 with 13 intermediate filters in the Beijing-Arizona-Taiwan-Connecticut (BATC) system which cover an optical wavelength range from 3000 to 10000 Å. The spectral energy distributions (SEDs) in the optical band for more than 7000 sources are achieved down to in a field of 58’ 58’ centered on this rich cluster. Abell 2255 has been recently observed by the Sloan Digital Sky Survey (SDSS) down to spectroscopically and photometrically. A method of combining the SDSS photometric data in five broad bands and the BATC SEDs is then explored. A sample of 254 galaxies with known redshifts in the region of Abell 2255 is constructed for testing the reliability of the method of combining SEDs. Our application of the technique of photometric redshift on this sample shows that the combined SEDs with higher resolution could lead to a more accurate estimate of photometric redshift. Based on 214 spectroscopically confirmed member galaxies, spatial and dynamical properties of this cluster are studied. Bimodality and large dispersion in the velocity distribution indicate that Abell 2255 is an unrelaxed system. A tight color-magnitude correlation for 188 known early-type cluster galaxies is found. After an exclusion of 254 extragalactic sources with known redshifts, the combined SEDs for 2522 galaxies allow a further membership selection by the photometric redshift technique and color-magnitude correlation. As a result, 313 galaxies with their photometric redshifts between 0.068 and 0.090 are selected as new cluster members. The combined SEDs and estimated redshifts for previously known and newly-selected member galaxies are cataloged. On the basis of the enlarged sample of member galaxies, the spatial distribution, localized velocity structure, color-magnitude relation, and luminosity function of cluster galaxies are discussed. The reverse peculiar velocities are found for two satellite subclusters located on opposite sides of the central concentration, which supports an ongoing merger in Abell 2255.
1 INTRODUCTION
As the largest gravitationally bound systems in the Universe, galaxy clusters have been attracting more and more observational efforts in the last decade. According to the hierarchical models for large-scale structure formation in the picture of cold dark matter, galaxy clusters are built up by the process of hierarchical clustering in which larger clusters are formed by the coalescence of smaller clusters. Strong gravitational encounters between galaxy clusters are essential in forming the structures we observe today. This scenario is supported by the recent X-ray observations of some nearby rich clusters which give convincing evidence for a ongoing merger event (Colless & Dunn 1996). The rich cluster of galaxies, Abell 2255, is one of the well-studied examples.
The nearby galaxy cluster Abell 2255 has recently been observed in radio, optical, and X-ray bands, and a complicated picture of its dynamics, structure of the member galaxies, and intergalactic medium is unveiled. From its radio maps at 20 cm, a diffuse halo source appears at the cluster center, and 6 tailed radio sources are found to be associated with cluster galaxies (Feretti et al 1997). The electrons can be accelerated throughout the cluster to power a radio halo in the outer region if this cluster is undergoing a merger (Tribble 1993). The asymmetric structure in Abell 2255 detected by ROSAT imaging observations and the nonisothermal temperature map of the intracluster gas in this cluster support the discovery of a currently undergoing merger (Davis & White 1998). From the optical point of view, there are two comparably bright galaxies near the cluster center, which is thought to be the evidence of recent merger events with two less massive systems of galaxies (Bird 1994). This scenario is also supported by the unusually large radial velocity dispersion of 1221 km s-1, which may be indicative of the dynamically unrelaxed phase (Zabludoff et al. 1990). Furthermore, the optical images show that the X-ray emission centroid does not coincide with any bright galaxy or galaxy subgroup (Burns et at. 1995). These intriguing observational features may tell us that this cluster is not a simple relaxed structure, but is still forming at the present epoch.
However, no obvious evidences of spatial or kinematical substructure in Abell 2255 was found in optical band (Stauffer et al. 1979; Zabludoff et al. 1990). It is mainly because only the limited number of cluster galaxies brighter than V 16.0 have been spectroscopically observed a decade ago. Recently, accurate photometric data for the objects in this cluster were obtained and distributed by the Sloan Digital Sky Survey (SDSS). However, the SDSS spectroscopic survey covers merely the galaxies brighter than . Based on the luminosity function of cluster galaxies (Lobo, et al. 1997), a typical galaxy with has an apparent magnitude of , fainter than the limit of the SDSS spectroscopic survey. For a better understanding of structure and dynamics of this cluster, the faint member galaxies () should be taken into account. This paper will present our optical photometry of the galaxies in Abell 2255 with the Beijing-Arizona-Taiwan-Connecticut (hereafter BATC) multicolor system. The BATC multicolor photometric survey aims mainly at obtaining the spectral energy distribution (SED) information of galaxies with redshift less than 0.5 (Xia et al. 2002), by using the 60/90 cm Schmidt Telescope of Beijing Astronomical Observatory (BAO) with 15 intermediate-band filters. Our previous work shows that the multicolor photometry with 1-meter class Schmidt Telescope can provide the SED information for all the objects within a large field of view ( 1 deg2) centered on a nearby galaxy cluster, which will facilitate the follow-up investigations on membership selection and the color-magnitude relation (Yuan et al. 2001). Since the accuracy of photometric redshifts is heavily dependent upon the number of filters (i.e., spectral resolution) and the photometric accuracy in each band (Xia et al. 2002), the SDSS photometric data in five photometric bands (Fukugita et al. 1996) will be combined with the BATC SEDs for all the objects detected within our field. Current study will result in an SED catalog of not only previously known (bright) member galaxies but the newly-selected faint members. Based on the enlarged sample of cluster galaxies, the spatial distribution, dynamics, color properties and luminosity function of cluster galaxies in Abell 2255 can be then addressed.
The structure of this paper is as follows. In §2, we present the BATC multicolor photometric observations and data reduction, as well as the cross-identification between the BATC and SDSS photometric catalogs. The methodology of combining the SDSS SEDs with the BATC SEDs are detailed in §3. The analysis of SED features for the previously known member galaxies is shown in §4, and the combined SEDs of known galaxies in Abell 2255 are also cataloged. The further SED selection of faint members is given in §5. The dynamical and color properties of the enlarged sample of cluster galaxies is presented in §6, as well as the luminosity function of cluster galaxies. Finally, we give a summary in §7. The cosmological parameters =50 km s-1 Mpc-1 and =0.5 are assumed throughout this paper.
2 OBSERVATIONS AND DATA REDUCTION
Abell 2255 is a nearby ( 0.0806, giving a distance modulus of 38.3; Struble & Rood 1999) cluster of galaxies with richness class 2 in Abell (1958), classified as a type II-III cluster by Bautz & Morgan (1970). The BATC photometric observations of Abell 2255 were taken with the 60/90 cm f/3 Schmidt Telescope of BAO, located at the Xinglong site with an altitude of 900m. A Ford 2048 2048 CCD camera was equipped at the prime focus of the telescope. The field of view was 1.0 square degree, and the spatial scale was per pixel. The combined image in each filter covers a sky region of 59 59 arcmin2, defined by a right ascension range from .7 to .6, and a declination range from .5 to .8 (for equinox of 2000.0). The BATC filter system includes 15 intermediate-band filters, namely, , , covering the whole optical wavelength range from 3000 to 10000 Å. The details of the BAO Schmidt Telescope, CCD camera and data-acquisition system can be found elsewhere (Fan et al. 1996; Yan et al. 2000). For distinguishing explicitly between the SDSS and BATC filter names, in this paper we refer the SDSS filters and magnitudes to as , , , , and , which corresponds to central wavelengths of 3560, 4680, 6180, 7500 and 8870 Å. The transmissions of the BATC and SDSS filters can been seen in Fig. 1.
Fig. 1: The transmissions of the BATC and SDSS filters
Only 13 BATC filters were used for the multicolor imaging observations of Abell 2255. In total, we have made more than 40 of exposures. After a check of the image quality, 113 images with more than 36 of exposure were selected to be combined. The parameters of the BATC filters we used and the observational details are given in Table 1. The bias subtractions and dome flat-field corrections were done on the CCD images, using Pipeline 1, the automatic data reduction code for the BATC survey. The cosmic ray and bad pixel effect were corrected by comparing the images. Before combination, the images were re-centered and position calibration was performed by using the Guide Star Catalog (GSC). The processes of the point spread function (PSF) fitting and the aperture photometries with different apertures were performed for the objects detected in the images of at least 3 filter bands, using the code named as Pipeline 2 (Zhou, et al. 2003). As a result, the list of PSF and aperture magnitudes in various filter bands was obtained for all the objects detected. For the bright galaxies in the region of Abell 2255, we adopted the aperture magnitudes defined by a fixed aperture with a radius of 4 pixels (i.e., 6.8 arcsec) which is large enough to make different seeing effects negligible. Although the magnitudes measured with a fixed aperture are not the same as the total magnitudes of galaxies in the literature, this is a proper way to obtain the reliable color indices (i.e., relative SEDs) of all the objects. Since the adopted aperture size is rather large, contamination of the light by nearby objects may sometimes not be negligible. The number of sources detected in the combined images are shown in Table 1, along with the details of the observations.
| No. | Filter | FWHM | Exposure | Number of | Seeinga | Objects | Limiting | |
|---|---|---|---|---|---|---|---|---|
| name | (Å) | (Å) | (second) | Images | (arcsec) | Detected | mag | |
| 1 | b | 3907 | 291 | 10800 | 9 | 4.74 | 5678 | 20.5 |
| 2 | d | 4540 | 332 | 13200 | 11 | 5.45 | 6816 | 20.5 |
| 3 | e | 4925 | 374 | 12000 | 10 | 4.32 | 7227 | 20.0 |
| 4 | f | 5267 | 344 | 11400 | 10 | 4.98 | 7253 | 20.0 |
| 5 | g | 5790 | 289 | 7200 | 6 | 3.96 | 7337 | 20.0 |
| 6 | h | 6074 | 308 | 6950 | 7 | 4.18 | 7319 | 20.0 |
| 7 | i | 6656 | 491 | 12900 | 12 | 4.61 | 6884 | 19.5 |
| 8 | j | 7057 | 238 | 4800 | 4 | 4.36 | 7437 | 20.0 |
| 9 | k | 7546 | 192 | 4800 | 4 | 4.62 | 7386 | 19.0 |
| 10 | m | 8023 | 255 | 14400 | 12 | 4.11 | 7368 | 19.0 |
| 11 | n | 8484 | 167 | 9600 | 8 | 5.13 | 7047 | 19.0 |
| 12 | o | 9182 | 247 | 12000 | 10 | 3.81 | 7355 | 18.5 |
| 13 | p | 9739 | 275 | 12000 | 10 | 4.21 | 6796 | 18.5 |
a This column lists the seeings of the combined images.
To obtain the relative SEDs of objects in this field, the model calibration was made for the combined images. This method was developed to calibrate the SEDs of objects in a large field of view on the basis of the SED library, especially for the BATC multicolor photometric system (Zhou et al. 1999). No calibration images of the standard stars are needed to derive the relative SEDs.
It can be expected that the SDSS photometric data can be used to do flux calibration of the BATC SEDs, which will be described in next section. Therefore we cross-identified all the sources detected by both photometric observations. All the sources in the BATC catalog within the searching circle (defined by a radius of 2.0 arcsec) centered on the SDSS sources were extracted. By comparing the SED features, the identification was rather unambiguous. According to the morphology classification given in the SDSS photometric catalog, 3651 point sources (stars) and 2790 extended sources (galaxies) were found in both surveys. Furthermore, we extracted the BATC and SDSS photometric information for all known extragalactic objects listed in the NASA/IPAC Extragalactic Database (NED). There are 340 known sources in our observation field, among which 274 (81%) are galaxies and 14 (4%) are quasars. The remainder are sources that appear only in one of surveys from radio, infrared, X-ray, and -ray wavebands. Some 254 galaxies have been found to have NED-given spectroscopic redshifts. The counterparts for those 254 galaxies with known spectroscopic redshifts were found in both of the BATC and SDSS imaging observations, which offers a good sample for our further analyses.
3 METHOD OF COMBINING THE SDSS AND BATC SEDS
It is clear that combination of the BATC SEDs with the SDSS photometric data will lead to a more accurate estimate of photometric redshift. Therefore we tried to derive the SDSS colors of galaxies through the same aperture as defined by the BATC photometry (i.e., aperture radius 6.8 arcsec), using the photometric parameters provided by the SDSS Early Data Release (EDR; Stoughton et al. 2002). The SDSS imaging observations of Abell 2255 were carried out by drift scanning with a spatial scale of 0.4 arcsec pix-1 in five broad bandpasses. The effective integration time was 54 seconds, and all images were reduced with software specially designed for the SDSS data (Lupton et al. 2001).
3.1 Aperture Correction of the SDSS Photometries for Galaxies
For a given bright galaxy detected by the SDSS imaging observation, the observed profile of surface brightness is quantified by some global photometric parameters, such as the likelihood parameters for various models, the effective radius () along the major axis, and the model magnitude () which represents the total magnitude estimated by the optimum model in the band. The three following models were used to fit the observed surface-brightness profile: (i) the point spread function (PSF) model, (ii) de Vaucouleurs (1948) model, and (iii) exponential model. The model magnitudes in other four bands were calculated using the effective radius defined by the preferential modelling in the band. Some studies show that the de Vaucouleurs model appears to be a very good fit to the elliptical galaxies’ surface-brightness (de Vaucouleurs & Capaccioli 1979; Capaccioli et al. 1990). The difference between the model magnitude () and the magnitude within a given aperture () can be derived by
| (1) |
where is the profile function of surface intensity defined as
| (5) |
for the de Vaucouleurs model, or
| (9) |
for the exponential model, where the dimensionless quantities and are intensities relative to the amplitude at and , respectively: and . The aperture correction is the same for the model magnitudes in five SDSS filters, since the model with higher likelihood in the filter is selected to be used in the other bands with the same effective radius for a specific object, allowing only the amplitude to vary.
It is well known that the vast majority of stars detected in the BATC observations have the brightness profiles which can be well modelled by the point spread function (PSF). Therefore we adopted the PSF magnitudes in the BATC and SDSS observations as optimal measures of the fluxes of stars.
3.2 Flux Calibration of the BATC SEDs
The SDSS model magnitudes are flux-calibrated by comparison with a set of overlapping standard-star fields calibrated with a 0.5-m “photometric Telescope”. The uncertainties of the model magnitudes are also listed in the SDSS EDR photometric catalog. In general, the error for model magnitude is larger than those in other bands, and brighter sources have less fitting uncertainties. For a known galaxy having , the typical error is less than 0.1.
As we mentioned above, the BATC SEDs were calibrated by comparing with the SED library of bright stars in the BATC field. After the model calibrations, the relative SEDs for all the objects in the BATC photometric field were obtained. The zero-point of the BATC SEDs of galaxies can be determined by the aperture-corrected SDSS SEDs. Fig. 2 shows the relative SEDs in the BATC and SDSS multicolor systems for SDSS J171236.07+640508.0, the central early-type galaxy in Abell 2255 cluster. The zero-point of the BATC SEDs can be derived simply by averaging the magnitude differences at 6166 and 7480 Å, the effective wavelengths of and filters. The interpolation can be used to derive the BATC magnitudes at 6166 and 7480 Å, based on the magnitudes in the neighboring BATC bands. The flux zero-points for different galaxies are slightly different, since the deviation of the surface-brightness profile from the preferential model is different from source to source.
In calculation of flux zero-point for each star, we directly used the PSF magnitudes measured in BATC and SDSS images. No aperture corrections are needed for the SDSS magnitudes of stars. The average value of magnitude differences at 6166 and 7480 Å is also defined as the flux zero-point for each star. We present the zero-point distribution for all the stars and galaxies detected by both multicolor surveys in Fig. 3. It can be seen that the stars have more concentrated distribution of SED zero-points (thick line), with a peak at 3.24. A wider range of fitting deviations for galaxies leads to a comparatively scattered zero-point distribution (thin line) with the same typical zero-point.
Fig. 2: BATC and SDSS SEDs for SDSS J171236.07+640508.0
Fig. 3: Zero-point distribution
As a result, we achieved the combined SEDs for 2790 galaxies and 3651 stars detected by BATC and SDSS photometry, including the flux-calibrated BATC SEDs in 13 filter bands and the aperture-corrected SDSS SEDs in 5 filter bands. This SED catalog can be electronically provided upon request.
To describe the errors of BATC magnitudes, we separated all the objects into several sub-groups with magnitude interval of 0.5 mag, and the mean measurement errors at specified magnitudes were derived. We found that the measurement error for each filter band tends to be larger at fainter depth. Except for the , and magnitudes, the errors are about for bright stars (say, ), and less than at . The measurement errors in , and magnitudes are found to be larger just because of the low sensitivity of our CCD detector in redder filter bands.
4 ANALYSES OF 254 GALAXIES WITH KNOWN SPECTROSCOPIC REDSHIFTS
4.1 Velocity Distribution and SED Catalog
Burns et al. (1995) studied the distribution of measured galaxy velocities for Abell 2255 by using the software. Two resistant and robust estimators analogous to the velocity mean and standard deviation, namely the biweight location () and scale (), are defined to characterize the shape of the velocity distribution (Beers et al. 1990). Burns et al. (1995) found km s-1and km s-1with only 39 member galaxies. We have 254 galaxies with known spectroscopic redshifts within our field. The distribution of spectroscopic redshifts for all these known galaxies is shown in panel (a) of Fig. 4. There are 214 galaxies occurring in the redshift range of 21,000 km s-1 29,000 km s-1, with a sharp peak at 24,800 km s-1. We also calculated the biweight location and scale for these 214 galaxies using the ROSTAT software, and achieved and in km s-1. Compared with the results in Burns et al. (1995), the biweight location is smaller and the biweight scale becomes larger with smaller uncertainties. We fitted the velocity distribution in Fig. 4b with single Gaussian, but the Kolmogorov-Smirnov test and Shapiro-Wilk W-test reject a Gaussian distribution at more than 99% confidence level.
We tried to detect and quantify the presence of bimodality in velocity distribution with the KMM algorithm code (Ashman, Bird & Zepf 1994). Two equal-variance Gaussian components with velocity mean values of 23942 and 27454 km s-1were found to have a good fit with a mixing proportion of 94.2%:5.8%. The KMM algorithm also allows partitioning of data into individual groups. Only 12 (5.8%) cluster galaxies belong to the Gaussian component centered at 27454 km s-1, and they are scattered in this field. The confidence level of rejecting the single Gaussian model is nearly 100%. The significant deviation from single Gaussian distribution and unusually large velocity dispersion might reflect some clues of an unrelaxed system.
Fig. 4: Radial velocity distribution for 214 member galaxies
Table 2 presents the combined SEDs of 254 galaxies with known spectroscopic redshifts, which is structured as follows:
| Column 1: | Number of the galaxies (sorted by the distance to cluster center); |
| Column 2: | R.A. in 2000 epoch, in “hhmmss.s” mode, given by NED; |
| Column 3: | Declination in 2000 epoch, in “ddmmss” mode, given by NED; |
| Column 4: | Spectroscopic redshift, given by NED; |
| Column 5: | Photometric redshift, estimated by the combined SED; |
| Column 6 - 18: | Photometric magnitudes in 13 BATC filter bands. The value of 0.0 |
| means out of field; | |
| Column 19 - 23: | Aperture-corrected photometric magnitudes in five SDSS filter bands. |
It should be noted that the photometric magnitudes given in Table 2 might be somewhat different from the magnitudes given in the literature. What we attempt to obtain is the relative SEDs within a fixed aperture for the galaxies in the region of Abell 2255.
Table 2: Combined SEDs of 254 known galaxies
4.2 Spatial Distribution and Localized Velocity Structure
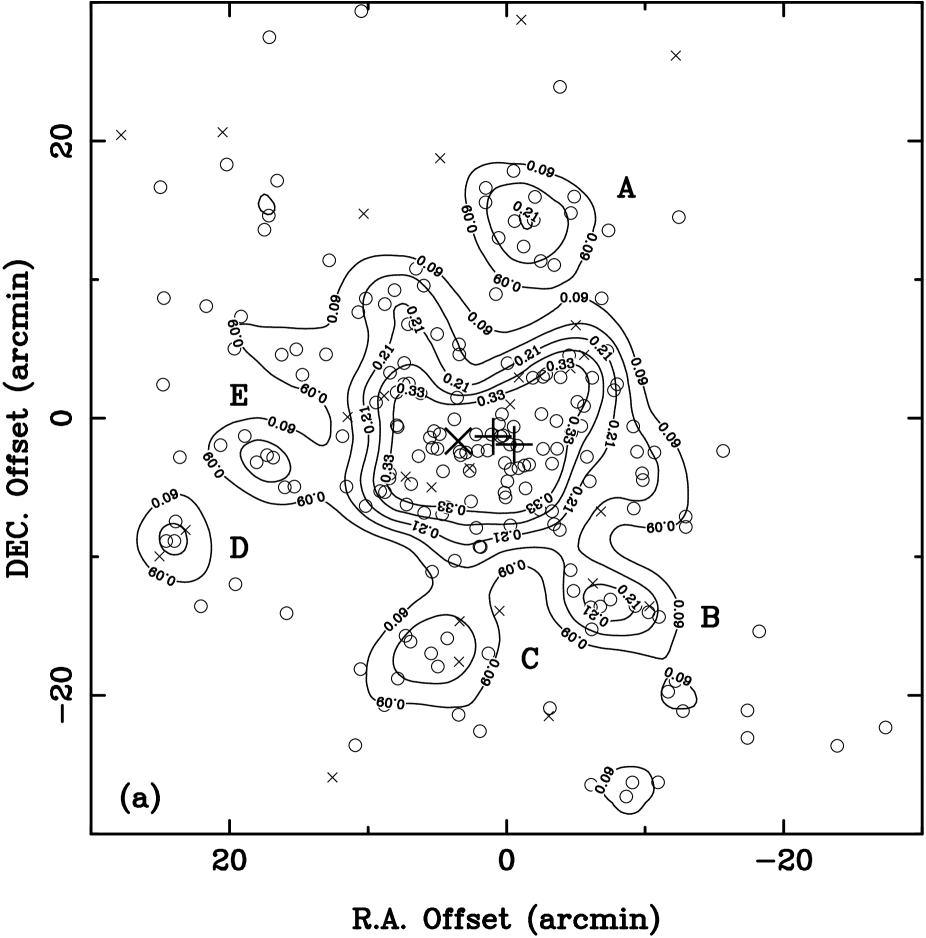
Fig. 5a presents the spatial distribution of 214 known member galaxies within our field of view, including 168 (88%) early-type galaxies and 46 (12%) late-type galaxies, with respect to the NED-given central position of Abell 2255, R.A.=17 and Decl.=64 (for the J2000 equinox). Early- and late-type galaxies are denoted by open circles and crosses, respectively. It can easily be seen that the early-type galaxies dominate in the central region. We superpose the contour map of the surface density which has been smoothed by a Gaussian window with arcmin. The spatial distribution of 214 bright member galaxies seems to deviate from spherically symmetric. The contours of surface density are elongated in an east-west direction in the central region. The isophotes are offset from the positions of two cD galaxies (marked as “”), but seem to have a centroid located between the cD galaxies and the X-ray emission centroid (R.A.=17h12m45s and Decl.=64∘03’54”, mark as “”) derived by the ROSAT imaging observations (Feretti et al. 1997). The contours show that there might be five satellite clumps (i.e., subclusters) of galaxies whose surface densities is more than 0.15 galaxies arcmin-2 (namely A, B, C, D, and E) surrounding the main concentration. The contour curves at 0.15 galaxies arcmin-2 can be used to define the clump areas.
However, these clumps might be enhancements simply due to projection effects. The proper way to find out the true substructures is to observe how significant is the localized variation at clumps’ positions in the line-of-sight velocity distribution. Dressler & Shectman (1988) designed a statistical test, so-called -test, for computing the deviation of local velocity mean and dispersion from those of the overall velocity distribution. In the spirit of -test, Colless & Dunn (1996) developed a new test (so-called -test) for quantifying localized variation in velocity distribution, by defining a new test statistic to characterize the local deviation on the scale of groups of nearest neighbors. The larger , the greater the possibility that the local velocity distribution differs from the overall distribution. The probability that is larger than the observed value , , can be estimated by Monte Carlo simulations by randomly shuffling velocities. Table 3 gives the results of -test for 214 known member galaxies, and the number of simulations is for all cases.
Table 3: Result of -Test for 214 Member Galaxies
| 5 | 6 | 7 | 8 | 9 | 12 | 15 | 20 | |
|---|---|---|---|---|---|---|---|---|
| 0.003 | 0.002 | 0.003 | 0.006 | 0.007 | 0.005 | 0.005 | 0.023 |
The presence of substructures in Abell 2255 is strongly supported by the local velocity variation with a wide range of neighbor sizes. The six nearest neighbors is the optimum scale on which substructure is most obvious. The bubble plot in Fig. 5b shows the location of localized variation using neighbor size , and the bubble size for each galaxy is proportional to . Therefore larger bubbles indicate a greater difference between local and overall velocity distributions. A close comparison between two panels in Fig. 5 shows that the bubble clustering appears at the positions of clumps A, B and C. The clumps D and E seems to be unreal substructures in the line-of-sight velocity distribution. The dynamics for substructures A, B and C will be discussed in §6.
Fig. 5: (a) Spatial distribution for 214 galaxies; (b) Bubble plot
4.3 Color-Magnitude Correlation
A correlation between color and absolute magnitude for early-type galaxies, the so-called C-M correlation, has been found for some rich galaxy clusters (see Bower et al. 1992, and references therein). For the early-type galaxies in a cluster, the fainter galaxies tend to have colors bluer than the brighter galaxies do. The measured magnitudes in BATC and SDSS photometries for the galaxies in Abell 2255 can be directly used to demonstrate the C-M correlation.
Fig. 6 gives plots of two color indices (C.I.’s), and , versus magnitude in the bandpass for 214 known member galaxies in Abell 2255. The galaxies with different morphological types are denoted by different symbols. A very clear C-M correlation can be found for 137 elliptical galaxies, in the sense that the brighter galaxies are redder. We have following linear fits by method of least squares:
The linear fits are plotted as solid lines, and the dashed lines in panels (a) and (b) represent and 0.638, respectively. More than 95% elliptical galaxies are distributed between the dashed lines. The linear relations are quite similar to those we found for bright galaxies in Abell 2634 (Yuan et al. 2001). It is evident that spiral galaxies do not obey such a correlation, and lenticular galaxies behave as something between the ellipticals and the spirals in the C-M relation. Based on the significantly different behavior for galaxies with different morphologic types, the C-M diagram can be used to distinguish early- and late-type galaxies (e.g., Colless & Dunn 1996).
Fig. 6: Color-magnitude diagram for 214 known member galaxies
4.4 Application of the Photometric Redshift Technique
The technique of photometric redshift can be used to estimate the redshifts of galaxies with the combined SED information. For a given object, the photometric redshift, , corresponds to the best fit (in the -sense) of its photometric SED by the set of template spectra. Based on the standard SED-fitting code called HYPERZ (Bolzonella, Miralles, & Pelló 2000), the procedures for estimating the photometric redshifts have been developed especially for the BATC multicolor photometric system (Xia et al. 2002). This technique is traditionally used to search for galaxies or AGNs with comparatively high redshifts. Thanks to the large number of filters (13 BATC bands plus 5 SDSS bands), the accuracy of photometric redshift estimates can be expected to be largely improved even for nearby galaxies. The sample of 254 galaxies with known spectroscopic redshifts allows an opportunity to check whether the method of SED combination for the SDSS and BATC surveys can lead to a more accurate estimate for the nearby galaxies with .
Fig. 7 shows the plot of photometric redshift () versus spectroscopic redshift () for 254 galaxies, including the member galaxies and background galaxies. In our calculations, only the normal galaxies were taken into account in the reference templates, and the reddening law with a by Calzetti et al. (2000) was adopted. The photometric redshift for each known galaxy was searched within a redshift range from 0.0 to 1.0, with a searching step of 0.01. The dotted line in Fig. 7 corresponds to , and the error bar in the determination at 68% confidence level is also given. It can easily be seen that our estimate is basically consistent with the spectroscopic redshift: more than 90% member galaxies in Abell 2255 are found to have , and the background galaxies with also scattered along the critical line . Compared with our previous estimate for the nearby galaxies in Abell 2634 () on the basis of the BATC SED information only (see Fig. 6 in Yuan et al. 2001), this run of determination has smaller uncertainties and deviations in general. Fig. 8 shows an example for the best fit to the combined SED of the early-type galaxy SDSS J171236.07+640508.0. The combined SED has a higher spectral resolution, which is crucial for decreasing the uncertainty of estimate. This result demonstrates not only the efficiency of our SED-fitting procedures, but also the reliability of our method of combining the photometric data from the SDSS and BATC photometric observations.
Fig. 7: for 254 known galaxies
Fig. 8: The best fit of SDSS J171236.07+640508.0
Our method described above opens a straightforward way for obtaining the optical SEDs from the SDSS and BATC multicolor photometries of the faint galaxies. Our investigations on spatial distribution and color-magnitude relation of the galaxies in Abell 2255 can then be extended to an unprecedented depth. It should be noted that the error in the photometric redshift is much larger than the cluster velocity dispersion.
5 SED SELECTION OF FAINT CLUSTER GALAXIES
In total, 6441 objects within our BATC observation field are found to have the counterparts in the SDSS imaging observations, of which 2776 objects are characterized by the SDSS star/galaxy separation pipeline, frames, as extended sources (i.e., galaxies). After an exclusion of 254 known galaxies, there remain 2522 galaxies without any redshift information. Based on their combined SEDs, we applied the photometric redshift technique to them, and derived their optimal estimates of values.
Since the error in determination is larger than the intrinsic dispersion (say, biweight scale ) in distribution of spectroscopic redshift, the distribution for faint cluster galaxies should peak at 0.08 with a larger dispersion. Fig. 9 shows the distribution for 2522 galaxies. The peak at 0.08 should be associated with Abell 2255. Based on the fact that more than 98% known member galaxies are found to have their redshifts within a range of 20,400 km s-1 27,000 km s-1(see Fig. 4), we conservatively adopt this range as the limits for membership determination. As a result, 328 galaxies having their photometric redshifts between 0.068 and 0.090 are selected to be member candidates.
Fig. 9: The distribution for 2522 galaxies
Among 328 member candidates, 266 (81%) galaxies are regarded as early-type galaxies by our SED-fitting procedures. A further selection by C-M correlation for these early-type galaxies can be performed. We find that the majority of early-type candidates agree with the C-M relation derived by 137 bright early-type galaxies in §4.3. However, there are 48 early-type candidates with colors beyond the 2 deviation of intercept, and they might have been misclassified. Taking only the templates of late-type galaxies, we performed the photometric redshift estimate again for these 48 candidates, and 15 candidates are found to have photometric redshifts beyond the range of 0.068 0.090. They are therefore regarded as non-member galaxies, and the remaining 33 galaxies are regarded as late-type member galaxies.
Finally, 313 faint galaxies (including 218 early-types and 95 late-types) are selected as faint member galaxies in Abell 2255. Table 4 presents the catalog of SED information for these new members, as well as SDSS-measured position, value, and morphological class (E, S0, Sa, Sb, Sc, Sd, and Im galaxies are represented by 1 to 7, respectively).
Table 4: SED Catalog of 313 galaxies
6 ANALYSES OF THE ENLARGED SAMPLE OF CLUSTER GALAXIES
6.1 Velocity Distributions and Substructures
Some interesting and unusual characteristics in radio, and X-ray bands support a picture that Abell 2255 may be in the process of merging with a galaxy cluster/group (Feretti et al. 1997). Fig. 10 shows the redshift distributions for (i) 203 galaxies in a central region with a radius of 10 arcmin, (ii) 406 early-type galaxies, (iii) 121 late-type galaxies, and (iv) 527 cluster galaxies in the enlarged sample. Since two peaks, respectively, at 24900 and 23700 km s-1can be found in subset (i),(ii) and the total sample, we assumed two homoscedastic Gaussian components in the KMM algorithm code to search for bimodality in above velocity distributions. However, none of these tests indicate that a bimodal distribution is a statistically significant improvement over the single Gaussian. Compared with the velocity distribution of 214 known galaxies in Fig.4b, the enlarged sample has a larger biweight scale (1848 km s-1). This should be due to the large error in photometric redshift estimate for 313 newly-selected member galaxies, and it will probably smooth the bimodality detected in Fig. 4b.
Fig. 10: Velocity distributions for four samples
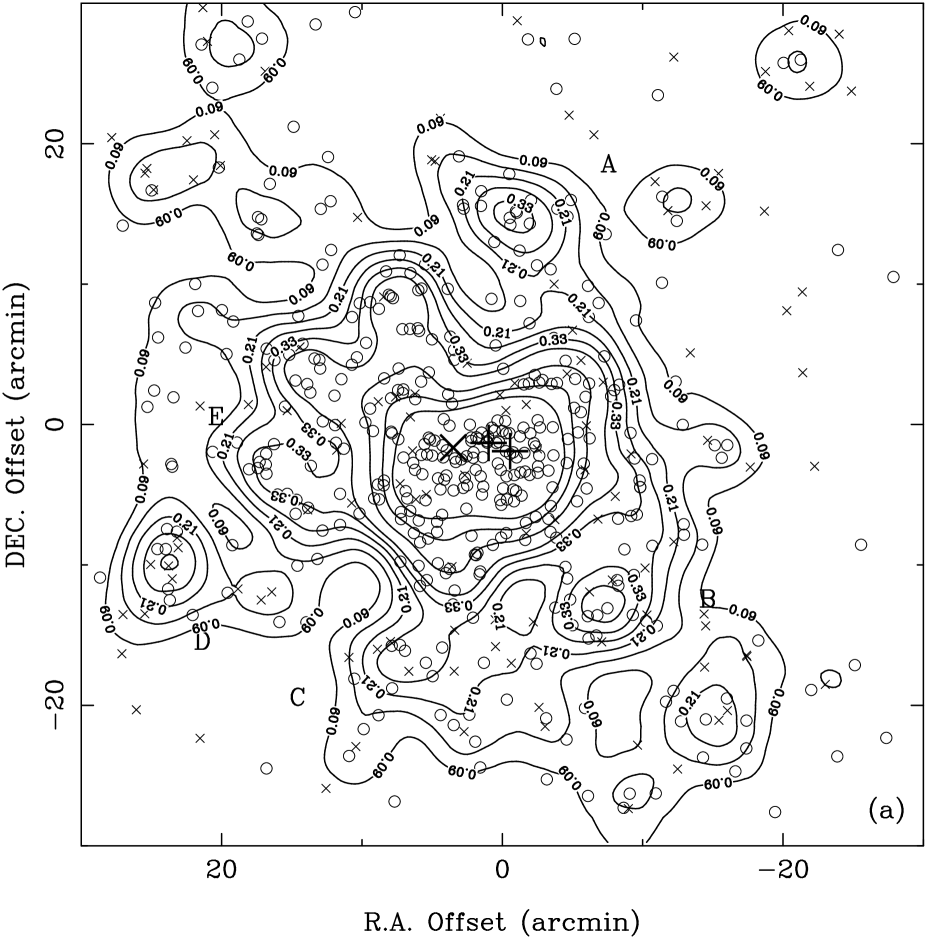
The vast majority of 313 newly-selected member galaxies are fainter than 17.6, and the early-type faint galaxies dominate in the central 10-arcmin region. Compared with the sample of 214 known cluster galaxies, these faint galaxies have a higher fraction of late-type galaxies (30%), and most of late-type galaxies are scattered around the main concentration. The spatial distribution of the enlarged sample of 527 cluster galaxies is shown Fig. 11a. In general the contour map of this rich cluster appears to be elongated along southwest and northwest directions. The cluster centroid seems to agree well with that shown in Fig.5a.
Fig. 11: (a) Spatial distribution of 517 galaxies; (b) Bubble plot
To observe the substructures in the velocity distribution, we applied the -test on the enlarged sample of cluster galaxies. The -test results for simulations are given in Table 5. For the cases with neighbor size of , the substructures are still significant with the probabilities 10%. The degree of difference between the local velocity distribution for groups of six nearest neighbors and the overall velocity distribution is shown by the bubble plot in Fig. 11b. Compared with Fig. 5b, substructure A becomes less conspicuous, and substructures B and C remain with similar significance. Additionally, no clustering of large bubbles are found at the positions of clumps D and E in Fig. 11b, indicating that clumps D and E may not be real substructures in velocity distribution.
Within the areas of clumps A, B and C, defined by the contour curve at 0.15 arcmin-2 in Fig. 5a, there are 10, 17 and 8 galaxies, respectively. Table 6 shows the statistics of line-of-sight velocity distributions for these galaxies. Because of the small number of galaxies in the substructures, we used the ROSTAT software to compute the biweight locations and scales. It is interesting to find that subclusters A and C locate at the opposite sides of the central concentration, and they are likely to have reverse distribution of peculiar velocities, respective to the systemic redshift of 0.0806. If we regard the biweight location of the velocity distribution of 214 known member galaxies () as systemic receding velocity, subcluster A tends to move toward us at more than 99% confidence level, and subcluster C tends to depart from us at nearly 2 significance. Additionally substructure B has a slight tendency similar to substructure C. This might be a direct evidence for an unrelaxed system, and supports a recent merge event. We applied the same statistics to the spectroscopically confirmed galaxies in these three substructures, and similar dynamical picture was achieved. This should be the first report of the direct dynamical evidence in optical band for an on-going merger in Abell 2255.
Table 5: Result of -Test for 527 Cluster Galaxies
| 5 | 6 | 7 | 8 | 9 | 12 | 15 | 20 | |
|---|---|---|---|---|---|---|---|---|
| 0.026 | 0.017 | 0.057 | 0.097 | 0.133 | 0.174 | 0.184 | 0.223 |
Table 6: Properties of Substructures A, B, and C
| Statistic | Substructure A | Substructure B | Substructure C |
|---|---|---|---|
| Size (known+new) | 6+4 | 10+7 | 7+1 |
| Galaxy No. in Table 2 | 116,123,126,133, | 118,129,130,137,140, | 138,154,166,169 |
| 134,148 | 142,152,153,162,167 | 172,173,178 | |
| Galaxy No. in Table 4 | 266,268,269,271 | 41,42,44,61,62,63,72 | 27 |
| Mean Velocity (km s-1) | 23190 528 | 24408 448 | 24711 415 |
| Standard Deviation (km s-1) | 1668 | 1848 | 1173 |
| Biweight Location (km s-1) | 23109 257 | 24400 482 | 24893 459 |
| Biweight Scale (km s-1) | 748 599 | 1908 220 | 1144 542 |
6.2 Color Properties and Luminosity Function
The C-M relations for the enlarged sample are shown in Fig. 12, spanning a wider range of the magnitude from 15.0 to 20.5. The SDSS spectroscopic target selection of the main galaxy sample is complete to (Strauss et al. 2002), which has been well shown in Fig. 12. The linear relationship defined by the bright known early-type galaxies can well be extended to the faint early-type galaxies. This correlation can be understood by the fact that the reddening of galaxies is mainly caused by the rich metal absorption in stellar spectra shortward of 4250 Å, and it tends to be more significant for bright early-type galaxies. Such a correlation was also found for the early-type galaxies in Virgo and Coma clusters, and elliptical galaxies seem to have a tighter correlation than the lenticular galaxies do (Bower et al. 1992). Furthermore, the late-type galaxies have a larger dispersion of color indices than the early-types (Yuan, et al.2001).
Fig. 12: The C-M relations for all cluster galaxies
The luminosity function (LF) in a cluster is a powerful and fundamental means to study galaxy formation and evolution in a dense environment. Recent studies showed that the LF for cluster galaxies differ from one cluster to another, and even from one region to another region in one cluster (Biviano et al. 1995; Durret et al. 2002). Our photometry for all member galaxies in Abell 2255 provide a good sample for studying the LF for the bright galaxies in a rich cluster. Some previous studies on nearby rich clusters show that there may be at least two components in the galaxy LF, a Gaussian distribution for the bright galaxies and another component for fainter cluster galaxies formulated by the Schechter function or a power law (Durret et al. 1999). For comparison with other investigations, we have chosen to plot the LF in traditional - and -band magnitudes which can be calculated by and (Zhou, et al. 2003). Fig. 13 shows the distribution of and magnitudes for all galaxies in Abell 2255. The LFs are significantly asymmetric, with a peak at and respectively. The vast majority of bright member galaxies ( or ) has been confirmed by the SDSS spectroscopies. It is clear that these previously known data-set may not strongly constrain the LF shape because the peak of LF can not be well determined.
The application of the photometric redshift technique to 254 known galaxies shows that the selection criterion excludes nearly 10% of the true members, and leads to about 5% contamination by background galaxies. The success rate for membership selection based on our SED-fitting procedures should be still over 80% for the bright galaxies. Though the uncertainty in membership selection might be larger for faint galaxies, the LF peak shown in Fig. 13 should be real because the BATC photometry are complete for the galaxies brighter than 19.0 mag in all filter bands (see Table 1). The magnitude distribution for the cluster galaxies brighter than 19.0 mag can be expected to put a strong constraint on the true LF shape. Therefore we used the minimum method to fit the bright part of the differential LF with (i) a Schechter function: , and (ii) a Gaussian function: . The best fit parameters are also shown in Fig. 13.
The accuracy of estimate is comparatively high for the brighter galaxies that have smaller magnitude errors, so the bright member galaxies have higher possibility to be selected. The bright part of the LF can be fitted well with a single Gaussian defined by a central absolute magnitude of and a dispersion of , which is consistent with the Gaussian component for Coma LF, and (Lobo, et al. 1997). A better fit to the faint part of the LF can be obtained using a single Schechter function with and , though there exists an excess in the bright end of LFs. The LF curve for the cluster galaxies fainter than 19.0 mag has a significant excess above the Gaussian fitting, and another component of a Schechter function seems to be need to give a better fit to the faint part. However, our sample for dwarf cluster galaxies is far from complete because a large number of faint galaxies can not be detected by the BATC multicolor system. The lack of BATC SED information prevents an accurate membership selection for dwarf galaxies in Abell 2255.
Fig. 13: Distributions of and magnitudes
7 SUMMARY
This paper presents our multicolor optical photometry for the nearby rich cluster of galaxies Abell 2255, using the 60/90 cm Schmidt Telescope of the BAO equipped with 13 BATC filters that cover almost whole optical wavelength domain. A method of SED combination for the SDSS and BATC photometries has been explored. After an aperture correction of the SDSS model magnitudes and a flux calibration of the BATC magnitudes, the SEDs obtained by these two photometric systems were carefully combined. A sample of 254 galaxies with known spectroscopic redshifts in the region of Abell 2255 was then formed for verifying the reliability of the combined SEDs. We applied the technique of photometric redshift upon this sample, and more than 90% of the member galaxies are found to have photometric redshifts between 0.068 and 0.090, which provides a reliable tool for further membership selection. This results showed that the combined SEDs with higher resolution could lead to a more accurate estimate of photometric redshift. We selected 214 known member galaxies from our SED lists, for which the detailed analyses on their spatial and color properties are performed. We found that the core region of Abell 2255 is populated by early-type galaxies, and the late-type galaxies are scattered. 137 known early-type galaxies are found to have a tight color-magnitude correlation.
The cross-identification of the SDSS-listed extended sources with our SED list yields a large sample which contains 2522 faint galaxies without redshift information. Based on the knowledge of SED features for known cluster galaxies, we performed our SED-fitting procedures for estimating the photometric redshifts for these faint galaxies. The color-magnitude correlation was also used to constrain our membership selection. As a result, we isolated 313 galaxies as the faint members. The C-M relation for this enlarged sample of cluster galaxies shows that the tight correlation defined by bright galaxies can be extended to the faint early-type galaxies, and the late-type galaxies have a larger dispersion of color index. Our sample of 527 cluster galaxies is nearly complete up to , one magnitude fainter than the LF maximum, which could put a strong constraint on the LF shape. Subclusters A and C located on opposite sides of the cluster center are found to have reverse tendencies in their peculiar velocities, which obviously supports the picture of cluster/group merger in this cluster, as proposed by the radio and X-ray observations.
It should be noted that the combined SED measures through a fixed aperture offers a higher spectral resolution for all the objects detected in the BATC and SDSS surveys, which will surely benefit each other. Our candidate list of faint member galaxies provides the targets for follow-up SDSS spectroscopic observations. For a further investigation on dynamics and luminosity function of galaxies in such a rich cluster possessing an on-going cluster/group merger, the deep spectroscopic observations for the sake of obtaining the accurate redshifts for the faint member galaxies is necessary.
References
- (1) Abell, G. O. 1958, ApJS, 3, 211
- (2) Ashman, K. M., Bird, C. M., & Zepf, S. E. 1994, AJ, 108,2348
- (3) Bautz, L., & Morgan, W. 1970, ApJ, 162, L149
- (4) Beers, T. C., Flynn, K., & Gebhardt, K. 1990, AJ, 100, 32
- (5) Bird, C. M. 1994, AJ, 107, 1637
- (6) Biviano, A., Durret, F., Gerbal, D. et al. 1995, A&A, 297, 610
- (7) Bolzonella, M., Miralles, J. -M., & Pelló, R. 2000, A&A, 363, 476
- (8) Bower, R. G., Lucey, J. R., & Ellis, R. S. 1992, MNRAS, 254, 589
- (9) Burns, J. O., Roettiger, K., Pinkney, J., et al. 1995, ApJ, 446, 585
- (10) Calzetti, D., Armus, L., Bohlin, R. C., et al. 2000, ApJ, 533, 682
- (11) Capaccioli, M., Held, E. V., Lorenz, H., & Vietri, M. 1990, AJ, 99, 1813
- (12) Colless, M., & Dunn, A. M. 1996, ApJ, 458, 435
- (13) Davis, S. D., & White, R. E. 1998, ApJ, 492, 57
- (14) de Vaucouleurs, G. 1948, Annales d’Astrophysique, 11, 247
- (15) de Vaucouleurs, G., & Capaccioli, M. 1979, ApJS, 40, 699
- (16) Dressler, A., & Shectman, S. 1988, AJ, 95, 985
- (17) Durret, F., Gerbal D., Lobo C., & Pichon C. 1999, A&A, 343, 760
- (18) Durret, F., Adami, C., & Lobo, C. 2002, A&A, 393, 439
- (19) Fan, X., Burstein, D., Chen, J., et al. 1996, AJ, 112,628
- (20) Feretti, L., Böhringer, H., Giovannini, G., and Neumann, D. 1997, A&A, 317, 432
- (21) Ferguson, H., Dickinson, M., Williams, R. E. 2000, ARA&A, 38, 667
- (22) Fukugita, M., Ichikawa, T., Gunn, J. E., Doi, M., Shimasaku, K., & Schneider, D. P. 1996, AJ, 111,1748
- (23) Lobo, C., Biviano, A., & Durret, F., et al. 1997, A&A, 317, 385
- (24) Lupton, R. H., Gunn, J. E., Ivezić, Z., et al. 2001, in ASP Conf. Ser. 238, Astronomical Data Analysis Software and Systems X, ed. F. R. Harnden, Jr., F. A. Primini, & H. E. Payne (San Francisco: ASP), 269
- (25) Stauffer, J., Spinrad, H., & Sargent, W. L. W. 1979, ApJ, 228, 379
- (26) Strauss, M. A. et al. 2002, AJ, 124, 1810
- (27) Stoughton, C., Lupton, R. H., Bernardi, M., et al. 2002, AJ, 123, 485
- (28) Struble, M. F., & Rood, H. J. 1982, AJ, 87, 7
- (29) Struble, M. F., & Rood, H. J. 1999, ApJS, 125, 35
- (30) Tribble, P. C. 1993, MNRAS, 263, 31
- (31) Williams, R. E., Blacker, B., Dickinson, M., et al. 1996, AJ, 112, 1335
- (32) Xia, L., Zhou, X., Ma, J., et al. 2002, PASP, 114, 1349
- (33) Yan, H., Burstein, D., Fan, X. et al. 2000, PASP, 112, 691
- (34) York, D. G., Adelman, J., Anderson, J. E., et al. 2000, AJ, 120, 1579
- (35) Yuan, Q., Zhou, X., Chen, J., et al. 2001, AJ, 122, 1718
- (36) Zabludoff, A. I., Huchra, J. P., Geller, M. J., 1990, ApJS, 74, 1
- (37) Zehavi, I., Blanton, M. R., Frieman, J. A., et al. 2002, ApJ, 571, 172
- (38) Zhou, X., Chen, J., Xu, W., et al. 1999, PASP, 111, 909
- (39) Zhou, X., et al. 2001, ChJAA, 1, 372
- (40) Zhou, X., Jiang Z., Ma, J., et al. 2003, A&A(accepted) (astro-ph/0209459)


![[Uncaptioned image]](/html/astro-ph/0306352/assets/x17.png)
![[Uncaptioned image]](/html/astro-ph/0306352/assets/x18.png)
![[Uncaptioned image]](/html/astro-ph/0306352/assets/x19.png)
![[Uncaptioned image]](/html/astro-ph/0306352/assets/x20.png)
![[Uncaptioned image]](/html/astro-ph/0306352/assets/x21.png)
![[Uncaptioned image]](/html/astro-ph/0306352/assets/x22.png)
![[Uncaptioned image]](/html/astro-ph/0306352/assets/x23.png)
![[Uncaptioned image]](/html/astro-ph/0306352/assets/x24.png)
![[Uncaptioned image]](/html/astro-ph/0306352/assets/x25.png)
![[Uncaptioned image]](/html/astro-ph/0306352/assets/x26.png)
![[Uncaptioned image]](/html/astro-ph/0306352/assets/x27.png)