First results of observations of transient pulsar SAXJ2103.5+4545 with the INTEGRAL observatory.
Abstract
We present preliminary results of observations of X-ray pulsar SAX J2103.5+4545 with INTEGRAL observatory in Dec 2002. Maps of this sky region in energy bands 3-10, 15-40, 40-100 and 100-200 keV are presented. The source is significantly detected up to energies of keV. The hard X-ray flux in the 15-100 energy band is variable, that could be connected with the orbital phase of the binary system. We roughly reconstructed the source spectrum using its comparison to that of Crab nebula. It is shown that the parameters of the source spectrum in 18-150 keV energy range are compatible with that obtained earlier by RXTE observatory
Introduction
The transient X-ray pulsar SAX J2103.5+4545 was discovered by the BeppoSAX observatory during its outburst in 1997 (Hulleman et al.. 1998). The source observations with the RXTE satellite during its next outburst in 1999 have shown that along with s pulsations the source demonstrates significant periodicity caused by a binary orbit. Based on these observations Baykal et al.(2000) showed that the pulsar is a member of a binary system with an eccentric orbit () and orbital period of days.
The source spectrum was described a power law with a photon index of and high energy cutoff (Hulleman et al. 1998, Baykal et al. 2002), that is typical for accreting X-ray pulsars. In addition, at the low energies the spectrum was modified by an absorption with a hydrogen column density of atoms cm-2. In addition, a fluorescent line of neutral iron at keV was detected in the spectrum.
Analysis of the source light curve have shown that its intensity strongly variates over the orbital cycle and reaches the maximum near the periastron (Baykal et al. 2000). Such dependence of intensity on an orbital phase is quite typical for the high-eccentric binary systems with massive companions – stars of early spectral classes . It was assumed that B-type star HD200709 is a possible companion of the pulsar (Hulleman et al. 1998), however, it is still not confirmed.
It is necessary to note that the pulsar have demonstrated high stability of the shape of its spectrum over years of observations (Baykal et al.2002), that gives us a possibility to compare the RXTE results with results obtained by other observatories, in particular INTEGRAL.
According to results of observation of all-sky monitor (ASM) of the RXTE observatory the source remains relatively bright during last years and demonstrates the flaring activity. The off-flare part of its emission is rising during last several months.
This work is dedicated to an investigation of a hard emission from pulsar SAX J2103.5+4545 using the public data of the INTEGRAL observatory.
Observations and Data Analysis
INTEGRAL
The international gamma-ray observatory INTEGRAL was successively launched to its orbit with Russian rocket PROTON from the cosmodrom Baikonur on Oct 17, 2002. It consists of instruments designed for investigation of cosmic sources in a wide energy band 3-10000 keV: 1) the IBIS telescope, consisting of two detectors ISGRI and PICsIT working in the energy band 15-10000 keV, and allowing to localize sources with accuracy down to 30; 2) the spectrometer SPI, working in the energy band 15-8000 keV and designed for an accurate spectroscopy with the energy resolution of (at 1 MeV); 3) the X-ray monitor JEM-X with effective energy range 3-35 keV. All telescopes are using the principle of coding aperture. The fields of view (FOV) of IBIS and JEM-X telescope whose data were used in this work are: for the IBIS – 25∘25∘ full field of view, 9∘9∘ fully coded FOV (FCFOV); for the JEM-X – 4.8∘ in a diameter FCFOV. More detailed descriptions of the observatory, instruments, organizations of observations etc could be found in Winkler (1996, 1999).
In this work we used the public data of the calibration observations of Cyg X-1 sky region, obtained by the INTEGRAL observatory in December of 2002 (23 and 25 revolutions, intervals UT 2002-12-21 09:14:29 – 2002-12-23 20:41:11 and UT 2002-12-28 11:53:17 – 2002-12-29 21:42:10, respectively).
Calibrations of instruments of observatory is still not finished, and right now it is not possible for us to make full analysis of data of all telescopes. Therefore the main attention in our paper would be paid to the data of IBIS telescope which have the largest effective area. We also use the data, obtained by the JEM-X monitor for the image reconstruction of the sky in soft energy band (3-10 keV).
For the data reduction we used standard programs of package IDAS 1.0, distributed by INTEGRAL Science Data Center (ISDC, http://isdc.unige.ch). Version 1.0 of the IDAS package doesn’t allow us to make full spectral and timing analysis of data, therefore for the preliminary spectral analysis of pulsar SAX J2103.5+4545 we used the big set of public calibration observations of Crab nebula obtained in February of 2003 (revolutions 39–45). Taking into account the present uncertainties of the calibrations that lead to strong dependence of the reconstructed source intensity on its distance from the center of the field of view (obtained from Crab nebula analysis), especially in low channels of the ISGRI detector, in our subsequent analysis we used only data of observations when SAX J2103.5+4545 was inside the FCFOV, where the intensity of the source should be relatively stable. Analysis of the Crab nebulae gave us the count rate 150 counts/s and 147 counts/s in 15-40 and 40-100 keV energy bands, respectively.
Reconstruction of the sky regions was made using whole set of data (not only FCFOV data). Thus the total exposures of ISGRI detector were ksec for the image reconstruction and ksec for spectral and timing analysis. Note that due to smaller field of view of the JEM-X monitor its full (not only FCFOV) exposure time was close to the latter value.
RXTE
For the comparison of spectra obtained with INTEGRAL with previous measurements we have analyzed the data of RXTE satellite (Bradt, Rothschild & Swank 1993), that numerously observed the source during period 1997-2002. Besides, in order to obtained the information about the sources behavior at the energy band lower than 15 keV we have used the data of all sky monitor (ASM) of RXTE (http://xte.mit.edu/ASM_lc.html).
Main instruments of RXTE observatory are spectrometers PCA and HEXTE, covering together wide energy band 3-250 keV. Spectrometer PCA consists of 5 independent gas proportional counters. Field of view of the spectrometer is limited by 1∘ collimator. Effective energy band of the PCA is 3-20 keV, effective area sq.cm at eneries 6-7 keV, energy resolution %. Spectrometer HEXTE consists of two clusters of 4 detectors NiI(Tl)/CsI(Na), rocking at 16 sec time scale for background measurements. At the any certain time only one HEXTE cluster is observing the sources, therefore the effective area of the instrument is 700 sq.cm. Bandpass of the instrument is 15-250 keV.
For the spectral extraction we have used the data of 190 observations, performed in 1997-2001. Effective exposure of used observations is 560 ksec. As it was shown the spectral shape of the source is relatively stable (Baykal et al. 2002), therefore for spectral analysis we have averaged data of all observations.
For data reduction of the RXTE observatory we have used standard programs of FTOOLS 5.2 package.
Results
Sky maps
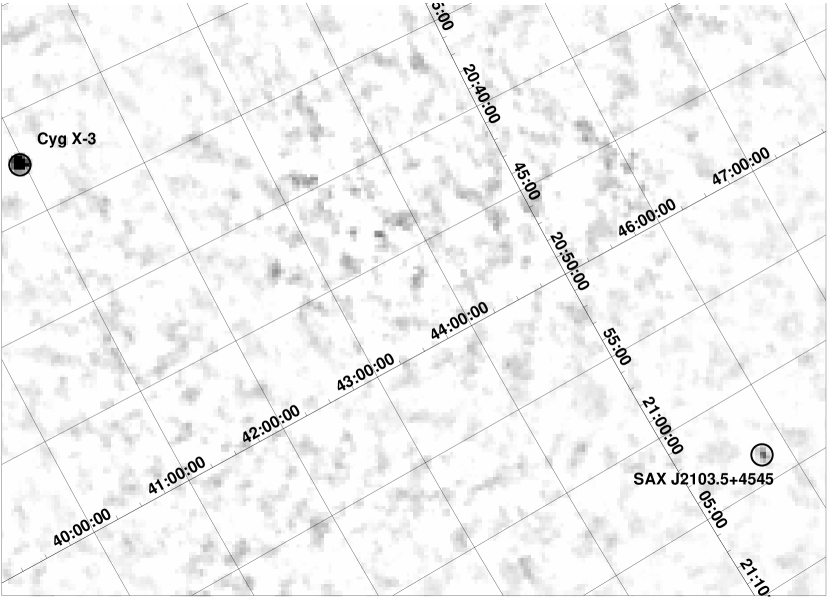
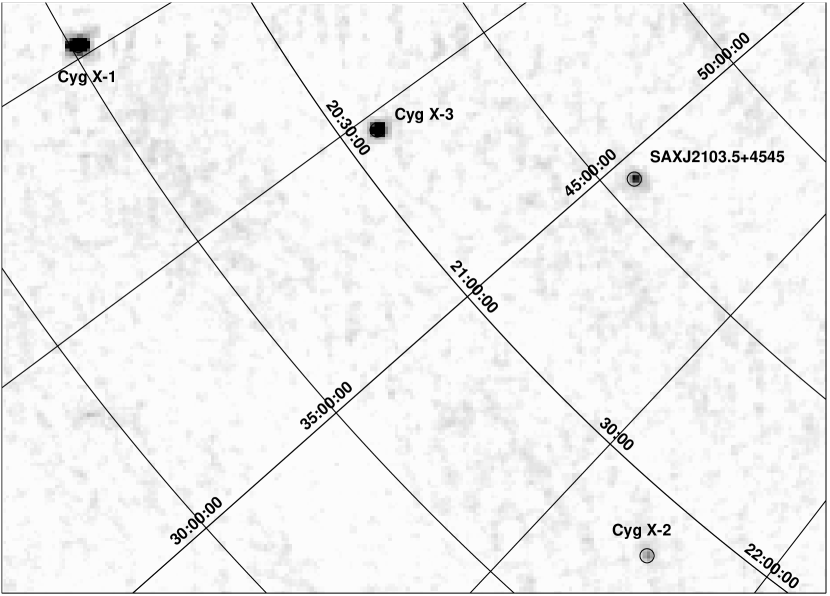
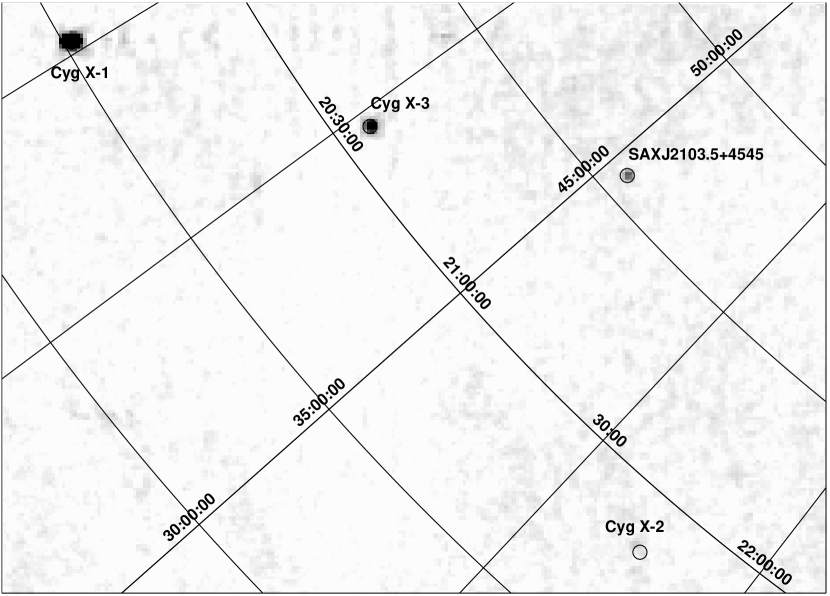
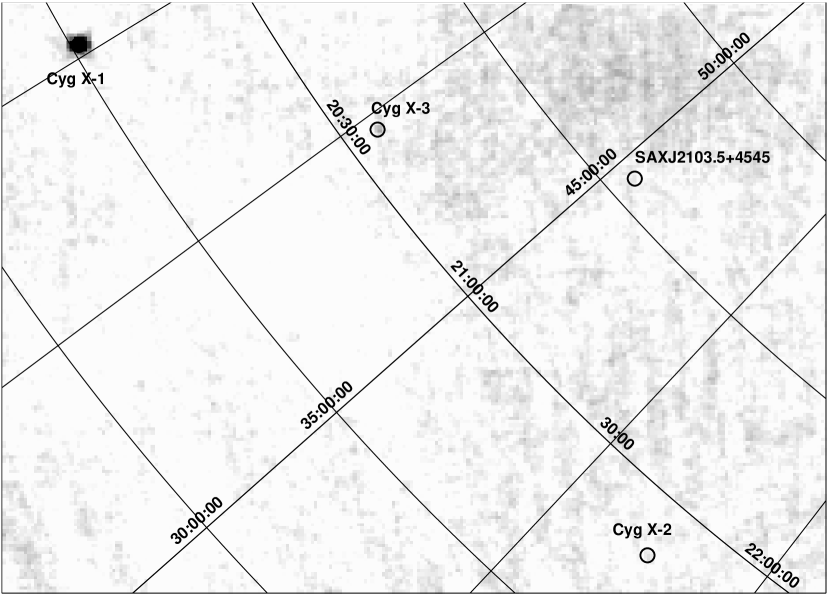
The maps of the sky region around the pulsar SAX J2103.5+4545 obtained by the JEM-X telescope and ISGRI detector of IBIS telescope are shown in Fig.1 in 3-10, 15-40, 40-100 and 100-200 keV energy bands. From these images it is seen that the source is statistically significantly detected up to energies of keV. Along with SAX J2103.5+4545 three known sources were detected in the IBIS field of view – a black-hole candidate Cyg X-1, low-mass X-ray binary Cyg X-2 and binary system Cyg X-3 (last was detected also by JEM-X). Note that Cyg X-1 and Cyg X-3 are still bright and are clearly seen in a hardest energy band 100-200 keV.
Light curves
As it was mentioned in the Introduction the intensity of the pulsar emission depends on its orbital phase and reaches its maximum near the periastron passage (Baykalet al. 2000). The INTEGRAL observations show similar behavior in hard X-ray and gamma-ray energy bands. Light curves of the pulsar obtained by IBIS in 15-40 and 40-100 keV energy bands are shown in Fig.2. For easier comparison of this picture with result obtained by Baykal et al. (2000), orbital phases are also indicated on the Time axis (the orbital parameters were taken from the same work). The flux detected from the system in both energy bands is highest near the orbital phase 0.5 and strongly decreases to the phases of 0.1-0.2. Unfortunately due to absence of data between Dec. 23 and 28, 2002, connected with the INTEGRAL calibration observations of empty fields, we can not build the pulsar light curve during whole orbital cycle.

Spectrum
In order to describe the spectrum of the source we used a ratio of fluxes measured by IBIS/ISGRI detector in different energy bands to the fluxes of Crab nebula measured by the ISGRI detector in the same energy band. The analysis of a set of observations of the Crab have shown that such method of investigation of sources allows us to roughly estimate their spectral shape, but due to imperfection of first instrument calibrations the systematic uncertainties play big role. The observed amplitude of such uncertainties of the measurements of sources fluxes can reach 10-20% in different energy bands. It is important to note that as it was mentioned above we used only data of observations when both SAX J2103.5+4545 and Crab pulsar were in the FCFOV.
Using the known shape of spectrum of the Crab we can calculate the flux from SAX J2103.5+4545 in the units of phot/cm2/s in each energy band. After this we can fit the obtained spectrum by different models. The ratio of the SAX J2103.5+4545 spectrum to the Crab spectrum is shown in Fig.3. Note that the procedure of the spectral reconstruction, described above, is quite complex, imperfect and subject to different uncertainties. Therefore the values obtained during the fitting procedure can not be treated as a correct measurement of the quality of applied models.

For the approximation of the source spectrum we used two simplest models – a power law () and the power law with high energy cutoff (), which is a typical model for approximation of spectra of accreting X-ray pulsars. The latter model was successively used for the describing the source spectrum in a wide energy range obtained during its outbursts in 1997 and 1999. (Baykal et al. 2002)
| Power law () | |
|---|---|
| Photon index, | |
| Flux, 18-150 keV, erg/cm2/s | |
| (d.o.f) | 12.2(6) |
| Photon index, | 1.3a |
| , keV | 7.8a |
| , keV | |
| Flux, 18-150 keV, erg/cm2/s | |
| (d.o.f) | 5.2(6) |
-
a – Because of absence of spectral information in the energy band lower than 18 keV the parameters, related to this energy band, were fixed at values obtained by Baykal et al. 2002.
Best-fit parameters of approximations of the source spectrum are presented in the Table 1. It is necessary to note that in the spectral approximations we included the 15% systematic uncertainties to the fluxes measured in all energy bands. Due to absence of information about source spectrum in the energy band lower that 18 keV we fixed several parameters at the values obtained by the RXTE observatory during the source bright state (Baykal et al.2002). The SAX J2103.5+4545 spectrum, obtained by the ISGRI detector of the IBIS telescope is shown in Fig.4. Simultaneous measurements of the source flux by RXTE/ASM in 1.3-3, 3–5, and 5-12 keV energy bands are also presented.
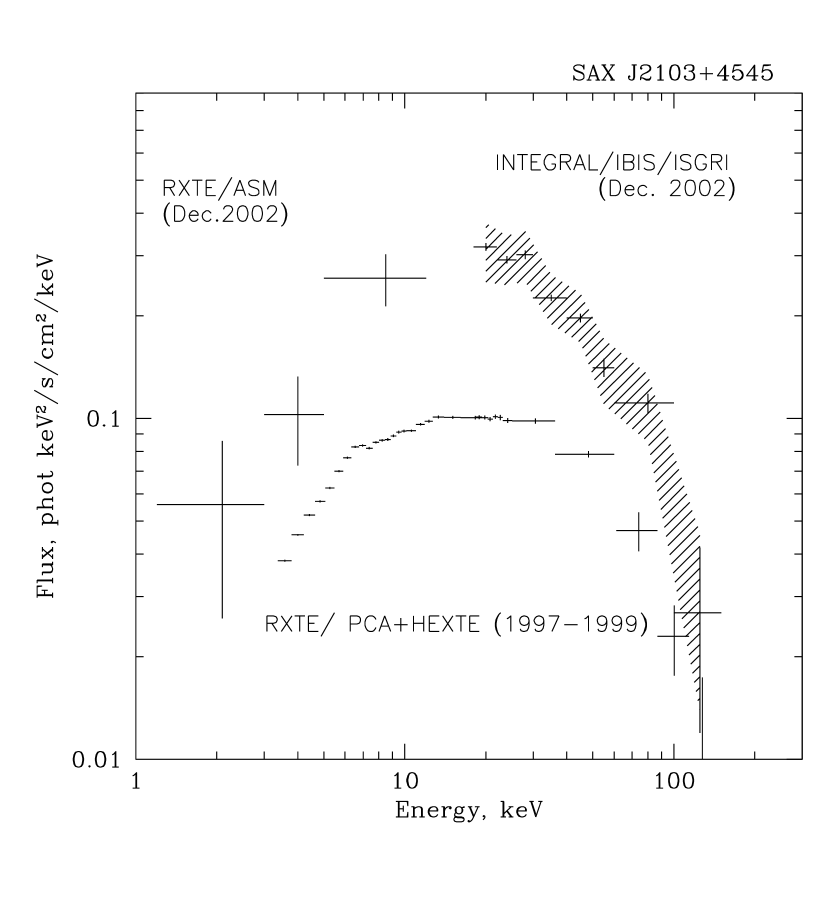
In order to compare the results of INTEGRAL observations with results of archived observations of SAX J2103.5+4545 in Fig. 4 we also present the typical spectrum of the source in its bright state. For this spectrum we used combined data of RXTE/PCA and RXTE/HEXTE spectrometers. It is seen that the spectrum of SAX J2103.5+4545 obtained with IBIS telescope is quite compatible with that obtained by RXTE observatory.
Conclusion
The transient X-ray pulsar SAX J2103.5+4545 was observed by the INTEGRAL observatory during calibration observations of the Cyg X-1 field on December 2002. Analysis showed that the source is detected by IBIS telescope up to energies keV. The shape of the source spectrum agrees with results of RXTE observatory. The spectrum of the pulsar in the energy range 18-150 keV can be described either by the simple power law with photon index of or by the model of power law with high energy cutoff. The parameter keV of this model is in a good agreement with results of RXTE observations - keV (Baykal et al. 2002).
We reconstructed the source light curves and showed that the source flux in the 15-100 keV energy band is variable that presumably could be caused by a binary orbital variations. The maximum of detected hard X-ray flux (18-100 keV) occurs nearly at periastron passage, that is in agreement with RXTE/ASM results.
The increase of the the number of the source observations by inclusion of data of INTEGRAL Galactic Plane Scans would allow us to cover the whole orbital cycle, to increase our sensitivity at the energy band 100-200 keV and to search for the cyclotron feature in the source spectrum, predicted at keV by Baykal et al. (2002)
Research has made use of data obtained through the INTEGRAL Science Data Center (ISDC), Versoix, Switzerland, and High Energy Astrophysics Science Archive Research Center Online Service, provided by the NASA/Goddard Space Flight Center. Authors are thankful to the group of INTEGRAL Science Data Center for their hospitality and computing resources.
This work was partially supported by grant of the RFBR 03-02-06772 and program of Russian Academy of Sciences “Time-varying phenomena in astronomy”.
References
Baykal A., Stark M., Swank J., Astrophys. J. 544, L129 (2000)
Baykal A., Stark M., Swank J., Astrophys. J. 569, 903 (2002)
Bradt, Rothschild, Swank, Astron. Astrophys. Suppl. Ser. 97, 355 (1993)
Winkler C., Astron. Astrophys. Suppl. 120, 637 (1996)
Winkler C., Astrophys. Lett. & Comm. 39, 309 (1999)
Hulleman F., in’t Zand J., Heise J., Astron. Astrophys. 337, L25 (1998)