X-ray emission from GPS/CSS sources
Abstract
The high spatial resolution of the Chandra X-ray Observatory allows us to study the environment of GPS/CSS sources to within an arcsec of the strong compact core. We present the discovery of X-ray jets in two GPS quasars, PKS1127-145 and B2 0738+393, indicating that X-ray emission associated with the relativistic plasma is present at large distances from the GPS nucleus. We also discuss first results from Chandra observations of our GPS/CSS sample. We find that 6 out of 10 sources show intrinsic absorption at a level which may be sufficient to confine the GPS source.
1 Harvard-Smithsonian Center for Astrophysics, 60 Garden St., Cambridge, MA 02138, USA, asiemiginowska@cfa.harvard.edu 2 Steward Observatory, University of Arizona, USA, 3 CNR, Bologna, Italy, 4 CNR, Noto, Italy.
Keywords: galaxies: active — X-rays: galaxies
1 Introduction
Giga-Hertz Peaked (GPS) and Compact Steep Spectrum (CSS) sources are major classes of radio sources that may be offering glimpses of the early stages of radio source formation. They could well offer insight into the physical processes triggering activity in galactic nuclei and so into the causes of quasar evolution. Although these sources are now receiving considerable attention in the radio band, they remain neglected at other wavelengths.
During the last two decades there has been no systematic X-ray study of GPS/CSS sources and only a few X-ray observations have been performed. O’Dea (1998) lists 31 sources with available X-ray information, including 7 sources with upper limits only. This sample shows, as expected, that galaxies are less luminous in X-rays than quasars. Elvis et al (1994) observed X-ray absorption in two out of three high redshift GPS quasars, suggesting that their environment might be different from other quasars. ROSAT upper limits for a few GPS/CSS galaxies of L ergs s-1 are consistent with the X-ray emission expected from poor clusters or early type galaxies. O’Dea et al (2000) presented the first X-ray detection of a GPS galaxy, which had L ergs s-1 with ASCA. The highest spatial resolution observations before Chandra were made with the ROSAT HRI in which 2 out of 4 GPS quasars showed traces of an extended emission (Antonelli & Fiore 1997).
The lack of available X-ray information is surprising, since strong X-ray emission is expected to be associated with strong radio power and could in principle help in understanding the emission processes and dynamics related to radio-emitting structures. Is the X-ray emission directly connected to the expanding jet? X-ray emission associated with a local halo or cluster (T 107K) could help in studying the environment of the GPS/CSS sources. We should be able to look for the remnants of a merger event or any signatures of interactions between an expanding radio plasma and the IGM. X-ray spectra can constrain the total absorbing column, so we may be able to check whether there is sufficient material to confine the GPS source.
X-rays can also help to understand any link between GPS and large scale radio sources and answer questions related to the source evolution: Can we see any evidence for intermittent activity? Do GPS sources grow into large radio galaxies?
The Chandra X-ray Observatory, with its exceptional image quality (PSF FWHM of 0.5 arcsec), has discovered many X-ray jets associated with radio structures in radio galaxies and quasars (see http://hea-www.harvard.edu/XJET/). Chandra is the only X-ray telescope which can resolve structures on 1 arcsec scales, and is well-suited for studying the environment of GPS/CSS sources. Are X-ray jets present in GPS sources? Can Chandra detect extended emission hinted at with ROSAT HRI images for two GPS quasars?
Here, we present Chandra observations of two GPS sources, PKS 1127-145 and B2 0738+313, in which we have discovered X-ray jets. We also present preliminary analysis of our GPS/CSS sample observed during the first half year of the Chandra AO3 cycle. We assume H0=50 km sec-1 Mpc-1 and q0=0.5.
1.1 PKS 1127-145 and B2 0738+313
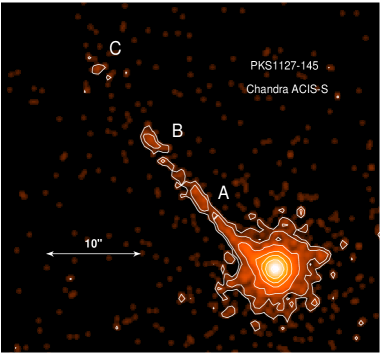
We observed the two GPS quasars with the Chandra ACIS-S detector. PKS 1127-145 is a quasar at z=1.187 with ergs sec-1 and a GPS radio spectrum that peaks at 1GHz. It also has an intervening damped Lyman system (DLA) at (Bechtold et al 2002). The Chandra ACIS-S observation shows a arcsec X-ray jet; at the quasar redshift it is kpc projected on the sky (Fig.1). As described in Siemiginowska et al (2002a), the jet curves and its emission is very faint in comparison to the nucleus. The ratio of individual knots intensities to the core intensity is . The X-ray knots correspond to the VLA knots only roughly, with X-ray peak intensities preceding the radio peak intensities. The X-ray emission is stronger at the core, while the radio emission is stronger away from the core.
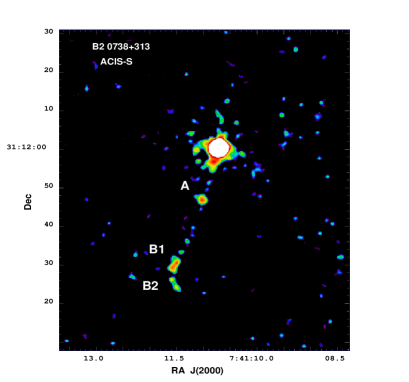
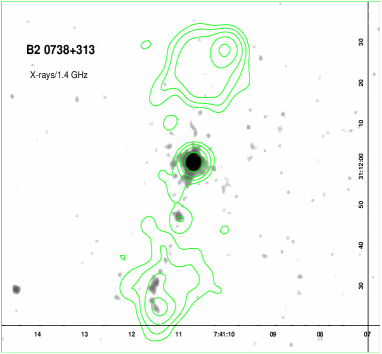
B2 0738+313 is a quasar at z=0.63 and ergs sec-1. It has two DLA systems at z=0.0912 and z=0.2212 (Rao & Turnshek 1998). The GPS radio spectrum peaks at GHz (Stanghellini et al 1998). ROSAT HRI observations show a hint of the extended emission present on 10-20 arcsec scale. With a 27 ksec Chandra ACIS-S observation we detected an X-ray jet extending up to 35 arcsec away from the nucleus, with a few enhancements in the form of hot spots and knots (Fig.1). The hot spot emission is faint compared to the core, with intensity ratio of . VLA radio maps show faint extended radio emission in the form of lobes to the north and south. The X-ray jet follows the radio emission to the south (Fig.2). The X-ray jet emission is getting fainter moving away from the core, while the radio emission has two hot spots at the end of the southern lobe. There is NO X-ray emission corresponding to the northern radio lobe with 3 upper limit of 2 photons cm-2 sec-1 pix-1 (1 pix=0.164”).
1.2 Jet emission models
Comparison of X-ray, optical and radio data rules out thermal emission, synchrotron-self-compton (SSC) and simple direct synchrotron emission (see Harris & Krawczynski 2002 for review) as the origin of the X-ray jet emission in PKS 1127-145. Inverse Compton scattering off CMB photons (EIC/CMB) with moderate jet bulk velocities () can readily accommodate the observations because the EIC/CMB process is especially effective at high redshift due to the scaling of the CMB. We note that X-rays from EIC can trace the low energy () population of particles which are not detectable in the radio band and thus delineate the “fossil” structure.
The X-ray emission in the two knots (B1,B2) of B2 0738+313 jet can be explained by synchrotron emission. However, knot A needs an additional component, because synchrotron emission requires unusually high acceleration efficiencies. Note that in the synchrotron model the high energy break needs to be at Hz, which seems unlikely. EIC/CMB process requires of 10 (Fig.2) and might be a possible explanation for knot A X-ray emission.

1.3 Summary
-
•
X-ray jets in both sources extend far away from the nucleus, kpc projected distance.
-
•
The X-ray emission is most likely due to the interactions between relativistic jet particles and Cosmic Microwave Background photons.
-
•
The X-ray jet emission indicates the presence of relativistic motion up to hundreds of kpc distance from the nucleus: .
2 The first X-ray GPS/CSS Sample observed with Chandra
The discovery of two X-ray jets associated with GPS quasars raises more questions about the nature of the GPS sources: Are GPS/CSS sources truly compact or do they have extended structures? Are these structures too faint to be easily detected in radio? Can we detect extended emission in X-rays? Are GPS quasars simply extended radio sources whose core is boosted towards us?
In order to address these questions we selected a sample for the first systematic X-ray study of GPS/CSS sources using the following criteria: (1) Radio size arcsec. (2) Redshift . (3) Low Galactic hydrogen column.
We have obtained deep observations of the sources which had pre-existing measurements of their X-ray flux. For sources with no previous X-ray observations we requested short 5 ksec exposures in order to estimate their X-ray count rates and luminosity.

2.1 First Results from Chandra Survey
Thus far we have observed 10 out of 14 sources (Table 1). The sample properties are presented in Fig.3. The details of data analysis carried out with CIAO 2.2 software will be presented elsewhere (Siemiginowska et al in preparation). Here we summarize our main results. All the observed sources have been detected and their (0.1-2keV) fluxes range between: erg cm-2 s-1. We found intrinsic absorption column in the excess of the Galactic column in 6 sources: N10 cm-2.
We can obtain a lower limit on the density of the absorber assuming that it provides the confinement within 10 kpc from the center. This gives a density of 0.03-0.3 cm-3, compared to the average density of 1-10 cm-3 required to permanently confine a jet in numerical simulations of De Young (1993).
| Name | redshift | (NH)a | (N)b | f(0.1-2keV)d | f(2-10keV) | |
|---|---|---|---|---|---|---|
| E20 cm-2 | E21 cm-2 | erg cm-2 s-1 | erg cm-2 s-1 | |||
| 0941-080 | 0.228 | 3.67 | - | 1.5 | 3.1e-15 | 7.1e-15 |
| 0134+329 | 0.367 | 4.54 | 1.96 | 1.82e-12 | 2.2e-12 | |
| B2 0738+31 | 0.63 | 4.18 | 2.1 | 1.56 | 2.98e-13(5.3) | 8.7e-13 |
| S5 0615+820 | 0.71 | 5.27 | 1.61 | 1.22e-13 (1.22) | 2.8e-13 | |
| 1458+718 | 0.905 | 2.33 | 1.2 | 1.44 | 8.02e-13 (10.8) | 2.24e-12 |
| 1328+254 | 1.055 | 1.08 | 2.2 | 1.88 | 2.54e-13 (3.9) | 4.01e-13 |
| 1127-145 | 1.187 | 4.09 | 3.3 | 1.24 | 1.25e-12(2.17) | 5.74e-12 |
| 1245-197 | 1.28 | 4.72 | 1.47 | 2.5e-14 | 6.6e-14 | |
| 1416+067 | 1.439 | 2.5 | 4.5 | 1.82 | 1.45e-12 (2.8) | 2.88e-12 |
| 1143-245 | 1.95 | 5.22 | 9.4 | 1.75 | 1.1e-13 (19.6) | 2.3e-13 |
a NH - equivalent Galactic Hydrogen column density b N - equivalent Hydrogen column density of the absorber at the redshift of the source. c - X-ray photon index d unabsorbed flux is shown in brackets. Absorbed power law model : photons cm-2 sec-1 keV-1, where is the normalization at 1 keV. and are the absorption cross sections (Morrison & McCammon 1983, Wilms, Allen and McCray 2000).
3 Summary
We have discovered X-ray jets in two GPS quasars. The jets travel up to hundreds kpc from the active nucleus. Our observations are compatible with the intermittent activity model, in which old electrons () from previous activity are detectable in X-rays, via CMB Comptonization (LOFAR may detect directly), while new components expand into the medium formed by the previous active phase. However, 6 out of 10 GPS sources show intrinsic absorption columns: N1021 cm-2 n cm-3 suggesting that the sources could be both confined and intermittent.
Alternatively GPS quasars may simply be extended radio sources whose core is boosted towards us (see Stanghellini this proceedings).
Acknowledgments
This research is funded in part by NASA contracts NAS8-39073. Partial support for this work was provided by the National Aeronautics and Space Administration through Chandra Award Number GO-01164X and GO2-3148A issued by the Chandra X-Ray Observatory Center, which is operated by the Smithsonian Astrophysical Observatory for and on behalf of NASA under contract NAS8-39073.
References
Antonelli, L. A.; Fiore, F., 1997, Memorie della Societa Astronomia Italiana, Vol. 68, p.299
Bechtold, J., Siemiginowska, A., Aldcroft, T.L, Elvis, M., Dobrzycki, A., 2002, ApJ, 562, 133
Elvis, M., Fiore,F., Wilkes, B., McDowell, J., Bechtold, J., 1994, Ap.J. 422, 60
De Young, David S., 1993, ApJ,402, 95
Harris, D. E. & Krawczynski, H. 2002, ApJ, 565, 244
Lane, W., Briggs, F.H. & Smette A., 2000, ApJ, 532,146
Morrison, R. & McCammon, D. 1983, ApJ, 270, 119
O’Dea, C.P. 1998, PASP, 110, 493
O’Dea, C.P.; De Vries, W.H.; Worrall, D. M.; Baum, S.A.; Koekemoer, A, 2000, AJ, 119, 478
Rao, S.M. & Turnshek, D.A. 1998, ApJ, 500, L115
Siemiginowska, A.; Bechtold, J.; Aldcroft, T.L. et al ; 2002a, ApJ, 570, 543
Siemiginowska A., Stanghellini, C. Brunetti G., Fiore F., Aldcroft, T.L, etal 2002b, ApJ submitted;
Stanghellini C., O’Dea C.P., Dallacasa D., Baum S.A., Fanti R., Fanti C. 1998, Astron. Astrophys. Suppl. Ser. 131, 303-315
Wilms, J., Allen, A., & McCray, R. 2000, ApJ, 542, 914