The long time-scale X–ray variability of the radio-quiet quasar PG 0804+761
Abstract
We present the results from a study of the timing properties and the energy spectrum of the radio-quiet quasar PG 0804+761, based on monitoring RXTE/PCA observations that lasted for a year. This is a systematic study of the X–ray variations on time scales of weeks/months of the most luminous radio-quiet quasar studied so far. We detect significant variations in the keV band of an average amplitude of . The excess variance of the light curve is smaller than that of Seyfert galaxies, entirely consistent with the relationship between variability amplitude and luminosity defined from the Seyfert data alone. The power spectrum of the RXTE light curve follows a power-like form of slope . However, when we extend the power spectrum estimation at higher frequencies using archival ASCA data, we find strong evidence for an intrinsic steepening to a slope of at around Hz. This “break frequency” corresponds to a time scale of days. The time-average energy spectrum is well fitted by a power law model. We also find evidence for an iron line at keV (rest frame) with eV, similar to what is observed in Seyfert galaxies. The flux variations are not associated with any spectral variation. This is the only major difference that we find when we compare the variability properties of PG 0804+761 with those of Seyfert galaxies. Our results support the hypothesis that the same X–ray emission and variability mechanism operates in both Seyfert galaxies and quasars.
keywords:
galaxies: active – galaxies: quasars: individual: PG 0804+761 – X-rays: galaxies1 Introduction
X–ray emission is a universal property of active galactic nuclei (AGN). The X–rays are known to be variable in all cases where sufficient signal-to-noise ratio and sampling have been obtained. EXOSAT first showed systematically that the X–ray emission of AGN was variable, with the most convincing demonstration of this being the “long looks” (Lawrence et al. 1987, McHardy & Czerny 1987). The data showed no characteristic time-scales, and the power spectral density function (PSD) showed a “red-noise” spectrum. Lawrence & Papadakis (1993) showed that the AGN PSDs were consistent with a single power law form and an amplitude which decreases with luminosity. Similar results were obtained by Green, McHardy & Lehto (1993). The anticorrelation between variability amplitude and luminosity was later confirmed by ASCA (Nandra et al. 1997).
Further progress in the study of the longer-term X–ray variability has been afforded by RXTE which has shown a flattening of the PSD at lower frequencies (Edelson & Nandra 1999, Pounds et al. 2001, Uttley, McHardy & Papadakis 2002, Markowitz et al. 2003). The results so far suggest that the AGN power spectra are similar (both in shape and fractional rms amplitude) to those of Galactic black–hole X–ray binaries, like Cyg X–1, except that characteristic time-scales are “shifted” to much lower frequencies. This raises the possibility that the PSDs may scale with the black hole mass. If this is the case, then the apparent anticorrelation between variability amplitude and luminosity could be in fact a positive correlation between luminosity and variability time-scale. If the AGN PSD shift to lower frequencies as the luminosity increases, the amplitude on a fixed time-scale would reduce. Therefore, in order to observe large amplitude variations in high-luminosity sources, we should sample longer time-scales. Consequently, quasars, being the high-luminosity counterparts of Seyfert galaxies, should show strong variability on time-scales of months-years.
In order to investigate the X–ray variability properties of high luminosity AGN, we performed RXTE monitoring observations of the X–ray bright, radio-quiet quasar PG 0804+761 in the period between March 2000 - March 2001. The resulting dataset provides a systematic study of the X–ray variations of the most luminous radio-quiet quasar studied so far. The source is one of the brightest radio-quiet quasars which have been observed by ASCA. It has shown significant variations (although of low amplitude) during a day long ASCA observation. The energy spectrum was well fitted by a simple power law model with a slope of , while no significant Fe K-shell emission was detected (George et al. 2000).
In this work we study the long term X–ray variability of PG 0804+761 in terms of simple statistics like the rms excess variance, and by measuring its 2–10 keV PSD. We compare our results with those from similar studies of Seyfert galaxies, and with the variability results from the ASCA observation of the source. We also study the energy spectrum of the source, and investigate any spectral variations and their relationship to the flux.
2 Observations and data reduction
RXTE observed PG 0804+761 with the Proportional Counter Array (PCA) every days between March 07, 2000 and March 03, 2001. Individual observations lasted typically ksec in all cases. The total number of observations is 126 and the overall exposure time is 157 ksec. We used FTOOLS v5.2 for the reduction of the PCA data. Data were collected from the proportional counter unit 2 (PCU2) which was switched on during almost all of the observations. PCU0 was also switched on in most cases, however, due to the loss of the propane layer in May 2000 we do not include data from this unit in our analysis. Spectra and light curves were extracted from the top Xenon layer data. We consider only STANDARD-2 data, using “good time intervals” determined according to the following criteria: target elevation , pointing offset , and ELECTRON2 . We calculated background data using the tool PCABACKEST v3.0 and the new “CM” models to generate background model files.
Light curves binned to 16 sec were generated for the source over the , , and keV bands, where the PCA is most sensitive and the background models are best quantified. The light curves were then re-binned using a 3 day bin size, resulting in evenly spaced light curves. The difference between the mid-point of each bin and the actual observation time of the corresponding points is very small in all cases (typically only a few percent of the 3 day separation between successive points in the light curve) and will have negligible impact on our results. There are a few “missing points” in the resulting light curves which correspond to those observations when PCU2 was not switched on. The final number of points in each light curve is 121, with 6 missing points (less than of the total number of points). We accounted for them using linear interpolation, adding the appropriate random noise to each point.
All the observations were done during a period when no major gain change was applied to PCA. However, we extracted light curves individually for the data prior and after May 13, 2000 (the date of the propane layer loss of PCU0). We used the appropriate channel boundaries in order to extract the same energy band light curves for both data sets, following the relevant information in the “channel-to-energy” table at the RXTE web pages.
3 The keV flux variability
3.1 Basic variability properties

Fig. 1 shows the keV light curve of the source. Significant variations can be observed on all sampled time-scales. During most of the monitoring period the source flux varies around the counts/sec level, typically with an amplitude of . During the last months of the observation the count rate gradually decreased. First, following Nandra et al. (1997), we parametrized the observed variability by the “excess variance” normalized to the mean count rate square (). This quantity is a measure of the integrated normalised PSD of the source over frequencies between the lowest and highest sampled frequencies (in our case days)Hz, and days) Hz, respectively). We find , which implies that the average variability amplitude of the source is of the average count rate.
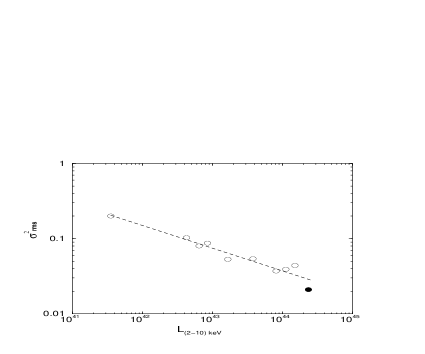
As a first comparison between the variability properties of PG 0804+761 and Seyfert 1 galaxies, in Fig. 2 we show plotted against the keV luminosity for PG 0804+761 and the nine Seyfert galaxies studied by Markowitz & Edelson (2001). The normalized excess variance for these galaxies was estimated from RXTE keV light curves which had a duration of 300 days. Consequently, they can be compared directly with the PG 0804+761 value estimated in this work. The X–ray luminosities () of the Seyfert galaxies were taken from Markowitz & Edelson (2001), while the keV luminosity of PG 0804+761 is estimated as explained in Section 4.
Fig. 2 shows that the PG 0804+761 measurement agrees very well with the correlation between and as determined by the Seyfert data alone. Thus while the variability of PG 0804+761 exhibited in Fig. 1 is dramatic, the amplitude of variations is smaller than that of Seyferts, and fits in precesly with our expectations. When we fit all the data shown in this figure with a power law-model of the form , the best fitting slope value is . This is consistent with the best fitting slope found by Markowitz & Edelson (2001), using only the Seyfert 1 data.

3.2 The keV PSD
As a next step in our study of the X–ray variability of PG 0804+761, we computed the PSD using the interpolated, 3-day binned, keV light curve. First, we computed the periodogram (normalized to the mean count rate square) as in Papadakis & Lawrence (1993). Then, we calculated the logarithm of the priodogram estimates, grouped them into bins (with either 10 or 20 points per bin - see below), and computed their average value in each bin. The filled circles in Fig. 3 show the RXTE keV PSD of PG 0804+761 (when using a bin size of 10) calculated by this method. There are no obvious features or periodicities, though admittedly the frequency resolution of the PSD is poor. We have parametrized the spectrum using a power-law model of the form, . The Poisson noise level is very low. This is immediately obvious from an inspection of the errorbars in Fig. 1, which are very small when compared to the amplitude of the observed variations. Indeed the best fitting power law index is consistent whether or not Poisson noise is accounted for in the fir. The best fitting power law index for the fit without Poisson noise is , (errors represent the 68% confidence regions for the model parameters and were computed using the prescription of Lampton, Margon & Bowyer, 1976). The best fitting power-law model is shown in Fig. 3 as the thick solid line. Its slope is much flatter than the typical value inferred by Lawrence & Papadakis (1993) from the analysis of EXOSAT data of a Seyfert 1 galaxies, or of single power law fits to RXTE PSDs od Seyferts (Uttley et al. 2002; Markowitz et al. 2003).
Note that the model fitting was performed using the PSD shown in Fig. 3, i.e. the 10-binned logarithmic periodogram estimates. Although a bin size of at least 20 is needed for the final PSD estimates to have the necessary properties for a model fitting (Papadakis & Lawrence, 1993), the small bin size choice was motivated by the need to increase the frequency resolution of the spectrum, which is required to estimate reasonable errors for the best-fitting parameter values. We caution that this may introduce some systematic error, but note that power-law model fit to the 20-binned logarithmic periodogram estimates yields similar best-fitting parameter values, but with a larger uncertainties.
In order to investigate the high frequency PSD and compare it with the long term PSD, we obtained ASCA data for PG 0804+761 from the TARTARUS database. PG 0804+761 was observed with ASCA for ksec on November 11, 1997. In order to maximise the signal-to-noise ratio of the ASCA data, we used the full energy band (i.e. keV) GIS and SIS light curves. This is different to the RXTE data, but we justify our choice by the fact that in the hard and soft X-ray emission is strongly correlated, both in general and specifically in this case. We discuss the impact of this choice of energy band on our conclusions later. Because of the earth occultation gaps, the estimation of the PSD for the ASCA light curves is complicated. First, we used 16 sec binned light curves to compute the high frequency PSD. There are 19 and 13 parts in the GIS and SIS light curves, respectively, with duration between ksec and no gaps in them. For each part we computed the periodogram. Then we combined all 32 periodograms into one file, sorted the periodogram estimates in order of increasing frequency, calculated their logarithm, grouped them into bins of 50, and computed their average value at each bin. We caution that in this way we introduce a systematic bias in the estimation of the source power spectrum, as many parts of the GIS and SIS light curves overlap in time. As a result, the source variability will be identical between these parts, and in principle, the respective periodograms should not be combined. However, this effect has minimal impact on our results, as the high frequency PSD, calculated by this method, shows no evidence of the intrinsic source power spectrum. The PSD, shown in Fig. 3, is flat and consistent with the expected with the Poisson noise power level (shown with the thin solid line in the same figure). This result shows that the high frequency variations are entirely dominated by the Poisson noise process.
To estimate an “intermediate-frequency” PSD we used 5760 sec binned GIS and SIS light curves. The use of the approximate ASCA orbital period as the bin size results in an evenly sampled light curves with 16 points in each one of them. We computed the periodogram of both light curves, combined them into one file, sorted the periodogram estimates in order of increasing frequency, subtracted the expected Poisson noise level and grouped them into one bin of size 16. In Fig. 3, with the open circle point, we show the resulting PSD estimate. In a way, this point should be considered as the average normalized source power level over the sampled frequency range of Hz. As mentioned in the previous paragraph, the use of light curves overlaping in time (like the GIS and SIS light curves in our case) can introduce a systematic bias in the estimation of the source PSD. For that reason, we re-computed the Hz source power level using the SIS light curve alone. The result is very similar to what we obtain when we use both the SIS and GIS light curves, so any bias has a very small effect on our result.
Note that in Fig. 3 the high frequency PSD includes the Poisson noise process contribution; it is not possible to measure the intrinsic PSD at these frequencies, as its amplitude is much smaller than the amplitude of the Poisson power level. On the other hand, the “intermediate-frequency” power level corresponds to the source power only (i.e. with the experimental noise contribution subtracted).
Fig. 3 shows clearly that the RXTE PSD is not consistent with the higher frequency PSDs, estimated from the ASCA data. The low frequency PSD normalization is much larger that what would be expected from a simple extrapolation of the ASCA PSD to lower frequencies. The discrepancy becomes clearer if we extrapolate the RXTE PSD best-fitting power-law model to higher frequencies (dashed line in Fig. 3). If the RXTE PSD is representative of the “true”/intrinsic source power spectrum, and this spectrum extends all the way up to Hz, then we should observe significant variations in the ASCA light curves even on time-scales as short as sec.
3.3 Systematic uncertainties
The main source of systematic uncertainties in the estimation of the RXTE PSD is the possibility of residual background variations that may have not been taken into account by the background models and are present in the keV light curve. However, simultaneous RXTE and XMM-Newton observations of a few Seyfert galaxies during the period covered by our observations show an excelent aggrement between the RXTE PCU2 and the XMM-Newton count rate (e.g. see Mason et al. 2002, in the case of NGC 4051). Furthermore, the difference between the nornmalization of the RXTE and ASCA PSDs is larger than orders of magnitude. If we were to decrease the low-frequency PSD normalisation by that large amount, the resulting measurement would be entirely inconsistent with the relation between and , as determined by the Seyfert 1 data (see Fig. 2). Finally, the PCA team estimation of the “unmodelled variance in (the observed background light curve) residuals after subtracting the known (background) model components” is (cnts/sec)2, for PCU2, epoch 4 and 5 (see the discussion in C. Markwardt’s documentation web page: lheawww.gsfc.nasa.gov/users/craigm/pca-bkg/bkg-users.html). Therefore, since the mean value of the PG 0804+761 keV light curve is 1.1 cnts/sec, the residual background contribution to may be up to , or up to of the PG 0804+761 . This effect cannot account for the difference between the low and higher frequency PSD shown in Fig. 3.
“Red-noise” and “aliasing” effects could be another possible source of uncertainty in the estimation of the RXTE PSD. Since our results indicate that there is no significant amount of power at high frequencies, aliasing effects should not be significant. In order to verify that this is the case, we considered the case of a power spectrum with a slope and an amplitude such that the PSD is consistent with the lowest frequency estimate of the RXTE power spectrum and the ASCA intermediate-frequency estimate (long dashed line in Fig. 3). Since the observed light curve is almost evenly sampled, the aliased power at each sampled frequency can be estimated easily (see e.g. section 7.1.1 in Priestley, 1989). The aliased power spectrum, including the Poisson noise contribution, is also shown in Fig. 3 (thin solid line below the RXTE PSD) and does not fit well the RXTE power spectrum. In fact, we find that no power-law model, consistent with the intermediate-frequency ASCA power estimate, can fit well the RXTE PSD when we include aliasing effects. On the other hand, in the case of red noise effects, even if the intrinsic PSD continues with a power law slope of down to frequencies as low as Hz (i.e. a time-scale times longer than the length of the RXTE light curve) the amount of power that will be transferred to the observed frequency range cannot justify the discrepancy of the 2.5 orders that we observe between the RXTE and ASCA PSDs (e.g. Papadakis & Lawrence, 1995).
We then investigated the possibility that the PG 0804+761 PSD varies with time (i.e. the X–ray variability process is non-stationary). For that reason, we divided the RXTE light curve in two parts, and computed the periodogram for each one. The two periodograms look very similar, almost identical, both in shape and amplitude. This result implies that the PSD remained roughly constant during the year long RXTE monitoring observations. Therefore it seems rather unlikely that the large PSD amplitude difference between the ASCA and RXTE observations (which are separated by years only) is caused by intrinsic PSD normalization variations.
Another possible source of error is that we have determined the RXTE and ASCA PSDs in different energy bands. Specifically, the ASCA PSD was determined with a softer energy band. Even though the soft and hard X-rays are generally well correlated in AGN, and are in this case, this may be problematic because the PSD can be energy dependent. For example, Vaughan, Fabian & Nandra (2003) found a slope difference of in the case of MCG -6-30-15. Obviously this could affect the results in detail, but we note that this difference is not sufficient to explain the discrepancy between the RXTE and ASCA power spectra shown in Fig. 3. Furthermore, we expect the hard band to show less integrated power in the frequency than the soft band, and hence be even more discrepant with the extrapolation of the RXTE PSD. This is confirmed by analysis of the excess variance of the ASCA light curve, with the 0.5-2 keV ASCA light curve compared to in the 2-10 keV band. The bandpass effect would therefore cause an even greater discrepancy between the ASCA and RXTE PSDs. We have tested this explicitly by calculating the ASCA 2-10 keV PSD. While this is admittedly quite noisy it still lies way below an extrapolation of the RXTE power.
We conclude that, although existing uncertainties in the background modeling of the RXTE background may affect to some extend the shape and/or amplitude of the RXTE PSD, the large difference between the RXTE and ASCA PSDs shown in Fig. 3 implies the presence of an intrinsic feature in the PSD. It seems that the PG 0804+761 X–ray PSD follows a power-law shape up to Hz, and then steepens to a slope of (this “broken power-law form” is shown with the dot-dashed line in Fig. 3). This “characteristic break frequency” corresponds to a time-scale of days.
4 The energy spectrum

In order to maximize the signal-to-noise ratio, we considered only the time-averaged spectrum for the RXTE monitoring observations. We used the latest response matrix generator in FTOOLS v5.2 in order to generate 12 matrices, one for each month of the monitoring period. The appropriate detector matrix for the spectrum was created by averaging these matrices. We used XSPEC v11.2.0 to perform the spectral fitting analysis, and the errors on the best-fitting parameter values correspond to the 68% confidence limits. Finally, we kept data up to 15 keV, and excluded data below 3 keV for the spectral analysis due to the uncertainties associated with the calibration of the softest PCA channels.
First, the spectrum was compared to a simple model of a single power law, absorbed by neutral material at the redshift of PG 0804+761 (). This model provides an adequate description of the data (, for 24 dof, prob=0.14). The ratio “data/model” is shown in Fig. 4. This figure reveals clearly the presence of an iron line feature at energies keV. At energies keV, the residuals appear to be noisy, with no obvious systematic trend with energy.
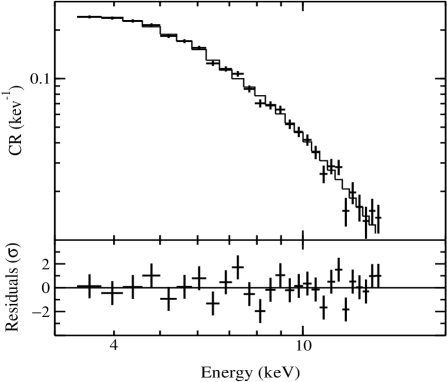
The combination of a power law and a Gaussian emission line (plus a natural material absorption component) results in a better fit to the spectrum (, for 22 dof). However, use of the F–test indicates that the improvement to the goodness of fit is not statistically significant. The best fitting spectral index is , consistent with the results of George et al. (2000) who find . The iron line is not resolved, but the upper limit of 1.36 keV () provides no constraint on its origin. The line’s best fitting energy is keV in the rest frame of the quasar, while the equivalent width is eV. The best model fitting unabsorbed keV flux is erg cm-2 s-1, and the corresponding X–ray luminosity is ergs/s (assuming Mpc km-1 s, ).
The best-fitting model together with the observed spectrum and the residuals plot is shown in Fig. 5. The model describes the overall shape of the spectrum quite well. There appears to be no systematic deviation of the data points with energy, which could imply the presence of an extra component in the spectrum. A possibly origin of the iron line is in relatively cool optically thick gas, in which case we expect it to be accompanied by a hard reflection continuum (e.g. Nandra & Pounds 1994). We therefore fitted with the XSPEC PEXRAV model (Magdziarz & Zdziarski 1995), which accounts for this “Compton reflection”, plus a Gaussian line. This model does not provide a significantly better fit to the spectrum (, for 21 dof). The best fitting spectral index, line energy and values are almost identical to the values we find from the previous model, with a best-fitting reflection fraction value of . The 90% confidence upper limit (for one interesting parameter, i.e. ) was , however, which is consistent with line equivalent width and therefore an origin for the line in optically thick gas.
4.1 Spectral variability
Apart from the fast, large amplitude intensity variations, Seyfert galaxies often show flux related spectral variations as well. In order to investigate the spectral variability properties of the source, we used RXTE light curves in the and keV bands, we computed the hardness ratio, , and produced a colour-flux diagram ( and represent the count rate in the respective energy bands). The two energy bands should be representative of the primary continuum mainly, as there is no indication of a reflection component in the energy spectrum, and the iron line emission is not very strong even in the time-average spectrum, so its contribution in the keV band during each individual observation should not be significant. Consequently, the values should be sensitive to the continuum shape variations mainly.
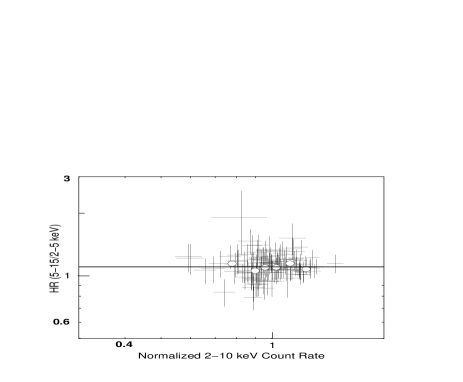
In Fig. 6 we plot the hardness ratio as a function of the keV count rate, normalised to the mean count rate. The points in this plot cluster in a well-defined, “continuous” region rather than forming a scatter diagram or filling separate “islands”. Therefore, we are certain that we have observed all the intermediate flux sates between the highest and lowest flux state of the source in the RXTE light curves. The open circle points correspond to the average values in flux bins which contain 20 points each.
There is no obvious colour-flux trend in Fig. 6. This becomes clear when we consider the average values (open circle points in Fig. 6) which do not suggest any flux related variation. When we fit the data with a power-law function () or a linear relationship (), we find . The solid line in Fig. 6 corresponds to the weighted mean value. This line provides a good fit to the data ( for 114 dof). We conclude that PG 0804+761 shows no spectral variations. The flux variations correspond to energy spectrum normalization variations with constant shape.
This is different from what is observed in Seyfert galaxies. For example, Papadakis et al. (2002) study the spectral variability properties of 4 Seyfert galaxies using year long, RXTE light curves. Since we have used normalized keV values, Fig. 6 can be compared directly with the plots in Fig. 3 of Papadakis et al., which show color-flux plots sensitive to variations of the continuum shape mainly. All Seyfert galaxies show significant spectral variations which are correlated with the source flux state: as the flux increases, the spectrum softens (as the dashed lines in their plots indicate). Typically, variations of the order of are observed for maximum peak-to-peak variations by a factor of . Although the flux variability amplitude of PG 0804+761 is smaller than the respective amplitude of the Seyfert galaxies, we should be able to detect similar spectral variations, if existed, in the case of PG 0804+761 as well.
5 Discussion and conclusions
We have presented a detailed temporal and spectral analysis of the 1 year RXTE monitoring observations of PG 0804+761. Significant variations are observed in the keV band. The variability amplitude of the source (as indicated by the keV ) is smaller than the variability amplitude of Seyfert galaxies, exactly as expected from the vs relation defined from the Seyfert data alone. We have presented a power spectrum analysis of the X–ray light curve, for the case of the most luminous radio-quiet quasar studied so far. The X–ray PSD follows a power-law like form, with a slope of . When combined with higher frequency PSD measurements based on ASCA data, a strong PSD break (to a slope of ) is implied at Hz. The energy spectrum is well fitted by a power law model plus a Gaussian line at keV with eV. Finally, we find that the fast intensity variations are not associated with significant spectral variations as well. We discuss below these results in some detail.
5.1 The PSD break
The most significant result of the power spectrum analysis is that, although the RXTE PSD does not show any characteristic time-scales, its combination with the ASCA PSD, implies a significant, strong break at Hz. This break suggests the presence of a characteristic time-scale in the system of the order of days. As we discussed in Section 3.2, we believe that this break is almost certainly real, i.e. it represents an intrinsic feature in the PSD of PG 0804+761. Due to the fact that, at present, the PG 0804+761 PSD is poorly defined, we cannot determine accurately neither the position of the break nor the exact shape of the PSD. Nevertheless, the available data (shown in Fig. 3) are consistent with the hypothesis of a PSD steepening from a slope of to above the break.
Long term, RXTE observations have recently revealed the presence of similar frequency breaks in the PSDs of a few Seyfert galaxies as well (Edelson & Nandra, 1999; Pounds et al. 2001; Uttley et al. 2002, Markowitz et al. 2003). Both the excellent agreement of the PG 0804+761 measurement with the vs relationship defined for Seyfert galaxies, and the similarity between the shape of its overall PSD with the power spectra of other Seyfert galaxies support the idea that that the same variability process operates in both Seyfert galaxies and quasars.
It is interesting to compare the ratio of the break time-scales and black hole mass between PG 0804+761 and the Seyfert galaxies studied by Markowitz et al. (2003). These authors find that the keV PSD of three Seyfert 1 galaxies, namely NGC 3783, NGC 3516 and NGC 4151, shows a steepening from a to a slope at Hz, Hz, and Hz, respectively. The black hole mass of these three objects is M⊙ (Kaspi et al. 2000), M⊙ (Onken et al. 2003) and M⊙ (Kaspi et al. 2000), respectively. According to Kaspi et al. (2000), the black hole mass of PG 0804+761 is M⊙. Assuming that the PG 0804+761 PSD shows a break frequency at , then, on average, we find that (Seyferts)(PG 0804+761) while (PG 0804+761)Seyferts. If we take account of the uncertainties associate with the determination of both and , we believe that this result is consistent with the hypothesis that the characteristic time-scales scale linearly with the black hole mass in Seyfert galaxies and quasars.
We would like to stress the fact that the detection of a break frequency in the PSD of PG 0804+761 is only suggestive at the moment. More data are needed in order to estimate better the overall PSD for PG 0804+761 and measure accurately . However, we think it is rather remarkable that the present results are consistent with the hypothesis of a linear relation between break time-scale and in Seyferts and quasars. This result becomes even more remarkable if we also consider the similarity in the PSD shape and the linear mass-time-scale linear relation between Seyfert and Galactic X–ray black hole binaries suggested by Edelson & Nandra (1999), Uttley et al. (2002) and Markowitz et al. (2003). The similarity of the PSD shape implies that the same variability mechanism operates in accreting systems with an enormous black hole mass range (M⊙). Furthermore, if the characteristic time-scale increases linearly with the black hole mass, then the main factor which determines the variability properties of the accreting black hole systems could simply be the size of the X–ray emitting source. As the black hole mass increases, the source size should increase as well. As a result time scales should also increase, and it would take longer time for a source to exhibit a fixed variability amplitude.
5.2 The energy spectrum and the lack of spectral variability
The spectral analysis results of the RXTE data presented in this work further support the idea that the same physical mechanism operates in both Seyfert galaxies and in their higher luminosity counterparts, the radio-quiet quasars. The best-fitting power law index of PG 0804+761 is consistent with the average spectral slope of Seyfert 1 galaxies, (Nandra & Pounds, 1994). The line energy suggests emission by fluorescence in near-neutral material. The equivalent width of the line is also consistent with the average value found by Nandra & Pounds (1994), from a fit of narrow Gaussians to GINGA data of Seyfert 1 galaxies.
The lack of spectral variability is the only major difference that we find between the X–ray properties of PG 0804+761 and Seyfert galaxies. The keV flux variations in Seyferts are almost always associated with correlated spectral variations (e.g. Papadakis et al., 2002, and references therein). Recent work on the spectral variability of Seyfert galaxies suggest that the spectral variations is the result of summing two components with different but intrinsically non-varying spectral shapes(e.g. Taylor, Uttley & McHardy, 2003, and references therein). In the case of PG 0804+761 we find that the keV variability in occurs with a constant spectral slope. It seems then that the X–ray emission of PG 0804+761 is dominated by a single power law component of variable normalization. Furthermore, this result suggests intrinsic luminosity variations in the absence of associated variations of the properties of the “hot corona” (assuming the currently favoured thermal Comptonization models where hot electrons produce the X–rays by inverse-Compton upscattering of soft, i.e. optical/UV, photons; Sunyaev & Titarchuk 1980; Haardt & Maraschi 1991). However, these models also predict spectral slope variations. An increase of the soft input photon flux will result in the reduction of the corona temperature, a steepening of the intrinsic spectrum, and hence an increase in the keV flux. This response of the X–ray spectrum to the soft input photon changes has already been observed in Seyfert galaxies (e.g. NGC 7469, Nandra et al. 2000; NGC 5548, Petrucci et al. 2000). One possible scenario that can explain the absence of spectral variations in PG 0804+761 is described by Haardt, Maraschi & Ghisellini (1997) in the case of a pair dominated Corona. If pairs dominate the scattering opacity of the hot corona, then during flux variations within a factor of 2 or so (the case of PG 0804+761) the spectral index is expected be remain essentially constant.
The corona is pair dominated in the case when the “compactness” parameter, , is larger than . In the case of the two-phase disc-corona model (e.g. Haardt & Maraschi, 1991), , where is the overall X–ray luminosity and is the typical size-scale of the X–ray emitting region. According to the variability results mentioned in the previous section, if the main parameter that determines the variability properties of AGN is the black hole mass through the relation (see discussion in section 5.1) and if then we would expect the ratio to remain constant in Seyferts and quasars. The fact that the corona could be pair dominated in PG 0804+761 but not in Seyfert galaxies (where spectral index variations are observed) could imply that is not an accurate indicator of the total X–ray luminosity in PG 0804+761 (for example the cut-off energy in the X–ray spectrum could be higher than in Seyfert galaxies). However, in this case, the agreement between PG 0804+761 and Seyferts shown in Fig. 2 should be accidental. Another possibility is that the geometry of the X–ray emitting region is different in PG 0804+761. Instead of a single smooth corona, the X–ray region may consist of numerous small regions above the disc (patchy corona). In this case could be increased, hence leading in a pair-dominated corona. Even if this is the case, if the absence of intrinsic spectral variations is due to a pair dominated corona, the energy spectrum of the source should extend up to at least keV, in contrast to the X–ray spectra of Seyfert galaxies which are thought to show a high energy cut-off at a few hundred keV.
Acknowledgments
PR acknowledges partial support from the European Union via the Training and Mobility of Researchers Network Grant ERBFMRX/CT98/0195 and from the Generalitat Valenciana via the Programme Ayudas para las acciones de apoyo a la investigación. PR is a researcher of the programme Ramón y Cajal funded by the University of Valencia and the Spanish Ministry of Science and Technology. This research has made use of the TARTARUS database, which is supported by Jane Turner and Kirpal Nandra under NASA grants NAG5-7385 and NAG5-7067. We would like to thank an anonymous referee for a fast and helpful report.
References
- [1] Edelson R., Nandra K., 1999, ApJ, 514, 682
- [2] George I.M., Turner T.J., Yaqoob T., Netzer H., Laor A., Mushotzky R.F., Nandra K., Takahashi T., 2000, ApJ, 531, 52
- [3] Green A.R., McHardy I.M., Lehto H.J., 1993, MNRAS, 265, 664
- [4] Haardt F., Maraschi L., 1991, ApJ, 380, L51
- [5] Haardt F., Maraschi L., Ghisellini G., 1997, ApJ, 476, 620
- [6] Kaspi S., Smith P.S., Netzer H., Maoz D., Buell T.J., Giveon U., 2000, 2000, ApJ, 533, 631
- [7] Lampton, M., Margon, B., Bowyer, S., 1976, ApJ, 208, 177
- [8] Lawrence, A., Watson, M.G., Pounds, K.A., Elvis, M., 1987, Nature, 325, 694
- [9] Lawrence A., Papadakis I.E., 1993, ApJ, 414, L85
- [10] Markowitz, A., Edelson, R., 2001, ApJ, 547, 684
- [11] Markowitz, A. et al. 2003, ApJ, in press (astro-ph:0303273)
- [12] Mason K.O., et al. 2002, ApJ, 580, L117
- [13] McHardy I., Czerny B., 1987, Nature, 325, 696
- [14] Nandra K., Pounds K.A., 1994, MNRAS, 268, 405
- [15] Nandra K., George I.M., Mushotzky R.F., Turner T.J., Yaqoob T., 1997, ApJ, 476, 70
- [16] Nandra K., Le T., George I.M., Edelson R.A., Mushotzky R.F., Peterson B.M., Turner T.J., 2000, ApJ, 544, 734
- [17] Nandra K., Papadakis I.E., 2001, ApJ, 554, 710
- [18] Onken C.A., Peterson B.M., Dietrich M., Robinson A., Salamanca I.M., 2003, ApJ, 585, 121
- [19] Papadakis I.E., Lawrence A., 1993, MNRAS, 261, 612
- [20] Papadakis I.E., Lawrence A., 1995, MNRAS, 272, 161
- [21] Papadakis I.E., Petrucci P.O., Maraschi L., McHardy, I.M., Uttley P., Haardt F., 2002, ApJ, 573, 92
- [22] Petrucci P.O., et al. 2000, ApJ, 540, 131
- [23] Pounds K., Edelson R., Markowitz A., Vaughan S., 2001, ApJ, 550, L15
- [24] Priestley M.B., 1989, Spectral Analysis and Time Series, Academic Press Limited, London, UK
- [25] Sunyaev R.A., Titarchuk L.G., 1980, A&A, 86, 121
- [26] Tyalor, R.D., Uttley P., McHardy I, 2003, MNRAS, in press (astro-ph:0304523)
- [27] Uttley P., McHardy I., Papadakis I.E., 2002, MNRAS, 332, 231
- [28] Vaughan S., Fabian A.C., Nandra K., 2003, MNRAS, 339, 1237