GLIMPSE : I. A SIRTF Legacy Project to Map the Inner Galaxy
Abstract
GLIMPSE (Galactic Legacy Infrared Mid-Plane Survey Extraordinaire), a SIRTF Legacy Science Program, will be a fully sampled, confusion-limited infrared survey of the inner two-thirds of the Galactic disk with a pixel resolution of using the Infrared Array Camera (IRAC ) at 3.6, 4.5, 5.8, and 8.0 . The survey will cover Galactic latitudes and longitudes to (both sides of the Galactic center). The survey area contains the outer ends of the Galactic bar, the Galactic molecular ring, and the inner spiral arms. The GLIMPSE team will process these data to produce a point source catalog, a point source data archive, and a set of mosaicked images. We summarize our observing strategy, give details of our data products, and summarize some of the principal science questions that will be addressed using GLIMPSE data. Up-to-date documentation, survey progress, and information on complementary datasets are available on the GLIMPSE web site: www.astro.wisc.edu/glimpse.
1 Motivation for GLIMPSE
The inner workings of our own Galaxy are as mysterious as those of galaxies located millions of light years away, mainly because of our unfavorable location in the mid-plane outskirts of the Milky Way’s dusty disk. The structure of the Galactic disk has been determined primarily from the distributions of atomic hydrogen (Westerhout 1957) and carbon monoxide which together contain no more than about 10% of the visible mass of the Galaxy (Scoville & Solomon 1975). The Galaxy is a typical luminous spiral, but its stellar distribution, particularly in the inner quadrants, is poorly known. For example, although there is significant evidence that the Galaxy has a molecular ring (Scoville & Solomon 1975), the number of stars recently formed in this ring, and the resultant appearance of the Galaxy’s spiral arms to an outside observer, are unknown.
The principal impediment to cataloging the stellar content of the inner Galaxy has been dust obscuration of the visible light from stars. What has been needed is a survey with high sensitivity and angular resolution in the middle infrared and longer wavelengths. The recently completed 2MASS (Two Micron All-Sky Survey) survey (Cutri et al. 2001) has been an important step in this process, producing a view of the inner Galaxy at wavelengths as long as 2.2 . Yet even at these wavelengths, the extinction due to dust significantly compromises our ability to probe the stellar content of the inner Galaxy and obtain accurate measurements of fundamental Galactic parameters.
GLIMPSE (Galactic Legacy Infrared Mid-Plane Survey Extraordinaire), a Legacy Project using SIRTF (Space InfraRed Telescope Facility, see Gallagher, Irace, & Werner 2002 for a description of the full facility), is a project to map the infrared emission from the inner Galaxy over the two strips and to using the IRAC instrument (see Fazio et al. 1998). Of all the SIRTF Legacy programs, this survey will cover the largest area on the sky (some 220 square degrees) and will yield the most panoramic images. With a total observing time of approximately 400 hours, the survey will consist of over 80,000 pointings, each resulting in four simultaneous IRAC images at 3.6 , 4.5 , 5.8 , and 8.0 . The GLIMPSE team will use these data to produce a highly reliable point source catalog, a somewhat deeper point source archive, a set of mosaicked images, and associated analysis software.
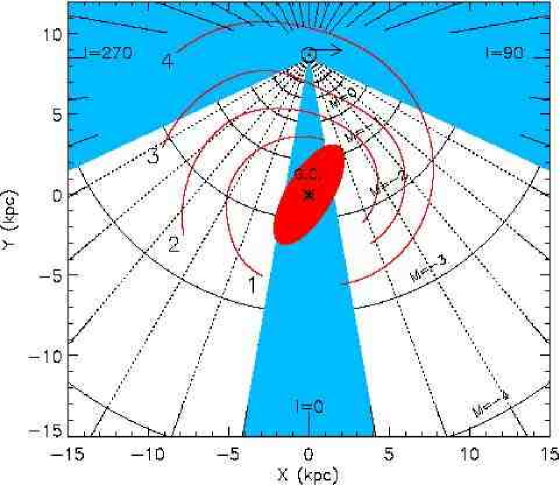
The survey area was chosen to include all of the major known or suspected stellar components of the inner Galaxy (except the central bulge), namely the outer ends of the Galactic bar, the molecular ring at a Galactocentric radius of kpc, the inner disk, and the inner spiral arms and spiral arm tangencies (See Figure 1). The inner degrees of the Galaxy are excluded from our survey because of the high background and confusion present there.
The GLIMPSE team will focus on two central science questions:
-
•
What is the structure of the inner Galaxy? What is the structure of the disk and molecular ring? What are the number and locations of spiral arms? What is the nature of the central bar as traced by the spatial distribution of stars and infrared-bright star formation regions? In particular, we will address the question of whether the Galaxy is a ringed galaxy by correlating the stellar content with studies of the molecular ring of the Galaxy (Clemens et al. 2000).
-
•
What are the statistics and physics of star formation? How does the nature of star formation depend on mass, stage of evolution, and location in the Milky Way? What will an unbiased infrared survey with well over 2000 star formation regions reveal about the earliest evolutionary stages of star formation? How does the infrared emission change during each of the principal stages of star formation?
The major purpose for GLIMPSE is to provide the community with a Legacy dataset complete to a well-defined flux limit suitable for a wide variety of astrophysical investigations. These might encompass population studies of different classes of Galactic objects, including regions of low and high mass star formation, highly evolved AGB and OH/IR stars, stars with circumstellar dust shells, cool stars of all luminosities, photodissociation regions (PDRs), proto-planetary nebulae, planetary nebulae, Wolf-Rayet stars, open clusters, and supernova remnants. Table 1 lists several classes of objects and the number of these objects already known to exist in the GLIMPSE survey area. GLIMPSE data will also be used to study the infrared dark clouds (Egan et al. 1998) revealed by MSX (Midcourse Space Experiment) and ISO (Infrared Space Observatory) and will extend the catalog of these objects to smaller sizes and fainter limits.
We expect that GLIMPSE data will be used by the community for investigations that we can not anticipate. Of all the directions in the sky, the inner Galaxy has heretofore been the most inaccessible because of dust obscuration. The GLIMPSE program will reveal for the first time a wealth of completely new stars, clusters, and galaxies. It is this element of serendipity that makes GLIMPSE a particularly exciting endeavor!
In this paper, we provide a description of the GLIMPSE observing plan (§2.1), data processing (§2.2), and data products (§2.3). Next, we give details on the scientific goals and challenges of the GLIMPSE survey, including high mass star formation in the inner Galaxy (§3.1.1), Galactic structure (§3.1.2), Legacy science (§3.2), and a description of the data sets that complement GLIMPSE (§3.3). A summary is given in §4.
2 Project Description
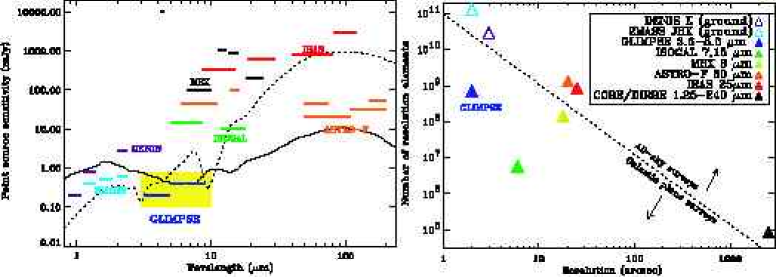
SIRTF and the Infrared Array Camera (IRAC) will be used to image two long strips comprising 220 square degrees at wavelengths centered on 3.6, 4.5, 5.8, and 8.0 m. The area surveyed by GLIMPSE (,) contains most of the star formation activity of the Galaxy, the outer ends of the central bar, all of the Galactic molecular ring, and four spiral arm tangencies. The principal characteristics of GLIMPSE are listed in Table 2. The improvements in sensitivity, angular resolution, and areal coverage afforded by GLIMPSE over previous infrared surveys of the Galactic plane are shown in Figure 2.
The GLIMPSE team will provide the following products: a high reliability GLIMPSE Point Source Catalog (GPSC) containing about 10 million objects, a GLIMPSE Point Source Archive (GPSA; ), and a Mosaicked Image Atlas of the entire surveyed area in all four IRAC bands. All these data products will be made available via the SSC (SIRTF Science Center). In addition, a set of web-accessed modeling tools will permit users to interpret SIRTF and other IR data.
Here we discuss the GLIMPSE implementation, data processing plans, and resulting data products. Up-to-date information on the progress of GLIMPSE observations (including a graphical survey tracker), data reduction and data releases can be found at the GLIMPSE website: www.astro.wisc.edu/glimpse.
2.1 GLIMPSE implementation
The orbit, orientation, and viewing limits on SIRTF conspire to make mapping the Galactic plane a complex process. Furthermore, the spectacular sensitivity of IRAC/SIRTF means that only exceedingly short exposures of the Galactic plane will not be saturated. These issues drive much of the GLIMPSE observing implementation.
Survey strategy: During standard SIRTF operations, IRAC “campaigns,” lasting 10 days to two weeks, will be scheduled. A fraction of these IRAC campaigns during the first year will be devoted to the GLIMPSE program which will observe many IRAC frames tiled together into segments of the Galactic plane. Each square degree segment will consist of 35-45 “chained” AORs (Astronomical Observing Requests).111“Chained” AORs must be carried out within a certain amount of time of each other. For GLIMPSE , the typical maximum separation between AORs is 3 hours. Each AOR will cover a narrow rectangular strip spanning to , but inclined to the Galactic plane. The inclination angle of the AOR to the Galactic plane depends upon the spacecraft roll angle. For GLIMPSE observations, the roll angle will lie between 15-50∘ from Galactic North. Example AOR sky coverage in the direction of the star formation region W51 is shown in Figure 3.
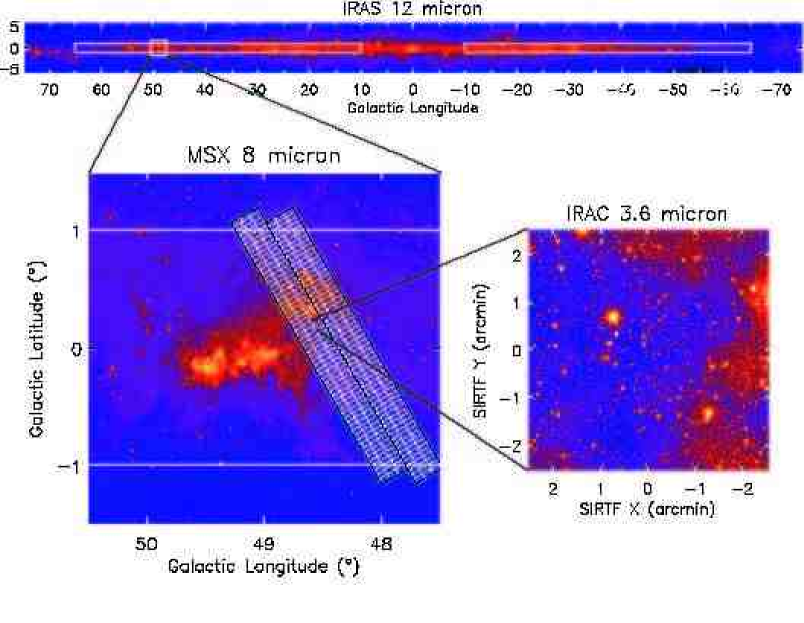
Each IRAC pointing simultaneously images two adjacent fields in two bands. An IRAC frame has 256 256 pixels; the 3.6 and 5.8 m fields coincide on the sky and the 4.5 and 8.0 m fields coincide on the sky, but the frame edges of the two fields are separated by 1.5. The total integration time per position is two seconds. The observations will be stepped by half-frames (128 pixels; 2.58) along the long axis of the AOR (which could be the spacecraft X or Y-axis, depending upon the roll angle). Every sky direction in the GLIMPSE region will be visited at least twice. The time separation between the two visits will range from 20 seconds (the time between pointings) to 3 hours (the time between AORs). The frame overlap along the short axis of the AOR will be (12 pixels). A typical AOR will take 1.5 hours to complete, yielding IRAC frames per band. Each segment of the Galactic plane will require 35-45 AORs; the entire survey will require 8 segments.
Observing Strategy Validation: Time will be scheduled during early SIRTF operations to validate our observing strategy (OSV). The GLIMPSE OSV region will be chosen to sample a range of stellar densities and diffuse background levels characteristic of the inner Galactic plane. Regions of particularly high stellar density and diffuse background will be included to assess our strategy in the most challenging cases. The OSV will view either W51, G333.3-0.4, G305.2+0.2, or NGC6334, depending upon SIRTF launch date. The goal of these observations is to assure that GLIMPSE data will have the highest reliability point-source extraction and the greatest possible sky-coverage, and to prevent the occurrence of gaps in the survey area. GLIMPSE reliability and completeness calculations, which have been based on simulated data, will be tested by these observations. The OSV will consist of four AORs nearly identical to normal GLIMPSE AORs. These will be repeated with varying frame offsets (along the strip direction) and overlaps (between strips). Finally, GLIMPSE OSV will perform a single AOR to allow us to evaluate the pointing reconstruction accuracy for the full half hour that it takes to do a single diagonal band across the Galactic plane, testing roll angle uncertainties between AORs, and determining criteria for establishing reliability and completeness. At the end of the OSV period, the outer longitude limits of the survey may be adjusted so that the total survey time does not exceed 400 hours.
Frame Details: The simulated 3.6m IRAC frame for the W51 region shown in Figure 3 illustrates both the wealth of detail that GLIMPSE will uncover and the significant challenges for processing and analyzing these data. In this region, there are 400-600 2MASS sources per frame, all of which are detectable by GLIMPSE . (See Table 3 for the 5 sensitivities and estimated flux limits for 99.5% reliability.) Examination of 2MASS and MSX data for this region indicates that we should expect 2-4 saturated sources per frame in the 3.6m band decreasing to an average of one saturated source per frame in the 8.0m band.
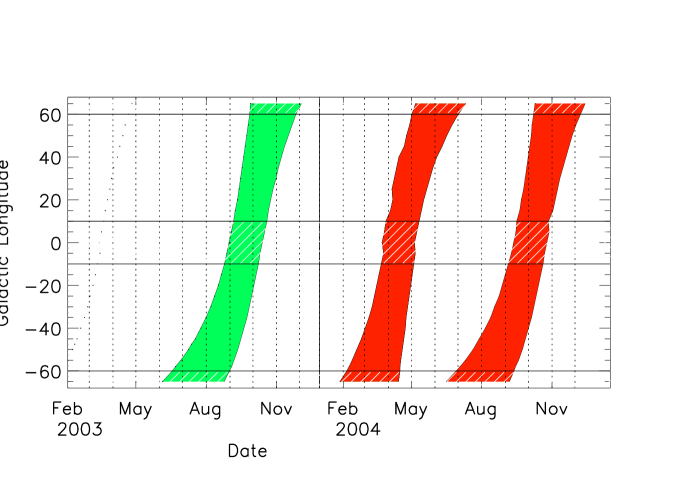
Timetable and Survey Tracking: For our timetable, we give the dates relative to the launch date (L+n months). The OSV data, to validate the survey strategy for GLIMPSE , will be acquired at approximately L+4. Data acquisition for the full survey will begin after OSV data are analyzed and the survey strategy is validated, and will continue for about 9 months. The observability of a section of the Galactic plane as a function of Galactic longitude and time of year is shown in Figure 4.
The first installment of the GLIMPSE Point Source Catalog will be delivered to SSC at L+9; the first installment of the mosaicked data and GLIMPSE Point Source Archive will be delivered at L+15. Updates to each of these data products will be provided at six month intervals after the first release dates. The final version of all GLIMPSE data products will be delivered to SSC at L+27. Documentation of the GLIMPSE survey will be available shortly after launch (L+2); updates will be provided with the data releases. A preliminary version of the GLIMPSE Legacy Science Data Products document is already available on our web site and will be available from the SIRTF Science Center.
2.2 Data Processing
The SSC will deliver Basic Calibrated Data (BCD) from the GLIMPSE IRAC observations to the GLIMPSE team. BCD will have gone through the following steps: validation, addition of header keywords, sense of InSb flux flipped, conversion to floating point, correction for dichroic flip, normalization by Fowler number and barrel-shifts, corrections of electronic bandwidth limitations, subtraction of dark/bias frames, correction for multiplexer bleed, correction for first-frame effects, linearization, flattening, detection of radiation hits, subtraction of sky darks, flux calibration, and detection of latents. The positional information will be good to and the photometric accuracy should be better than 10% early in the mission. BCD will also contain several ancillary data files, including the raw data, and several mask images that contain information on cosmic rays, linearity corrections, etc. A complete description of the processing that goes into generating the BCD is given in §6.3 of the SIRTF Observers’ Manual (SIRTF 2002).
The GLIMPSE team will further process these data using an automated pipeline (a “Post-BCD” pipeline) to correct for remaining instrumental artifacts, extract and cross identify point sources, and mosaic the images. The resulting GLIMPSE Point Source Catalog and Archive and the set of mosaicked images will be released to the astronomical community via the SSC. These released data will be more useful than the original BCD data, since they will benefit from the GLIMPSE team’s experience in analyzing IRAC data in crowded and confused fields which have bright and positionally varying background emission.
The data reduction will occur at the University of Wisconsin-Madison using a network of LINUX workstations. The GLIMPSE pipeline is parallelized and will simultaneously use multiple processors; data flow will be controlled using OPUS pipeline software (Swade & Rose 1999). Locally, the data will be stored using the commercial database system, Oracle 9i, Release 2.
We have divided the Post BCD pipeline into a few key levels with clearly defined steps within each. In order, these levels are:
-
•
Data Verification: Observed AORs are verified and checked to make sure the AOR was properly executed. The data are checked to verify that all SSC pipeline steps were carried out and checked for simple artifacts such as excessive cosmic ray hits and instrumental and down-link problems. A Quick-Look Validation Tool (QLVT) is used for spot-checks of frames and to inspect frames with flagged problems.222 Quick-Look Validation Tool (QLVT) is a quality assessment tool developed by team member Mark Wolfire, which simultaneously displays four IRAC frames, data masks, and ancillary 2MASS/MSX data. The interface allows a user to insert comments and mark potentially bad pixels.
-
•
Basic Processing and Mask Propagation: The data are corrected for the zodiacal background (Gorjian, Wright, & Chary 2000). Pixels affected by stray light, banding333Banding refers to streaks that pre-launch tests suggest might appear in the rows and columns radiating away from bright sources in the 5.8 and 8.0 m bands. The severity of this effect will be determined on-orbit., or that are in the wings of saturated sources are flagged and corrected wherever possible. An error mask for these pixels is created.
-
•
Point Source Extraction: Flux density and position of point sources are determined using DAOPHOT (Stetson 1987). Positions of the brighter sources are checked against the 2MASS Point Source Catalog. Statistics are computed for the residual images and used to assess the extraction process. Flux calibration is also spot-checked.
-
•
Bandmerging: The point source lists obtained in the eight pointed observations (two passes each in four bands) are merged to produce the input for the generation of the GLIMPSE Point Source Catalog and GLIMPSE Point Source Archive.
-
•
Mosaicked Image Production: The data are resampled, registered to a Galactic coordinate system, and IRAC frames are background matched, if necessary. The resulting images are turned into tiles of mosaicked images of . The pixel size for these images is not yet finalized but will be approximately .
-
•
Point-Source Photometry on the Mosaicked Image: The mosaicked images are used to perform point-source photometry. The resulting source list is then bandmerged with source list from single-frame data.
-
•
GLIMPSE Point-Source Catalog and Archive Generation: Sources found in mosaicked and single frames are cross identified. Appropriate quality and reliability filters are applied to generate the GLIMPSE point-source products.
2.3 Data Products
There are four principal data products that will result from the GLIMPSE program. These are:
-
1.
A GLIMPSE Point Source Catalog (GPSC, or the “Catalog”). The flux limit for this catalog will be determined by the requirement that the reliability be 99.5%. We currently estimate this flux limit to be 1.1 mJy at and 2.5 mJy at . The channel has a brighter limit due to the increased diffuse background from PAH emission near 7.7 m in the Galactic plane. The Catalog photometric uncertainty will be 0.2 mag. For each IRAC band, the Catalog will provide fluxes (with errors), positions (with errors), the density of local point sources, the local sky brightness, and flags that provide information on source quality and any anomalies present in the data. The Catalog is expected to contain objects.
-
2.
A GLIMPSE Point Source Archive (GPSA or the “Archive”), consisting of point sources with signal levels above the local background, to approximately a flux limit of 0.2-0.4 mJy. The photometric uncertainty is expected to be 0.2 mag. The information provided will be the same as for the Catalog. The Archive will contain objects.
-
3.
Mosaicked Images for each band, each of approximately 20′20′ angular coverage. About 9000 FITS formatted images will be tiled to smoothly cover the entire survey area, using a Galactic coordinate system. The pixel resolution has not been finalized but will be about 0.6″.
-
4.
The Web Infrared Tool Shed (WITS), a web interface to a collection of model infrared spectra of dusty envelopes and photodissociation regions (PDRs), updated for IRAC and MIPS band passes. WITS currently resides on servers at the Infrared Processing and Analysis Center (IPAC, www.ipac.caltech.edu). The interface contains two “toolboxes”: DIRT (Dust InfraRed Toolbox) and PDRT (PhotoDissociation Region Toolbox) which provide databases of circumstellar shell emission models and PDR emission models. Users can input data and retrieve best fit models. DIRT output includes central source and dust shell parameters; PDRT output consists of gas density, temperature, incident UV field and IR line intensities.
3 GLIMPSE Scientific Challenges
The GLIMPSE project will produce a rich dataset that can be used for numerous and diverse investigations. Here we discuss some of the expected scientific uses of this survey and several complementary datasets. We first discuss the principal science goals of the GLIMPSE team: a census of star formation in the inner Galaxy and a study of Galactic structure as determined by the distribution of stars. This is followed by a discussion of community science and complementary data sets.
3.1 GLIMPSE Team Science Goals
The GLIMPSE survey will uncover for the first time a huge number of stars in the inner Galaxy. As a result, it will be the survey of choice for those interested in the stellar structure of the Galaxy. Moreover, since the preponderance of star formation in the Galaxy is expected to occur in the inner Galaxy, studies using GLIMPSE will be able to characterize star formation in a wide range of environments. These are the two principal goals of the GLIMPSE science team.
3.1.1 Star Formation in the Inner Galaxy
The GLIMPSE team will address several fundamental questions regarding star formation in the inner Galaxy using the GLIMPSE data products. These include the following:
At what rate are stars forming in the inner Galaxy? Conservatively, we expect that analysis of GLIMPSE data will reveal several thousand star formation regions (SFRs). A search of the SIMBAD database lists over one thousand HII regions in our survey area; MSX 8 images of the GLIMPSE survey area indicate that there are many more to be found (Cohen & Green 2001). Extrapolation from the luminosity functions of OB associations in other galaxies (McKee & Williams 1997) suggest that there should be several thousand SFRs in our survey area. SFRs and other Galactic clusters are about 0.7 pc in diameter (Harris & Harris 2000) and will subtend at 15 kpc. Nearby clusters will spread across arcminutes, and will be partially resolved into individual stars and protostars. CO, HI, and radio continuum surveys (see §3.4) will also allow us to carry out targeted searches for star formation in the inner Galaxy.
What are the spatial and mass distributions of lower mass stars in massive star formation regions? Because of high extinction and the low luminosity of low-mass stars in massive star formation regions, we know very little about the spatial and mass distributions of low mass () stars associated with massive star formation regions. GLIMPSE data can be used to delineate both the spatial and mass distribution of lower mass stars in nearby (few kiloparsecs) star formation regions.
How does star formation vary as a function of position in the Galaxy? Since GLIMPSE will allow for an unbiased sample of massive star formation in the inner Galaxy, it will allow us to search for variations in star formation properties, i.e., cluster density, initial mass function, gas content, in a wide range of Galactic environments.
How many low mass star formation regions in the inner Galaxy have been hidden until now? SFRs that contain only stars later than spectral type B3 are not easily detected in radio continuum searches but will be detected by GLIMPSE . In the nearest SFRs, GLIMPSE data could be used for a census of the properties of intermediate mass pre-main sequence stars.
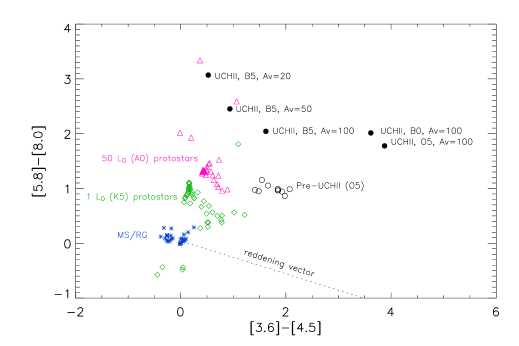
How does the infrared emission of star formation regions change over time? GLIMPSE data will provide information on the stellar content of all of the principal stages of massive star formation, summarized recently in Churchwell (2002). Figure 5 demonstrates that these stages are expected to have significantly different IRAC colors.
3.1.2 Galactic Structure
There are three main questions that the GLIMPSE team seeks to address using GLIMPSE data:
Does the Galaxy have a stellar ring? The Galactic molecular ring contains some 70% of all molecular gas in the Galaxy, and should be the dominant star-forming structure in the Milky Way (Clemens et al. 2001). On this basis, Kennicutt (2001) suggests that our Galaxy should be classified as an SB(r)bc pec. Where in the ring are the stars forming? How do the properties of the gas correlate with star formation? How does the ring’s star formation efficiency compare with starburst regions in other galaxies? Comparison of GLIMPSE data with the 13CO maps of this region of the Galaxy should yield answers to these important questions.
What are the nature of the spiral arms and disk in the inner Galaxy? Observations have given clues for the gas (HI and CO), but we know little about the stars and SFRs. Are stars formed on the leading or trailing edges of gas arms? How do the stars formed in arms and in interarm regions differ? Drimmell & Spergel (2001) show that K band (stellar light) profiles are consistent with a two-armed logarithmic spiral model, while the 240 (dust emission) is consistent with a four-armed HII region distribution (Taylor & Cordes 1993). GLIMPSE data will allow us to determine the positions of individual star formation regions, account for regions of high obscuration, and determine if the integrated light observed by COBE/DIRBE is dominated by individual objects. GLIMPSE data will also allow us to identify different tracer populations (SFRs, OH/IR stars, IR carbon stars, etc) and their spatial distributions. The resulting information will help test models of gas dynamics, star formation and evolution in the inner Galaxy (Englmaier & Gerhard 1999).
GLIMPSE data will also help constrain values of the scale-lengths for the thin and thick stellar disks. Measuring the ratio of the thin-to-thick disk scale-length will constrain the merger history of the Galaxy (Quinn, Hernquist & Fullager 1993). Measuring the scale-length of the thin disk will establish whether the central mass distribution of the Galaxy is stellar- or dark matter-dominated.
What are the principal properties of the central stellar bar of the Galaxy? COBE/DIRBE data have shown the global distribution of the bar (Freudenreich 1998; Gerhard 2002). 2MASS studies using IR carbon stars have also traced the structure and possibly the age of the Galactic bar (Cole & Weinberg 2002). GLIMPSE data will allow us to extend these studies, look for star formation at the ends of the bar, and explore the connection between the bar and inner spiral arms.
3.2 Community Science from GLIMPSE Data
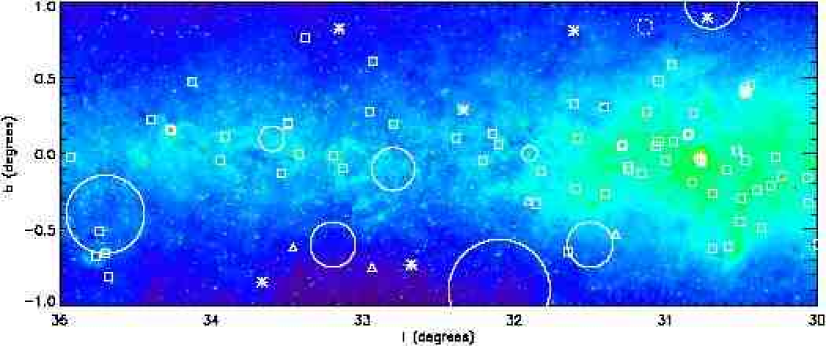
The wide variety of objects contained in the GLIMPSE survey region is illustrated in Figure 6, which shows the positions of many types of objects overlaid on an MSX map of a section of the GLIMPSE survey region. With the higher sensitivity and angular resolution of GLIMPSE , together with the color-select possibilities of seven or more photometric bands (GLIMPSE + 2MASS+MSX), data from GLIMPSE will allow the astronomical community to evaluate the statistics, spatial distribution, and internal structures of numerous classes of Galactic objects as well as providing new probes of the interstellar medium. These include studies of stellar populations, photo-dissociation regions (PDRs), extinction, as well as serendipitous discoveries.
Stellar population studies: Using a combination of 2MASS and MSX data towards a sample of previously classified objects in the Large Magellanic Clouds, Egan et al. (2001) showed that the mid-IR band provides an important “lever arm” that allows color separation of many classes of objects. Planetary nebulae, HII regions, and some classes of C- and O-rich AGB stars have very red mid-IR colors. Other attempts to develop mid-IR and near-IR color selections focus on infrared carbon stars using vs. (Cole & Weinberg 2002), young stellar objects (YSOs) using ISOGAL [7]-[15] vs. [15] (Felli et al 2002), brown dwarfs (Burrows et al. 1997), and carbon stars, OH/IR stars, PN, Herbig AeBe stars, compact HII regions, and massive YSOs using a combination of 2MASS J, H, K, and MSX (Lumsden et al 2002).
Photo-Dissociation Regions (PDRs): The near/mid IR spectrum of photo-dissociation regions at the surface of molecular clouds is dominated by emission bands at 3.3, 6.2, 7.7, 8.6, and 11.3 , probably arising from polycyclic aromatic hydrocarbon (PAH) molecules (Peeters et al. 2002 and references therein). Figure 6 shows that this emission is a striking characteristic of the MSX maps of the Galactic plane. GLIMPSE data can be used to characterize the spatial distribution of different charge states of PAH to constrain the chemistry and evolution of PDRs. The IRAC 3.6 band is sensitive to the 3.3 feature from neutral PAHs; the 5.8 and 8.0 bands are sensitive to PAH+, while the 4.5 band contains no PAH features and thereby monitors the continuum (Bakes et al. 2001).
Turbulence and Structure in Star Formation Regions: A comparison of the infrared brightness fluctuations in star formation regions with the spectral line information from CO and HI observations can yield information about the source of ISM turbulence, by using the Velocity Channel Analysis technique of Lazarian & Pogosyan (2000).
Interstellar Extinction: Data from GLIMPSE will allow studies of interstellar reddening in dense dusty regions and diffuse environments, using the colors of stars that lie behind dark clouds. This will allow testing near/mid infrared extinction models, two of which are given in Table 3 (Li & Draine 2001; Lutz et al. 1996). Since extensive grain coagulation occurs in the inner regions of dense clouds, the IR extinction law could be quite different between very dense clouds like the MSX dark clouds (Egan et al. 1998) and presently observable regions. GLIMPSE data will allow a vital characterization of the variation of extinction properties with environment.
Serendipity: Since the inner Galaxy is the region of the sky with the greatest extinction, it is also the direction in which one is most likely to make serendipitous discoveries. The recent 2MASS discoveries of new globular clusters in the Galactic plane (Hurt et al. 2000) and galaxies in the “Zone of Avoidance” (Jarrett et al. 2000) hint at the possibilities for GLIMPSE .
3.3 Complementary Data Sets
The value of the GLIMPSE data products will be enhanced by the availability of complementary IR and radio data sets. The basic characteristics of the IR surveys are given in Table 4. Data sets that we anticipate will be the most useful, and that will play important roles in the GLIMPSE team science studies, are
-
1.
2MASS: This survey (Cutri et al. 2001) provides an ideal companion dataset to GLIMPSE , with an excellent match in both sensitivity and angular resolution for many types of objects. Many objects will have GLIMPSE 2MASS magnitudes in a total of seven near-IR and mid-IR bands! This will allow for a wide variety of different possible color selections and SED’s from 1 m to 8 m. The GLIMPSE bands provide crucial mid infrared information.
-
2.
MSX: The MSX (Price et al. 2001) survey provides a good match to the GLIMPSE /IRAC 8m band. The MSX dataset will be particularly useful for studies of diffuse emission. It provides a good complement to the GLIMPSE data for bright sources, since the saturation limit of GLIMPSE is only slightly brighter than the faint detection limit for MSX.
-
3.
Arecibo/Green Bank Telescope/Australian Telescope Compact Array Surveys of GLIMPSE HII Regions: This dataset resolves the distance ambiguities to many massive star formation regions. The data include objects with resolved distance ambiguities which will be published and made available on the GLIMPSE web site: www.astro.wisc.edu/glimpse.
-
4.
Milky Way Galactic Ring Survey (GRS): A Boston University and Five College Radio Astronomy Observatory collaboration, this is a large-scale molecular line survey of the inner Galaxy between latitudes ∘ to ∘ and longitudes 18∘ and 52∘, with an angular resolution of and a velocity resolution of (Simon et al. 2001) It is available through the GRS website: www.bu.edu/grs. GRS will be completed by winter 2003.
-
5.
The International Galactic Plane Survey: This survey will map the Milky Way disk in the HI 21-cm line with a resolution of 1′ and over the entire GLIMPSE survey area. The data cubes will be available at www.ras.ucalgary.ca/IGPS. The Southern Galactic Plane Survey is available at ftp://ftp.astro.umn.edu/pub/users/john/sgps .
There are several other surveys that will provide a useful complement to GLIMPSE . These include the ISOGAL survey at 7 and 15 m (Omont et al 2003; Felli et al 2002) which provides complentary data for the inner Galaxy region not covered by the GLIMPSE survey, and the planned all-sky ASTRO-F survey at 8.5 – 175 m which will provide provide an extension to large galactic latitudes and longitudes, although at lower resolution and sensitivity than GLIMPSE (See Table 4). High angular resolution X-ray surveys of the Galactic plane using Chandra (Grindlay et al 2003; http://hea-www.harvard.edu/ChaMPlane) and XMM (Helfand et al 2002) will also provide a useful comparison to GLIMPSE data in selected regions of the Galactic plane.
4 Summary
The GLIMPSE project will allow us to study, for the first time, the stellar content of the inner Galaxy with high angular resolution and a minimum of extinction. The GLIMPSE team and others will use these data to study Galactic stellar structure, characterizing the stellar content and star formation in the Galactic bar and inner spiral arms. It may allow us to ascertain whether the Galaxy is a ringed spiral. In addition, the data will be used to study the distribution and statistics of star formation throughout the Galaxy.
The survey will use the IRAC instrument on SIRTF to image 220 square degrees in four bands (3.6,4.5,5.8, and 8.0 m) with a pixel resolution of 1.2″. It will cover two strips spanned by and to , a region covering the outer ends of the Galactic bar, the Molecular ring, and four spiral arm tangencies. The resulting dataset will be the most panoramic produced by SIRTF.
The principal data products from the GLIMPSE team will be a high-reliability GLIMPSE Point Source Catalog (GPSC) with about ten million sources and approximate flux limit of 1.0 mJy (3.6m band) to 2.5 mJy (8.0 m band), a GLIMPSE Point Source Archive (GPSA) with about 50 million sources and an approximate flux limit of 0.2-0.4 mJy , a set of mosaicked images for each band, and a set of Web based analysis tools. The first release of the GPSC will be nine months after the launch of SIRTF , and the first installments of the GPSA and mosaicked images will be be fifteen months after launch. These data products and the supporting documentation will be updated at six month intervals and will be complete 27 months after launch.
GLIMPSE data will drive a wide range of scientific investigations including the search for rare, bright Galactic objects, stellar population studies, studies of Galactic structure, high angular resolution studies of diffuse emission in PDRs, and studies of extinction in the near to mid-infrared. The science from GLIMPSE data will fuel observing programs and scientific investigations for decades. The probability of serendipitous discoveries is high for the GLIMPSE survey. We expect that it will lead to the discovery of new stellar clusters and galaxies hidden behind what had previously been an impenetrable wall of dust. We eagerly look forward to providing this resource to the community.
References
- (1) Bakes, E.L.O., Tielens, A.G.G.M., Bauschlicher, C.W., Jr., Hudgins, D.M. & Allamandola, L.J. 2001, ApJ, 560, 261
- (2) Burrows et al. 1997, ApJ, 491, 856
- (3) Churchwell, E. 2002, ARAA, 40, 27
- (4) Clemens, D., Jackson, J., Bania, T., & Heyer, M. 2000, in Astrophysics with Infrared Surveys, eds. M.D. Bicay, C.A. Beichman, & B.F. Madore, ASP Conf. Series 117 (San Francisco: ASP Press), 340
- (5) Clemens, D., Simon, R., Jackson, J.M., & Bania, T.M. 2001 in Tetons 4: Galactic Structure, Stars, and the Interstellar Medium, eds. C.E. Woodward, M.D. Bicay, & J.M. Shull, ASP Conf. Series 231 (San Francisco: ASP Press), 186
- (6) Cohen, M. & Green, A.J. 2001, MNRAS, 325, 531
- (7) Cohen, M., Hammersley, P.L., & Egan, M.P. 2000, ApJ, 120, 3362
- (8) Cole, A. A. & Weinberg, M. D. 2002, ApJL, 574, L43
- (9) Cutri, R.M. et al. 2001, “Explanatory Supplement to the 2MASS Second Incremental Data Release,” http://www.ipac.caltech.edu/2mass/
- (10) Drimmel, R. & Spergel, 2001, ApJ, 556, 181
- (11) Egan, M.P. et al. 1998, ApJ, 494, 199
- (12) Egan, M.P., van Dyk, S.D., & Price, S.D., 2001, AJ, 122, 1844
- (13) Englmaier, P. & Gerhard, O. 1999, MNRAS, 304, 512
- (14) Fazio, G.G. et al. 1998, Proc. SPIE, 3354, 1024
- (15) Felli, M., Testi, L., Schuller, F., & Omont, A. 2002, A&A, 392, 971
- (16) Freudenreich, H. T. 1998, ApJ, 492, 495
- (17) Gallagher, D. B., Irace, W.R., & Werner, M. W. 2002, Proc. SPIE, 4850-04
- (18) Gerhard, O. 2002, in The Dynamics, Structure, & History of Galaxies, ASP Conference Proceedings, Vol 273 eds. G. S. Da Costa & E. M. Sadler, (San Francisco: ASP Conference Series), 73
- (19) Gorjian, V., Wright, E.L., & Chary, R.R. 2000, ApJ, 536, 550
- (20) Grindlay, J. et al 2003, Astron. Nachr., in press
- (21) Harris, H.C. & Harris, W.E. 2000 in Allen’s Astrophysical Quantities, 4th edition, ed. A. N. Cox, (New York: AIP Press/Springer), 545
- (22) Helfand, D.J., Fallon, A., Becker, R.H., Giveon, U., & White, R.L 2002, BAAS, 201, 50.03
- (23) Hurt, R.L., Jarrett, T.H., Kirkpatrick, J.D., Cutri, R.M., Schneider, S.E., Skrutskie, M., & van Driel, W. 2000, AJ, 120, 1876
- (24) Jarrett, T.-H., Chester, T., Cutri, R., Schneider, S., Rosenberg, J., Huchra, J.P., & Mader, J. 2000, AJ, 120, 298
- (25) Kennicutt, R. C. 2001 in Tetons 4: Galactic Structure, Stars, and the Interstellar Medium, eds. C.E. Woodward, M.D. Bicay, & J.M. Shull, ASP Conf. Series 231 (San Francisco: ASP Press), 2
- (26) Lazarian, A. & Pogosyan, D. 2000, ApJ, 537, 720
- (27) Li, A. & Draine, B.T. 2001, ApJ, 554, 778
- (28) Lumsden, S.L., Hoare, M.G., Oudmaijer, R.D. & Richards, D. 2002, MNRAS 336, 621
- (29) Lutz, D. et al, 1996, A&A 315, L269
- (30) McKee, C. F., & Williams, J. P. 1997, ApJ, 476, 144
- (31) Omont, A. et al. 2003, A&A, in preparation
- (32) Peeters, E. et al. 2002, A&A, 390, 1089
- (33) Price, S. D., Egan, M.P., Carey, S.J., Mizunao, D.R., & Kuchar, T.A. 2001, AJ, 121, 2819
- (34) Quinn, P.J., Hernquist, L., Fullager, D.P. 1993, ApJ, 403, 74
- (35) Simon, R., Jackson, J.M., Clemens, D.P., Bania, T.M., & Heyer, M.H. 2001, ApJ, 551, 747
- (36) Scoville, N. Z. & Solomon, P.M. 1975, ApJ, 199, 105
- (37) SIRTF Observers Manual, 2002, version 3.0, http://sirtf.caltech.edu/SSC/documents/som
- (38) Stetson, P.B. 1987, PASP, 99, 191
- (39) Swade, D.A. & Rose, J.F. 1999 in Astronomical Data Analysis Software and Systems VIII, ASP Conference Series, Vol 172, eds D.M. Mehringer, R.L. Plante, and D.A. Roberts (San Francisco: ASP), 111
- (40) Taylor, J. H., & Cordes, J. M. 1993, ApJ, 411, 674
- (41) Tokunaga, A.T. 2000 in Allen’s Astrophysical Quantities, 4th edition, ed. A. N. Cox, (New York: AIP Press/Springer), 143
- (42) Wainscoat, R.J., Cohen, M., Volk, K, Walker, H.J., & Schwartz, D.E. 1992, ApJS, 83, 111
- (43) Westerhout, G. 1957, Proc. 4th IAU Symp., ed. H.C. van de Hulst, (Cambridge U. Press: New York), 22
- (44) Whitney, B. A., et al. 2003, in preparation
| Object Type | Number known in GLIMPSE region | Examples |
|---|---|---|
| MSX point sources | 61,321 | |
| IRAS point sources | 15,501 | |
| HII regions | 1174 | M16 (Eagle Nebula), M17, W43,W49,W51 |
| ROSAT point sources | 459 | |
| Radio pulsars | 264 | |
| Dark clouds | 210 | Coalsack, Vulpecula Rift, B48, LDN485 |
| Galaxies | 157 | IRAS 16232-4917, GAL 312.11-0.20 |
| ASCA point sources | 144 | |
| Supernova remnants | 100 | Kes 69, RCW 103, CTB 37A/B, Carina |
| O/B stars | 98 | BD-20 5020, BD-15 4930,BD+31 3921 |
| Open clusters | 76 | NGC 3572, Sco OB2, Sct OB2, Westerlund 1 |
| Planetary nebulae | 65 | NGC 6537, NGC 6842, IC 4637 |
| Wolf-Rayet stars | 50 | IC14-17, Vyl-3, W43#1, The 3 |
| Globular clusters | 1 | 2MASS-GC01 |
| Characteristic | Description |
|---|---|
| Galactic Longitude Limits | |
| Galactic Latitude Limits | |
| Total Survey Area | 220 square degrees |
| Total Survey Time | 400 hours |
| Total Resolution elements per band | |
| Total Number of IRAC frames per band | 80,000 |
| IRAC frame size | ( pixels) |
| Pixel resolution | |
| Frame time per visit | 2 seconds |
| Number of visits per position | 2 |
| Frame overlapaaSubject to change after observing strategy validation period. | (12 pixels) |
| IRAC wavebands | 3.6m, 4.5m, 5.8m, 8.0m |
| Sensitivity (4 sec.) | 0.2, 0.2, 0.4, 0.4 mJy |
| Estimated completeness limit for GPSCbbFlux level necessary to achieve 99.5% reliability based on simulated data. These values are subject to change after the observing strategy validation period. | 1.0, 1.5, 2.0, 2.5 mJy |
| Saturation limits | 180, 190, 570, 470 mJy |
| Galactic features covered | Outer ends of Galactic bar, molecular ring, |
| four spiral arm tangencies: Norma(), | |
| Scutum-Crux(), Sagittarius-Carina() |
| Survey/Band | Bandwidth | Zero mag.aaZero magnitude for J,H,K from 2MASS Explanatory supplement. Zero magnitude from MSX from Cohen, Hammersley, & Egan (2000). IRAC zero magnitudes are interpolated from Table 7.5 in Tokunaga (2000); these may differ by as much as 13% from the final adopted values (M. Cohen, priv communication). | 5 Sens. | Complete Lim. | Sat. Lim | eeExtinction curve from Li & Draine (2001) | eeExtinction curve from Li & Draine (2001) | ffExtinction curve from Lutz et al (1996) | |
|---|---|---|---|---|---|---|---|---|---|
| (m) | (m) | (Jy) | (mJy) | (mJy) | (mJy) | () | |||
| 2MASS/J | 1.24 | 0.25 | 1592 | 0.4 | 0.3–0.8 | 15920 | 1.482 | 0.293 | 0.293 |
| 2MASS/H | 1.66 | 0.30 | 1024 | 0.5 | 0.4–0.9 | 10240 | 0.959 | 0.190 | 0.190 |
| 2MASS/K | 2.16 | 0.32 | 667 | 0.6 | 0.5–1.3 | 6670 | 0.593 | 0.117 | 0.117 |
| GLIMPSE/IRAC 1 | 3.55 | 0.66 | 289 | 0.2 bb5 sensitivity for a 4 second integration using IRAC. | 0.4–1.0ccFlux limits for the Point Source Catalog/Archive are based on assuming a reliability of for the Point Source Catalog and is based on simulations. Limits may change after observing strategy validation period. | 180ddDiffuse source saturation limit for GLIMPSE/IRAC bands in units of MJy/sr can be obtained by multiplying the point source number (in mJy) by , where is the number of pixels in the point source PSF. for Band 1 and decreases to 7.0 for Band 4. | 0.237 | 0.047 | 0.058 |
| GLIMPSE/IRAC 2 | 4.49 | 0.88 | 183 | 0.2 bb5 sensitivity for a 4 second integration using IRAC. | 0.7–1.5ccFlux limits for the Point Source Catalog/Archive are based on assuming a reliability of for the Point Source Catalog and is based on simulations. Limits may change after observing strategy validation period. | 190ddDiffuse source saturation limit for GLIMPSE/IRAC bands in units of MJy/sr can be obtained by multiplying the point source number (in mJy) by , where is the number of pixels in the point source PSF. for Band 1 and decreases to 7.0 for Band 4. | 0.153 | 0.030 | 0.053 |
| GLIMPSE/IRAC 3 | 5.66 | 1.32 | 131 | 0.4 bb5 sensitivity for a 4 second integration using IRAC. | 1.0–2.0ccFlux limits for the Point Source Catalog/Archive are based on assuming a reliability of for the Point Source Catalog and is based on simulations. Limits may change after observing strategy validation period. | 570ddDiffuse source saturation limit for GLIMPSE/IRAC bands in units of MJy/sr can be obtained by multiplying the point source number (in mJy) by , where is the number of pixels in the point source PSF. for Band 1 and decreases to 7.0 for Band 4. | 0.103 | 0.020 | 0.053 |
| GLIMPSE/IRAC 4 | 7.84 | 2.40 | 71 | 0.4 bb5 sensitivity for a 4 second integration using IRAC. | 1.2–2.5ccFlux limits for the Point Source Catalog/Archive are based on assuming a reliability of for the Point Source Catalog and is based on simulations. Limits may change after observing strategy validation period. | 470ddDiffuse source saturation limit for GLIMPSE/IRAC bands in units of MJy/sr can be obtained by multiplying the point source number (in mJy) by , where is the number of pixels in the point source PSF. for Band 1 and decreases to 7.0 for Band 4. | 0.161 | 0.032 | 0.053 |
| MSX/Band A | 8.28 | 3.36 | 58 | 30 | 60 | 400000 | 0.022 | 0.044 | 0.053 |
| Survey | Wavebands | Resolution | Coverage | Sensitivity | Website |
|---|---|---|---|---|---|
| () | () | ||||
| GLIMPSE | 3.6,4.5,5.8,8.0 | -, | 0.2,0.2,0.4,0.4 mJyaaBest effort limit for sources in the GLIMPSE Point-Source Archive; the GLIMPSE Point-Source Catalog will contain only sources at about the 20 level to insure high reliability. | www.astro.wisc.edu/glimpse | |
| 2MASS | 1.22,1.65,2.16 | 2 | all-sky | 0.4,0.5,0.6 mJy | www.ipac.caltech.edu/2mass |
| DENIS | 0.97,1.22,2.16 | 1-3 | to | 0.2,0.8,2.8 mJy | cdsweb.u-strasbg.fr/denis.html |
| MSX | 4.1,8.3,12,14,21 | 18.3 | -, | 10000,100,1100,900,200 mJy | www.ipac.caltech.edu/ipac/msx |
| ISOGAL | 7,15 | 6 | ,bbSurvey contained only selected fields in this region, totaling 16 square degrees. | 15,10 mJy | www-isogal.iap.fr/ |
| IRAS | 12,24,60,100 | 25–100 | all-sky | 350,650,850,3000 mJy | irsa.ipac.caltech.edu/IRASdocs |
| ASTRO-FccLaunch planned February 2004 | 8.5,20,62.5,80,155,175 | 5–44 | all-sky | 20-100 mJy | www.ir.isas.ac.jp |
| COBE/DIRBEddDIRBE photometric bands are 1.25, 2.2, 3.5, 4.9, 12, 25, 60, 100, 140, and 240 m. We report the diffuse flux sensitivity rather than point source sensitivity due to the large beam size. | 1.25–240 | all-sky | 0.01-1.0 | space.gsfc.nasa.gov/astro/cobe/ |