A Multiwavelength study of NLS1s galaxies from the Second Byurakan Survey
Abstract
In this work we present a multiwavelength study of narrow-line Seyfert 1 galaxies (NLS1s) discovered in the Second Byurakan Survey (SBS). The sample consists of 26 objects, which have , or , and . For these objects, we present accurate coordinates, magnitudes, redshifts and the identification of optical objects with X-ray, IR and radio sources. Several galaxies are identified as X-ray or radio sources for the first time. We also report spectroscopic and photometric data, the spectral energy distribution, indices and other data. Our study shows that SBS NLS1s are strong or moderately strong soft X-ray sources with . Soft X-ray luminous sources in our sample do not tend to be luminous in the infrared. All SBS NLS1s are radio quiet objects (), and 52% of them are strong FeII emitters (FeII4570/H). The traditional linear correlation and , which seems to hold for AGN in ge
neral, is found for SBS NLS1s. An anticorrelation between FWHM of and the ratio of FeII4570/H is also observed. A weak correlation is found between slope and . One of our main findings is that almost all SBS NLS1s may not have a FIR bump. Their SED suggest that they may also possess a BBB. The absence of IR bump in most of SBS NLS1s and the weakness of X-ray radiation in some of them, may argue against the presence of a BLR. The surface density of SBS NLS1s is 0.015 per ().
1 Introduction
In 1985 Narrow Line Seyfert 1 galaxies (NLS1s) were a relatively rare and peculiar subclass of Seyfert (Sy) galaxies. NLS1s are defined as those AGN that have an FWHM(Hβ) 2000 km s-1 and [OIII]/H flux ratio less than 3.0. The formal spectral classification criteria for NLS1s galaxies is based on (a) the presence of narrow permitted lines only slightly broader than the forbidden ones. (b) the ratio [OIII]/H. However, exceptions are allowed if there are also strong [FeVII] and [FeX] emission lines, unlike to what is seen in Seyfert 2 galaxies. (c) . The first two criteria are from Osterbrock & Pogge (1985) original classification, while the maximum line-width criterion was introduced by Goodrich (1989).
The properties of NLS1s are discussed by a number of authors: Osterbrock (1977), Osterbrock & Pogge (1987), de Grijp et al. (1992), Bade et al. (1995), Moran et al. (1996), Greiner et al. (1996), Wisotzki & Bade (1997), Grupe et al. (1998, 1999), Xu et al. (1999), Pietsch et al. (2000), etc). The 10-th edition of the Veron-Cetty & Veron catalogue (2001) contains data of about 150 NLS1s. Around 300 objects with published data formally might be called NLS1s. A group of 83 NLS1s was compiled from the literature by Veron-Cetty et al. (2001). They revised the bright part (, ) of the NLS1s sample. High quality spectra were obtained and a relatively large sample of 59 NLS1s was compiled. Many objects which we would consider today to be NLS1s were not classified as such in previous works, also some objects were misclassified as NLS1s. This is largely due to the fact that little effort has been made in providing a set of high-quality and high-resolution optical spectroscopic data. Spectra do not have enough resolution to separate unambiguously the broad and narrow components of the Balmer lines. In addition, the presence of strong FeII lines makes it difficult to measure H. Previous observations did not cover the entire wavelength range needed to study the optical emission lines, therefore their fluxes are still unknown. For a correct classification of the objects with complex broad Balmer emission lines, it is also important to decompose the H and H emission lines into their narrow and broad components in order to study the narrow-line (NLR) and the broad-line region (BLR) emission ratios in NLS1s and broad line Seyfert 1 galaxies (BLSy1s, Veron et al. 2001). Emission line ratios from the NLR of NLS1s are different from those observed in Sy galaxies, i.e. [OIII]/H, and [OIII]/H are typical ratios for the NLR of Sy2 galaxies.
The first sample that showed that NLS1s appear enhanced in X-ray selected samples was the EINSTEIN AGN sample of Stephens (1989). With the ROSAT All-Sky Survey (Voges 1999) it became possible to study large samples of AGN. The ROSAT/IRAS sample of 222 AGN was investigated by Boller et al. (1992). Bade et al. (1995) presented the data for 283 AGN from RASS. The samples are dominated by X-ray bright (count rate cts ) AGN. Soft X-ray properties for a sample of 31 NLS1s were investigated by Boller et al. (1996). Soft X-ray properties of AGN from optical and infrared samples were investigated by Rush et al. (1996). Moran et al. (1996) investigated the properties of the IRAS/ROSAT sample of AGN. Warm IRAS properties of 221 AGN were investigated by de Grijp et al. (1992) and Keel et al. (1994). Soft X-ray properties of 76 ROSAT AGN were investigated by Grupe et al. (1998,1999). The UV properties of the NLS1 I Zw1 were investigated by Laor et al. (1997). ASCA observations of two NLS1s were presented by Gallagher et al. (2001). Radio observations of a few NLS1s were presented by Ulvestad et al. (1995), Siebert et al. (1999) and Moran (2000). ISO (Infrared Space Observatory) observations () of four NLS1s are presented by Poletta & Courvoisier (2000).
Recent studies of QSOs with ROSAT, suggest the existence of a significant population of soft X-ray weak QSOs where the soft X-ray flux is times smaller than in typical QSOs (Brandt et al. 2000). X-ray weak AGN were first detected with Einstein (see Elvis & Fabiano 1984). ROSAT extended these studies and identified a significant population of AGN notably faint in the soft X-ray relative to their optical fluxes ().
The proportion of NLS1s among Sy1s is still a subject of debate. It varied from 4% to 50% in different samples of AGN (de Grijp et al. 1992). A proportion of 10% was obtained from a medium hard (0.8-3.5 keV) X-ray selected sample of 65 AGN by Stephens (1989). About half of the AGN in the soft X-ray selected samples of Grupe et al. (1999) and Edelson et al. (1999) are NLS1s. A proportion of 20-30%, irrespective of the selection method, was found by Engels & Keil (2000). This last value is often used to estimate the opening angle of NLS1s in the framework of the unified models. For example, Taniguchi et al. (1999) prefer to use the Stephens value, which yields an opening angle of 10∘, because soft X-ray selected samples tend to miss obscured AGN, but hard X-ray, radio or optical surveys are more useful for statistical analysis.
There are no distinct physical boundaries between NLS1s and BLSy1. Since 1985, several questions related to the NLS1s have been posed and remain unanswered: Are they the continuation of Sy1 class towards extreme properties? Are they accreting mass at nearly the Eddington accretion rate? Do they have smaller black hole masses compared to normal Sy galaxies? Are they Sy1 galaxies in their early stages of evolution? We are still far from having an accurate description of the main properties of NLS1s (Bade et al. 1995, Moran et al. 1996, Grupe et al. 1998, 1999, Xu et al. 1999, Veron-Cetty et al. 2001).
Studies of NLS1s based on optically bright, strong X-ray and IR luminous selected samples, show that they are objects with (1)“narrow” broad emission lines, (2) strong optical FeII and weak [OIII] lines, (3) a very steep soft X-ray spectra (Laor et al. 1994,1997, Boller et al. 1996) together with higher soft X-ray luminosities and (4) strong IR emitters (Halpern and Oke 1987; Moran et al. 1996; Lipari 1994). NLS1s are found to be AGN with extreme properties: they show the steepest X-ray spectra, the strongest FeII emission and the lowest emission from the NLR. Furthermore, they are more variable in X-ray and have stronger FeII emission than BLS1s. NLS1s are found to be radio quiet objects with compact radio sources in their central ( pc) zone. Mid and far-infrared properties were found similar to those of BLS1s. A summary of selected important observational properties of NLS1s in the optical, UV, soft and hard X-ray, radio and infrared, was presented by Taniguchi et al. (1999). Recent data on weak soft X-ray sources and radio-loud NLS1s, and new data111Recently, Rick Williams, Dick Pogge and Smita Mathur published a sample of 150 SLOAN NLS1s (astro-ph/0208211). This sample confirms the presence of NLS1s which are not X-ray sources, which is part of the results founded within our SBS NLS1s sample. Obviously, the SLOAN NLS1s sample expanded the investigation of NLS1s to a fainter limit. We will analyze the SLOAN NLS1s sample and also other NLS1s samples and present our results in a separate paper. may significantly change their characterization.
Weak X-ray NLS1s have not yet been studied in detail, nor homogeneously. A few dozen of them were classified in optical samples of AGN, a dozen were found among radio and infrared sources, and a relatively large fraction of NLS1s was found among the soft X-ray ROSAT sources. Therefore, the question is if the obtained results are a consequence of using inadequate samples. We will show below, that some results are indeed sample dependent.
Multiwavelength investigations of NLS1s are relatively poor due to the difficulty in building a representative multiwavelength complete sample of NLS1s. Building this sample requires a representative multiwavelength complete sample of AGN. AGN are predominantly selected in optical (single waveband) surveys, commonly due to their UV excess (UVX, First Byurakan Survey, Markarian 1967; Second Byurakan Survey [SBS], Markarian & Stepanian 1983); Bright Quasar Survey, Schmidt & Green 1983; Large Bright Quasar Survey, Hewett, Foltz & Chafee 1995; etc). In general optical surveys do not miss any UVX AGN. The radio surveys of AGN are largely free from color bias. Hard X-ray emission is relatively unaffected by absorption, while the soft X-ray surveys are strongly affected by it. Multiwavelength observation of AGN over the past decade led to fundamental improvements in our understanding of the energy generation mechanisms in these objects. AGN are multi-wavelength emitters, with roughly equal energy output extending from the FIR through to the X-ray region. Single waveband studies cannot discriminate the general properties of the parent population of NLS1s (or other types of AGN). Of course the combination of the X-ray, optical, FIR, radio and other waveband surveys in the same sky area may produce a more complete sample of AGN. Such a sample in principle may answer the question of the proportion oNLS1s among the X-ray, optical, IRAS and radio selected AGN.
During the Second Byurakan survey a sample of 578 QSOs and AGN was spectroscopically confirmed (Stepanian 1994; Stepanian & Chavushyan 2003). In this paper we present a multiwavelength study of the NLS1s sample (26 objects) extracted from the SBS survey, which is homogeneous in a limited sky area.
2 The SBS NLS1s
To isolate the NLS1s sample from the SBS general sample of AGN (Stepanian 1994; Stepanian & Chavushyan 2003) we formally follow the two optical spectroscopic criteria described above. Among the 578 AGN from the SBS, showed “narrow” emission lines and emission line properties which satisfy the NLS1s criteria. The magnitudes, redshifts and luminosity intervals of these objects correspond to the following values: , , .
To be consistent with the optical definition for QSOs and Sy galaxies (Schmidt & Green 1983), we formally divided our original sample into two sub-samples in terms of their optical luminosity. The first one with () is called the NLS1s sample. The second one with (), is the narrow-line QSOs sample (NLQSOs).
In this paper, we will present only the study of the NLS1s sample from the SBS (hereafter SBS NLS1s). The multiwavelength data and the corresponding study of SBS NLQSOs will be discussed in a forthcoming paper.
2.1 The sample of SBS NLS1s galaxies
The SBS catalogue contains 26 NLS1s galaxies. In Table 1 we present the basic data for this sample as follows: Col. (1) SBS designation (equinox B1950), according to the IAU nomenclature; columns (2) and (3) J2000.0 coordinates from Bicay et al. (2000), their accuracy is 1″; column (4) 1RXSJ designation according to Voges et al. (1999); columns (5) and (7) distance in arcsec of the ROSAT and radio sources from the SBS optical objects, for some objects according to Schwope et al.(2000), Bauer et al. (2000) and Bade et al.(1995); column (6) FIRST (Faint Images of the Radio Sky at Twenty cm) or NVSS (NRAO VLA Sky Survey) designation according to Becker et al. (1995) and Bauer at al. (2000); column (8) near infrared data, according to the Nasa Extragalactic Database [NED]; column (9) the optical major and minor axis in arcsec; columns (10) and (11) rough estimates of FeII strength complexes, 4570 and 5100, classified as w (weak), s (strong), and vs (very strong); column (12) other name; and column (13) references.
We find useful to present in Table 1 the estimation of the strength of FeII complexes 4570 and 5100. The emission lines of FeII consist of hundreds of energy levels in many multiplets, which make them very complex. Boroson & Green (1992) and Bade et al. (1995) have tried to quantify the strength of the FeII emission by measuring the equivalent widths of two FeII blends between 4400-4680 Å (Boroson & Green used the wavebands 4434-4684 Å ) and 5100-5500 Å. These estimates introduce errors because HeII4686 Å is also present in this blend. Nevertheless, we will use this estimate to quantify the strength of the FeII emission in our sample.
2.2 Identification
In this section we discuss the cross identification of optical SBS sources with sources at different wavelengths. To identify an object as a candidate source for ROSAT, IRAS or radio we have used the distance between optical position from the SBS and the source positions found in the other surveys. Each SBS object has an accurate measured coordinate (″) and we defined these coordinates as the central position. Then, the X-ray, IRAS and radio positions were used to calculate the distance of these sources from the optical position.
All objects were identified with 1RXSJ sources (Voges et al. 1999, 2000), except four: SBS 0924+495, SBS1136+595, SBS 1509+522 and Mkn 486(1535+547), while Mkn 124, SBS 0952+522, SBS 1359+536, and SBS 1406+540 were identified as RASS faint sources (Voges et al. 2000). Many of them are identified here as 1RXSJ sources for the first time. Objects identified as X-ray sources have their position coincident with the optical SBS objects, i.e. within ″.
Only one object, Mkn 110 (0921+525), was identified as an IRAS source (F09213+5232). The difference in distance between the optical and IRAS position is 19″.
Nine objects were identified as radio sources, eight of them are FIRST sources. All FIRST sources have a position coincident by less than 1″. SBS 1315+604 was identified as NVSS source by Bauer et al. (2000) with a position difference of 16″.
The galaxy SBS 1213+549A was misidentified by Boller et al. (1992), Moran et al. (1996) and by Condon et al. (1998) as MCG09-20-133, and as an IRAS source. The same mistake is included in other databases and the catalogue of Veron-Cetty & Veron (2001). This misidentification is understandable because there are three different galaxies in this field: SBS 1213+549A, MCG 09-20-133 and SBS 1213+549B (MCG 09-20-134).
A cross-identification is presented in Table 2. The IRAS, ROSAT, optical, and radio positions for the B1950 and J2000 epochs, according to Saunders et al. (2000), Voges et al. (1999), Becker et al. (1995), Condon et al. (1998a, 1998b), Moran et al. (1996) and Boller et al. (1992) are presented for SBS 1213+549 A and MCG 09-20-133. The difference in coordinates between the ROSAT (1RXSJ121549.3+544227) and the optical SBS 1213+549A source is 3″; between the optical and radio source (FIRSTJ121549.4+544223) is less than . The difference between the IRAS and SBS 1213+549 A coordinates is 42″. The difference in coordinates of IRAS and the other galaxy, in the same field of MCG 09-12-133 is 17″. Therefore, SBS 1213+549A is more likely to be a ROSAT and FIRST source, which was certainly not detected by IRAS. We think that MCG 09-20-133 might be the IRAS 12134+5459 source, and that it probably is not a ROSAT nor a FIRST source, but is more likely to be a NVSS source.
In Bade et al. (1995), 68% of the RASS/IRAS sources were found within 20″. Moran et al. (1996) find that 70% of the optical counterparts of RASS sources lie within 20″of the RASS X-ray position. In our sample, all SBS NLS1s have a distance coincidence with RASS sources less than 19″. This gives us a reliable identification of the objects, which will be useful for further statistical investigation of their multiband properties.
3 Spectra and Classification
3.1 Classification
The objects presented in Table 1 were originally classified as Sy1, Sy1.5, Sy1.8, Sy1.9 or Sy2 in previous works, e.g. see NED. Five of them (Mkn 110, Mkn 124, Mkn 142, Mkn 486, SBS 1213+549A) were classified as NLS1s by Osterbrock & Pogge (1987), Martel & Osterbrock (1994), Veron et al. (2001) and Moran et al. (1996). Our spectroscopic observations of 26 objects presented below have shown that according to the km and [OIII]/H criteria, these objects are NLS1s.
3.2 Observations
The spectroscopic observations of the SBS sample were carried out with the 6 m telescope of the Special Astrophysical Observatory (SAO, Russia). The SP-124 spectrograph, equipped with a 1024-channel image photon counting system (IPCS) (Drabek et al. 1986)was used, installed in the Nasmyth focus of the telescope, and also a spectrograph equipped with a pixel CCD (Afanas’ev et al. 1995), installed at the prime focus. The instrumental spectral resolution is Å, in the wavelength interval 3500-7200 Å. Another set of data was collected with 2.1 m telescope of the Guillermo Haro Observatory (GHO) located at Cananea, Sonora (México). We used the LFOSC spectrophotometer installed in the Cassegrain focus (Zickcraf et al. 1997), equipped with a pixel CCD, which gave us an effective instrumental spectral resolution of Å, in the wavelength interval 4000-9000 Å. A new set of spectroscopic observations were carried out both at GHO and also at the Observatorio Astronómico Nacional in San Pedro Mártir (México) with the 2.1 m telescope. A high signal-to-noise ratio () and better spectral resolution of ( Å) in the waveband 3700-8300 Å, allow us to confirm the previous spectral classification.
The emission line parameters (EW, FWHM, emission line ratio) were determined using the spectral analysis software package developed by V. V. Vlasyuk (1995, private communication) at the Special Astrophysical Observatory. The fluxes and equivalent widths of two FeII blends were measured between 4400-4680 Åand 5100-5500 Å. The data are not corrected for reddening. For our measurement the instrumental broadening corrected value is given (i.e. by subtraction of the night sky profiles).
The results of the spectroscopic observations of SBS NLS1s are presented in Table 3. Data collected from the literature is presented as well. Columns are as follows: (1) SBS designation; (2) to (9) EW and the FWHM of H, H, H, and [OIII]5007, respectively; (10) and (11) EW of FeII4570=F(4434-4684) or F(4500-4680) if the data are taken from Bade et al. (1995) and FeII5100=F(5100-5500); (12) range of the FWHM of H according to Veron et al. (2001); (13) references. The observed EW as well as FWHM in Table 3 have been corrected to z=0, i.e. .
The corresponding data of the emission line ratio are summarized in Table 4; the columns are as follows: (1) is the SBS designation; (2) [OIII]5007/H; (3) H/H; (4) FeII4570/[OIII]; (5) and (6) references. The uncertainty in the intensity ratios for strong emission lines reported here is about 25% (for our observations), and for data obtained in the literature.
4 The multiwavelength data
Since we believe that in order to deal properly with multiwavelength data, authors should present their definitions, conversion factors and calculations, we include them in this section. We have adopted: , . ROSAT fluxes are in units of erg , IRAS fluxes are in Jy, radio fluxes S(R), in mJy. The luminosity for all bands , , , is given in common units of .
The luminosity in each band was calculated according to the expression: , where are the fluxes in optical, X-ray, radio and FIR bands and is the distance of the object given by the expression:
| (1) |
For , and .
Table 5 contains the multiwavelength data in X-ray, optical and radio regions for SBS NLS1s sample: column (1) SBS designation; column (2) redshift, derived from the mean value of the redshifts of the strongest emission lines; column (3) B magnitudes with two decimals have an accuracy of , while the others have ; column (4) absolute magnitude , defined by = B - 5 + - 43.89, we used = -0.7 for the K correction, which is negligible for low redshift objects; column (5) the = 53.03 - 0.4 B + 2; column (6) X-ray counts according to Voges et al. (1999); column (7) is the X-ray flux density according to Voges et al. (1999; 2000), the units are ; column (8) of the monochromatic flux densities at 2 keV in ; column (9) of the soft X-ray luminosity, = 57.63 + + ; column (10) the radio flux density at 1.4 GHz (20 cm), the peak intensity value in mJy according to Becker et al. (1995) and Bauer et al. (2000); column (11) at 1.4 GHz, given by = 40.78 + ; column (12) = Å)]= 0.4B + 1.52 + , calculated for the ROSAT soft energy band 0.05 – 2.4 keV., and = -0.5, according to the equation [1] of Schmidt & Green (1986); and column (13) = 0.372 Å)] the slope of a power law defined by the rest-frame flux densities at 3000 Å and 2 keV (Brandt et al. 2000).
Our blue magnitudes were converted to monochromatic flux densities at 3000 Å and are calculated according to Schmidt & Green (1986):
| (2) |
In all cases, B is the magnitude at 4400 Å.
Monochromatic flux densities at 2 keV, are derived from the fluxes (0.05, 2.4 keV) according to Schmidt & Green (1986);
| (3) |
The monochromatic fluxes in the optical band at 4400 Å, are calculated according to Allen (1976);
| (4) |
The units in equations (3) and (4) are erg .
For 10 objects of Table 5, the multivawelength data in different wavebands are presented also in de Grijp et al. (1992), Bade et al. (1995), Boller et al. (1996), Moran et al. (1996), Rush et al. (1996) and Brandt et al. (2000). In all of them, optical and X-ray fluxes and luminosities, and indices differ from each other, because of the difference in magnitudes, redshifts, count rates and other parameters used. We have used in Table 5 our original measurement of redshifts and B magnitudes. The soft X-ray count rates, ROSAT and radio fluxes were taken from the last version of original catalogues, Becker et al. (1995) and Voges et al. (1999). For four objects, we used data from the ROSAT faint source catalogue (Voges et al. 2000), marked with an asterisk.
Note that in Table 5, the absolute magnitude was used to isolate the SBS NLS1s sample, this value corresponds to the optical luminosity 44.70 erg s-1, which is our formal division limit to discriminate between NLS1s and NLQSOs by luminosity.
In Table 6 we show the following data for Mkn 124, IRASF09213+5232 source, with column (1) the SBS designation; columns (2), (4), (6), (8) the IRAS fluxes at 12, 25, 60 and 100 m in Jy; columns (3), (5), (7), (9) the quality of detection, where 1- upper limit, 2 - medium, 3 - high quality detection; columns (10), (11), (12) the FIR colors, i.e. the logarithms of the FIR flux ratios; column (13) , where = 1.26 with FIR fluxes in , according to Bicay et al. (1995); column (14) = 27.051 + 2 [z(1+z/2)] + ; and column (15) .
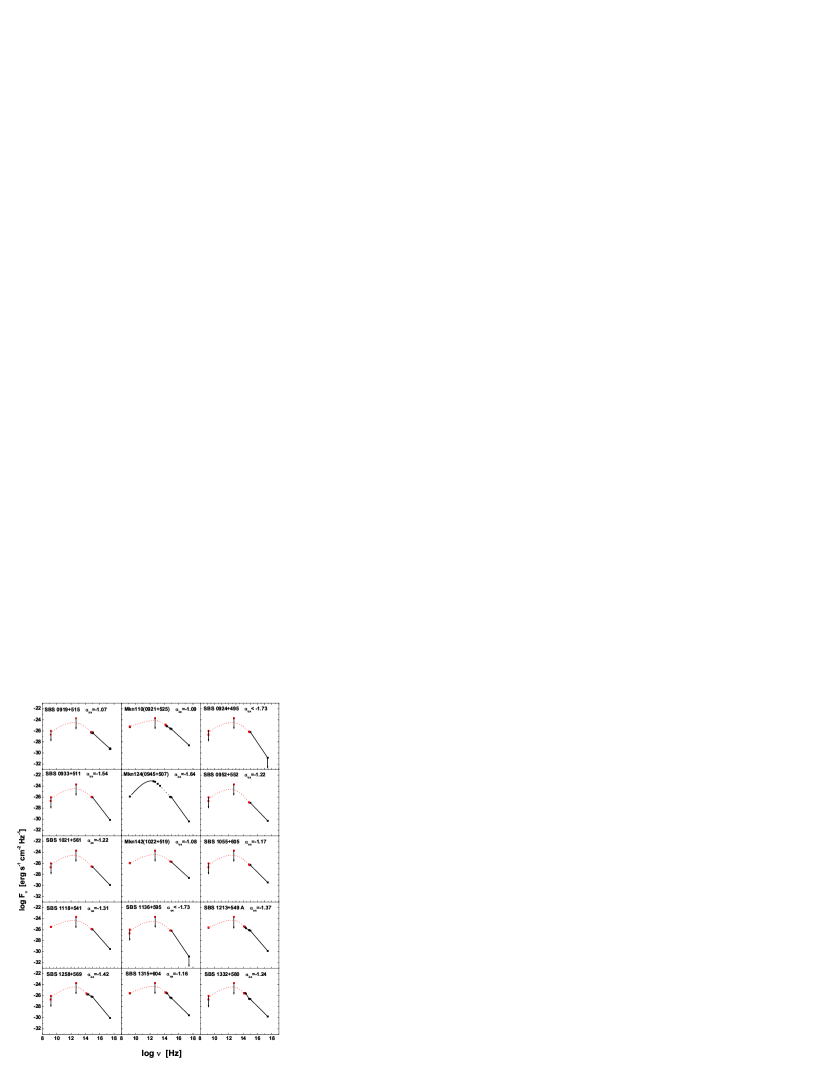
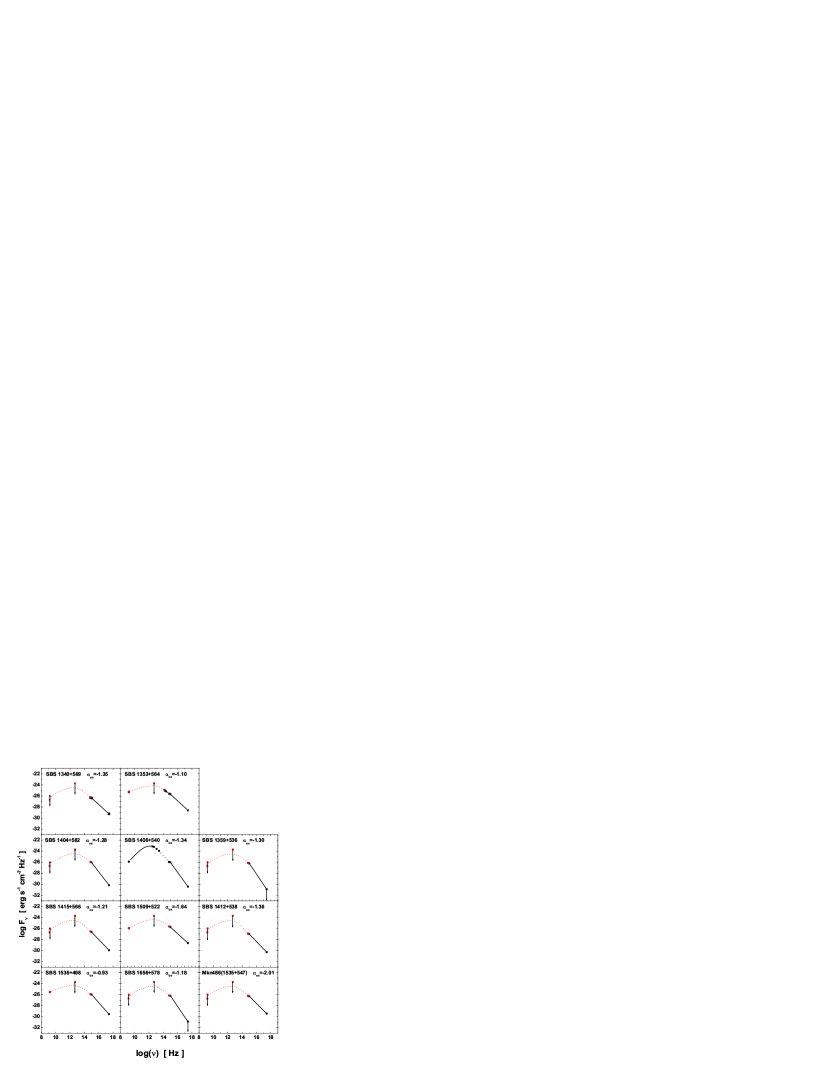
The redshift distribution of SBS NLS1s is shown in Figure1. The optical spectra of 13 SBS NLS1s is given in Figures 2a and 2b, since these objects lack previous spectroscopic observations. The optical spectra of Mkn 110, Mkn 124, Mkn 142, Mkn 486, SBS 1213+549A and some others, obtained in different wavebands with different spectral resolution, might be found in Osterbrock (1977), de Robertis (1985), Stephens et al. (1989), Boroson & Green (1992), de Grijp et al. (1992), Martel & Osterbrock (1994), Bade et al. (1995), Moran et al. (1996), Grupe et al. (1999) and Veron et al. (2001). We present the relevant properties of the SBS NLS1s galaxies in section 5.
5 Results
5.1 Continuum and emission line correlations
Principal Component Analysis (PCA) is a valuable tool to study the relationship between several variables. Unfortunately, PCA is not reliable for the SBS NLS1s sample presented in this paper, because of the small number of objects. Furthermore, the missing and upper limits values in the sample reduce even more the available number of objects when several important variables are taken into account for the analysis. Thus, we have compared 13 of the variables included in Tables 3, 4 and 5, in groups of two yielding a total of 78 comparisons. For such a large group of comparisons, we expect to obtain around 4 spurious correlations at the 0.05 level of significance. Table 7 shows the relevant correlations at this level. The 13 correlations listed involve 12 out of the 13 variables considered. Column (1) in Table 7 assigns a number for each comparison of variables; column (2) lists the variables compared; column (3) indicates the number of objects involved in the comparison; column (4) shows the probability that the correlation or anticorrelation obtained has been drawn by chance from unrelated variables; and column (5) indicates the correlation coefficient for each pair of variables.
A few patterns may be drawn from Table 7. Comparisons 1 to 4 and 7 involve either EW of H or FWHM of H, or both. Variables EW of H and FWHM of H seem to measure the H power (Boroson & Green 1992, eigenvector 1), as can be inferred from the anticorrelations of both variables with FeII/H. Furthermore, anticorrelations 3 (presented in Figure3), 4, and 5 (and probably 2 and 7), and correlations 6, 8, 9, and 13 (and probably 10) are related with Boroson & Green’s eigenvector 1. However, when using radio luminosities we are restricted to 10 objects, so these have to be taken cautiously. This is evident for correlation 9, where the objects with the largest [OIII]/H ratios (SBS 1340+569 and SBS 1353+564) have not been radio detected.
Correlations 8 and 12 are associated with continuum emission from the AGN, and probably indicate related mechanisms for the energy production. Correlation 13 indicates that variables and measure the X-ray power. In the same way, correlation 11 shows that variables and measure radio power.
Relations between line ratios are considered in comparisons 5 and 6. Anticorrelation 5 is produced because of the different place (numerator and denominator) of the [OIII] flux in the line ratios involved. A similar explanation is also valid for correlation 6, where FeII is in the same place for both line ratios. The fact that the ratio FeII/[OIII] is involved in comparisons 5 and 6 reflects that this line ratio is linearly dependent on the other two line ratios: FeII/[OIII] = (FeII/H /([OIII]/H. A correlation between [OIII]/H and FeII/H would also be expected for analogous reasons (H power dividing [OIII] and FeII powers in both cases), but the [OIII]/H condition imposed in the selection of the NLS1s sample hides this correlation.
5.2 X-ray and optical (B) continuum correlation
In Figure4 we present the diagram of optical versus X-ray luminosity for the total and restricted by magnitude 222The mag. limit means that only the members of the complete sample of SBS NLS1s were considered. (shaded squares) sample of SBS NLS1s. A diagram showing as a function of is shown in Figure5. In all cases, four objects not detected in soft X-ray band were excluded and are marked be arrows in Figure4 and 5.
A strong linear correlation between X-ray and optical luminosity is seen for SBS NLS1s detected in X-ray. From the data plotted in Figure 3, we obtained the following results after applying a linear regression fit:
| (5) |
with r=0.77 and N=14.
We note that a similar correlation was found by Boller et al. (1992), =1.59 - 29.24, r= 0.72) for 20 X-ray bright AGN from the ROSAT/IRAS survey (this sample contains a mixture of different types of Sy galaxies).
A correlation - seems to hold for AGN in general (La Franca et al. 1995). It is believed that hard X-ray emission is reprocessed into the soft X-ray-to-optical range by cold dense clouds. The correlation between X-ray and optical luminosities suggest that the mechanisms producing soft X-ray and optical emission are strongly related.
The dependence of of AGN on redshift, optical and radio luminosity has been extensively discussed in the literature. Trends in the spectral shape have been investigated by Schmidt & Green (1986), for a sample of 53 Bright Quasar X-ray Sample (BQX) QSOs(). They found that increases toward fainter optical absolute magnitudes, down to = -23.0, with increasing scatter. Boller et al. (1992), confirm the result obtained by Schmidt & Green for QSOs, finding a linear correlation between and , with slope , and correlation coefficient r=0.47.
We studied the relation between and for both the total and 17.5 sample of SBS NLS1s. The sample of SBS NLS1s does not show the correlation between and in a luminosity range -19.0-23.0, = 0.1, r=0.07. A similar result was found by Boller et al. (1992): = 0.02, r=0.04. If the sample of SBS NLS1s () is added to the sample of QSOs of Schmidt & Green (1986), then their trend, i.e. the increasing of the spread of , might be continued up to the optical luminosity of = -19.0 (see Figure5).
The correlation between and needs further detailed investigation since it is used to describe the spectral behavior of extragalactic objects. vs. or statistics as a function of optical luminosity, are useful for the modelling AGN number counts, to predict the X-ray quasar counts and to estimate the X-ray background in the Universe.
The mean value of is for SBS NLS1s including the limiting value estimate, and -3.43 only for detected sources. The mean value of for 143 AGN (119 of them are Sy1s) determined by Boller et al.(1992) is . Thus, this means that SBS NLS1s are either much weaker soft X-ray sources, or optically more luminous objects than the ROSAT AGN investigated in Boller et al. (1992).
5.3 Spectral energy distribution (SED) and slope
Spectral energy distribution (SED) studies of AGN increased rapidly in the past decade. Nevertheless, there are very limited data in the radio, FIR, sub-mm, extreme UV and ray regions. The FIRST, NVSS and ROSAT surveys provided data in radio and soft X-ray regions, the ISO (Infrared Space Observatory), SIRTF (Space Infrared Telescope Facility) and SCUBA (Submm Common-User Bolometer) should provide new information in the IR and sub-mm regions. As a result, the SED of around a few hundred AGN are relatively well known but only a handful of the brightest and low-redshift sources have been observed simultaneously from -ray to radio (see Wilkes et al. 1999 and reference therein).
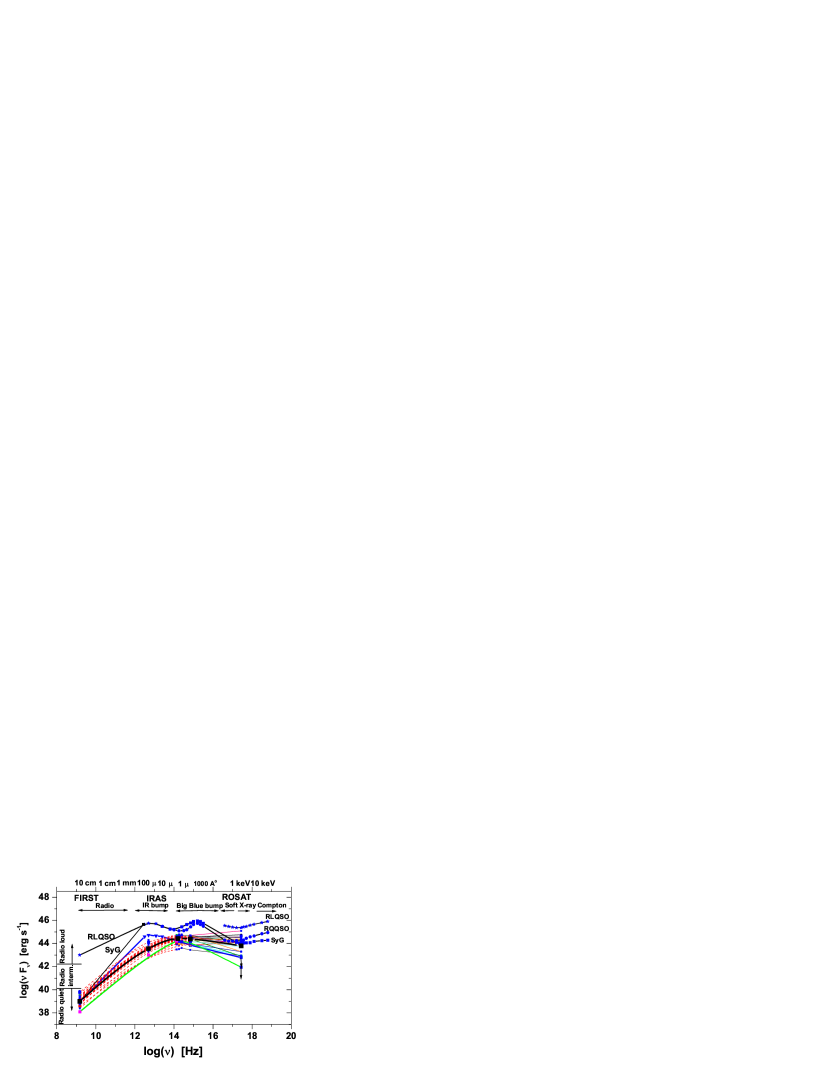
The standard SED of AGN, presented in Figure7b, typically shows bumps in the optical-UV and IR regions with an inflection point at m. The near-IR bump generally peaks at m decreasing rapidly towards the radio region. The second bump is the Big Blue Bump (BBB) that dominates the optical-UV emission (1000 - 3000 Å). The third feature is the soft X-ray excess (Boller et al. 1996), produced by the steepening of the X-ray spectra below 1 keV.
A well-established correlation between X-ray and optical emission in AGN shows that higher luminosity sources have relatively weak X-ray emission. A strong correlation was found between X-ray slope and the radio emission in core dominated sources. The radio-infrared emission correlation was found only for core dominated radio-loud AGN. A well established, strong linear relation was found between radio and IR emission in normal and starburst galaxies (Mass-Hesse 1992), which is generally interpreted as a combination of thermal emission from the dust heated by star formation and non-thermal emission from supernova remnants.
Typically, the optical and 1 keV region in AGN yields . In some AGN the optical spectrum is steeper than the optical-to- X-ray spectrum which is inconsistent with a single non-thermal continuum. Since the optical slopes are often much steeper than -1.3, the optical and X-ray continua are not necessary part of the same spectral component. In the 2-20 keV energy range the X-ray spectra of AGN are characterized by a hard power-law with an energy spectral slope -1.0. Below 1 keV increases indicating a soft X-ray excess.
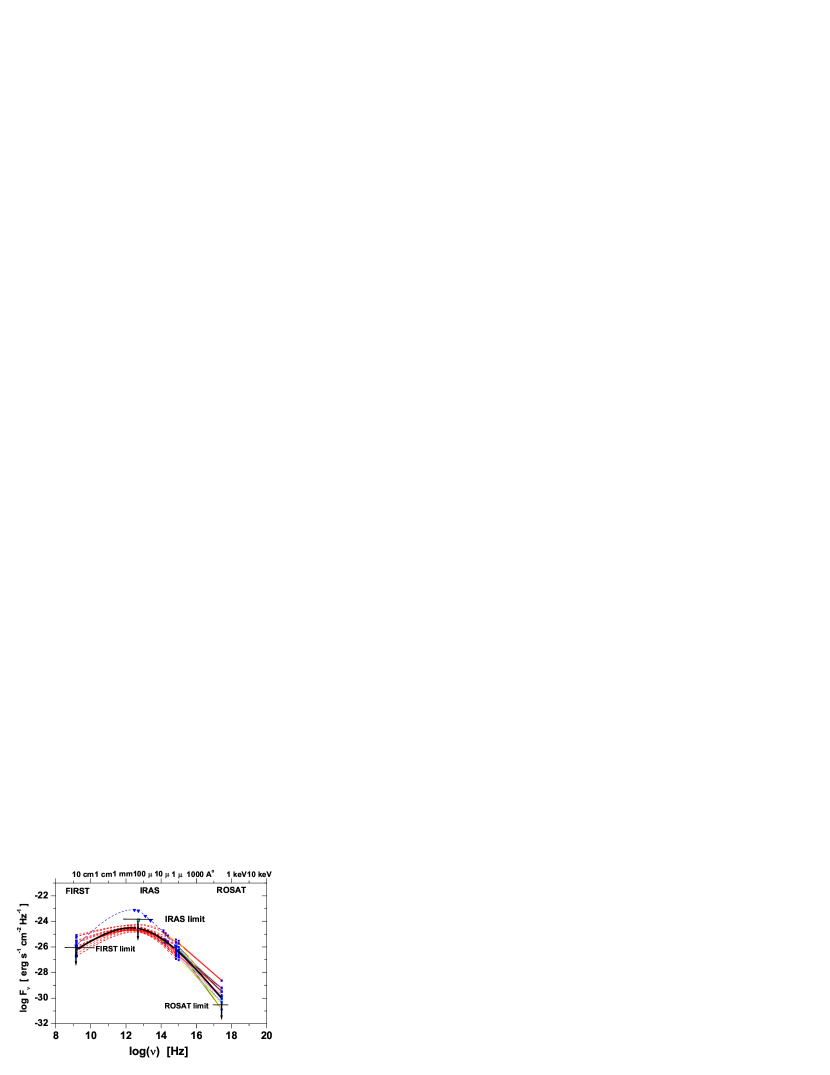
We have derived the spectral energy distributions for SBS NLS1s from the soft X-ray to radio, using the monochromatic luminosities , as well as the upper detection limit estimates to study their multiwavelength properties and to investigate whether the continuum emission is originated by the same mechanisms. In Fig 6a and 6b the SED for each object of our SBS NLS1s sample is shown. The composite SED is shown in Figure7a and 7b. In the infrared and radio regions, our data are insufficient to make a reliable conclusion about their SED behavior. The use of upper detection limits in IR or radio regions allow us to estimate a probable SED. The SED of typical radio-loud QSOs (RL QSO), radio-quiet QSOs (RQ QSO) and Seyfert galaxies (SyG) are shown in Figure7b for comparison.
We calculated , the slope of the power law defined by the rest-frame flux densities at 3000 Å and 2 keV for all SBS NLS1s. Results are presented in the last column of Table 5. A wide spread of indices () are observed for SBS NLS1s (see Figure7a and 7b). Sources not detected in soft X-ray show a very steep slope . This feature, along with the large luminosities involved (), partially agree with the characteristics of weak soft X-ray sources defined by Brand et al. (2000).
Three objects in our sample, Mkn 110, Mkn 124 and Mkn 486, were also studied by Brandt et al. (2000), who found equal to -1.41, -1.34 and -2.45, respectively. A large difference is found as compared to our data, which could be due to variability or a calculation difference. A possible explanation is that it may arise from flux calculations in the optical or X-rays (or both). A difference of 0.5 -1 in , results in a difference in of 0.2-0.4. For example, for Mkn 486 we have only an upper detection limit estimate , which is in agreement with Gallagher et al. (2001) result of . We think that this discrepancy is not a result of intrinsic variability, but it is more likely a result of differences in optical and 2 keV monochromatic flux density calculations.
We have used our value to examine correlations with other parameters tabulated in Tables 3 to 5. In these correlation analysis, we have excluded sources which were not detected in soft X-ray.
We find a weak correlation between and (see Figure8)for bright (, ) SBS NLS1s, in the form :
| (6) |
with r=0.35 and N=14. A similar result was obtained by Wilkes et al. (1994) and Wilkes (1999): = 0.11(0.02) - constant.
The existence of a relation between and has been discussed by a number of authors (Wilkes 1999 and references therein). Wilkes (1999) accepts a well-established correlation between X-ray and optical emission in AGN, such that higher luminosity sources have relatively weak X-ray emission, while other authors suggest that the relation is an artifact caused by an intrinsic dispersion in which is much larger than that in . La Franca et al. (1995) suggest that the relation is linear and that the discrepancy arise from photometric errors dominating the dispersion relation. However, Wilkes (1999) points out that in reality errors in are significantly smaller than the dispersion. For SBS NLS1s this relation in general is weak, but it seems even stronger than Wilkes’ result.
6 Discussion
A complete sample of QSOs and Sy galaxies of the SBS survey,() of was isolated and detailed investigated both spectroscopically and photometrically. This sample has been used in this work to investigate the multiwavelength properties of 26 SBS NLS1s.
An independent and direct evidence that the ROSAT sample of AGN contains only the brightest soft X-ray sources, comes from comparing SBS and ROSAT samples of AGN (Boller et al. 1992, 1996, Shwope et al. 2000). The compilation of the AGN ROSAT sample was done in the same way as the SBS optical survey: preliminary identification of the optical counterparts of X-ray sources on the objective prism spectra. A huge amount of optically bright, but soft X-ray relatively weak AGN, including NLS1s were not included in ROSAT sample of AGN. Obviously, objects which are below the detection limit of the ROSAT survey (four of which are studied in this paper) were not investigated either.
Soft X-ray (ROSAT 0.05-2.4 keV) region
SBS NLS1s detected in soft X-rays (22/26) are strong or relatively strong () sources. Most of them, 18/26 objects (69%), are ROSAT bright sources with count rates 0.05 cts , while four objects (15%) are identified as RASS faint sources with count rates 0.05 cts s-1. Twenty NLS1s have soft X-ray fluxes below 6 erg scm-2, and only Mkn 110 and Mkn 142 exceed this value, 23 and 20 erg s-1 cm-2, respectively.
As might be found from Table 5, the mean energy conversion factor for objects in the sky area covered by SBS is . From this value and following Bade et al. (1995), the count rate limit in ROSAT band (0.05-2.4 keV) of 0.01 cts corresponds to the ROSAT detection limit of erg . The corresponding luminosity upper limits for non detected sources in soft X-ray band are for SBS 0924+495 and SBS 1136+595, for SBS 1509+522 and for Mkn 486 (SBS 1535+547).
In spite of the absence of strong X-ray emission, SBS NLS1s not detected by ROSAT share all the typical properties of these kind of objects. This is puzzling since they could be intrinsically weak X-ray sources or highly absorbed.
Practically all known X-ray properties of NLS1s are based on samples drawn from the RASS Bright Source Catalogue. In those works no evidence was found for significant internal absorption on the majority of AGN (Boller et al. 1996). Similar results were obtained by Grupe et al. (1998), who studied a sample of 76 ROSAT Bright AGN (partially crossed with the Boller et al. sample). These results suggest that an explanation for the lack of soft X-ray detection in several SBS NLS1s could be that they are intrinsically weak X-ray sources below the detection limit of ROSAT survey.
However, recent studies by Brandt et al. (2000) and Gallagher et al. (2001) contradict this explanation. Brandt et al. (2000) have identified and studied the soft X-ray weak AGN population in the BQX optically selected sample of Boroson & Green (1992) of all PG QSO with , including a few NLS1s. They found that 11% of BQX QSOs are weak soft X-ray sources, which is similar to our results. ASCA observation of soft X-ray weak NLS1s, show that they are heavily X-ray absorbed objects. In general ASCA observations support the intrinsic absorption scenario for explaining soft X-ray weakness in AGN, particulary in the NLS1 Mkn 486. Weak soft X-ray SBS NLS1s are good candidates for ASCA observations.
One object in our sample, Mkn 486 has clear observational evidence of the presence of high intrinsic absorption. As was shown by Gallagher et al. (2001), Mkn 486 was not detected in the soft X-ray 0.05-2.0 keV band, only in the 0.1- 5 keV band. The source shows clear signs of high intrinsic absorption by , with only partial covering of the power-law continuum. The hard X-ray source has an ASCA photon index =. The central emission source is totally covered by neutral gas, therefore the low energy photons are completely absorbed there. The object has high optical continuum polarization (P=2.5%, Berman et al. 1990).
The SBS NLS1s sample is based on the identification of both RASS Bright and Faint sources. If we suppose that non detected SBS NLS1s in X-ray are objects like Mkn 486, it may mean that at least 15% of SBS NLS1s may have hidden AGN in their central zone, and would be detected in the optical (UVX, Markarian) and perhaps in other wavebands, but not in the soft X-ray region. The existence of a hidden AGN in the central zone of these galaxies may explain the weakness or absence of soft X-ray emission.
There is a number of arguments which has been used against a hidden AGN in NLS1s. One of the strongest arguments used is the steepness of the soft X-ray spectrum, which is interpreted as evidence that the central source is seen directly. The SED of NLS1s does not support the picture of hidden AGN (the SED of NLS1s is presume to be closer to that of Sy1 than to Sy2, the later been more likely a hidden AGN). We recall that the arguments against a hidden AGN are based on studies of the brightest X-ray sources.
In the SBS sample of NLS1s, non detected sources have a , which means that they are 10 to 50 times less luminous in soft X-rays relative to the bulk of NLS1s or ROSAT AGN. SBS NLS1s which were not detected in X-ray were also not detected neither as IRAS sources, nor as radio sources, except Mkn 486 which is the only radio-quiet AGN observed by Neugebauer & Mattews (1999).
Far-Infrared (IRAS ) region
All SBS NLS1s except Mkn 124 (SBS 0945+507) were not detected as IRAS sources. One of the natural explanations is that it is due to the flux limitation of IRAS survey (see the redshift distribution of IRAS sources, Saunders et al. 2000), which is perhaps true for high and intermediate redshift objects. Among the nearby objects with 0.055, only Mkn 124, was detected by IRAS. This object is a Luminous Infrared Galaxy (LIG,) and also the weakest soft X-ray source in our sample. Mkn 124 is a rare case, which combines high far-infrared luminosity (=44.65) with low X-ray luminosity (=42.8). In Boller et al. (1992), none of the objects combines a high far-infrared with a low X-ray luminosities.
The limiting flux in the FIR is 0.5 Jy at m and 0.8-1.0 Jy at 100 m (IRAS PSC, Boller et al. 1996), and 2.5 times less for IRAS faint sources, 0.2 Jy at 60 m and 0.35-0.4 Jy at 100 m for (IRAS FSC), which corresponds to an IRAS flux limit detection and , respectively.
For nearby objects , IRAS flux limit detection corresponds to , which means that non detected nearby SBS NLS1s are not LIGs.
A similar estimate might be obtained for the redshift range (only two objects have ). This redshift range corresponds to the luminosity range . If the objects are Ultraluminous Infrared galaxies (ULIGs) (), we expect that all of them should be detected. If they are LIG, most of them should also be detected. The absence of detection means that they are not ULIG and that a significant part of them may not be LIG either.
According to Boller et al. (1992), IRAS galaxies are in general faint X-ray emitters. They show that X-ray and IR luminosities are correlated. LIGs tend to be also X-ray luminous (see their fig. 6). Soft X-ray luminous sources in our sample of NLS1s do not tend to be luminous in the infrared. The X-ray luminosity range of SBS NLS1s is . Following Boller et al. (1992) we would expect that they may have IR luminosities in the same range, i.e. . As was shown above, if the SBS NLS1s have such luminosities, they should have been detected by IRAS. We conclude, that most of the SBS NLS1s are luminous X-ray sources and weak FIR sources. These objects would be located in the upper left part of fig. 6 of Boller et al. (1992) and may drastically change their correlation. NLS1s were found as luminous infrared emitters also by Halpern & Oke (1987) and Lipari (1994) who have investigated exclusively the ultraluminous and luminous infrared sources with extreme FeII emission.
Keel et al. (1994) investigated the correlations between emission-line properties and IR parameters for 221 warm IRAS AGN from the Point Source catalogue. They found that optical emission line properties are correlated with the IR emission which is consistent with the unified model. Steeper IR spectra is statistically associated with the strongest FeII emission. FeII emission is believed to be produced in very dense zones, , within the broad line region. Therefore, the FeII – infrared connection poses an important challenge to the unified model.
In this scenario, a screen of surrounding material absorbs optical light which is reradiated in the IR. The torus blocks escaping radiation except in the direction along its symmetry axis which is believed to coincide with the axis of the central machine (the radio axis). The emission intercepted by an obscuring thick torus should be reradiated in the infrared. The warmest IR spectra would be associated with torii viewed face-on, so that their inner region are fully exposed along the line of sight, while an edge-on torus would be cooler because we preferentially see the outer regions of the torus.
If strongest FeII emission is statistically associated with steeper IR spectra, we would expect, that SBS NLS1s, would have strong IR emission, since more than half are either strong or very strong FeII emitters. This is not the case. Therefore, the proposed relation between optical-to-IR spectral slope and FeII emission is more likely to be an artifact of sample selection.
Moran et al. (1996) obtained accurate spectroscopic classification of the Boller et al. (1992) sample of IRAS sources detected by ROSAT. They find a correlation between and for luminous IRAS/ROSAT objects. However, this correlation is still under debate. It remains unclear whether the IR emission in AGN is primarily thermal and whether both X-ray and IR emission arise from a common non-thermal source. The inspection of 20 NLS1s objects in table 4 of Moran et al. (1996), shows that all of them without exception are LIGs or ULIGs. The cross correlation of two bright source catalogues (IRAS and ROSAT BSC), resulted in the selection of the brightest objects both in X-ray and in infrared. Moran et al. (1996) conclude that NLS1s are very luminous soft X-ray and FIR emitters. Nevertheless, this is another example of sample dependent results.
¿From the data presented by Boller et al. (1992) and Moran et al. (1996), the proportion of NLS1s yields of the luminous IRAS/ROSAT sources and among the luminous IRAS/ROSAT Sy1s.
In the SBS sample of NLS1s, there is only one object which is LIG. The others are not ULIG and most of them may not be LIG (see Figure6a, 6b, 7a and 7b). The SBS NLS1s not detected by IRAS, may have SEDs without a FIR peak. This is important for NLS1s physics. Therefore, it is not clear how representative previous results are on the X-ray and/or IR properties of NLS1s parent population. The IR bump is in close connection with the BBB bump, because the IR part of the BBB emission seems to be reprocessed by a circum-nuclear dust torus (Krolik 1996). Rodrigues- Pascual et al. (1997) discussed the hypothesis of the absence of the BLR in some NLS1s, as well as the possibility that the line emitting material is optically thin. If these are correct, then the absence of an IR bump in the majority of SBS NLS1s and the weakness of X-ray radiation of % of them might be used as evidence of the absence of a BLR in these NLS1s (if they are intrinsic properties). Furthermore, no evidence of BBB was found in the radio-loud NLS1 PKS 2004-447 by Oshlack et al. (2001). We suggest that almost all SBS NLSy1s may not have the FIR bump, nor a BLR, but may have a BBB bump based on their SEDs.
Radio (1.4 GHz) region
Nine SBS objects (33%) are detected at 1.4 GHz, with radio fluxes between 1 and 6 mJy. The corresponding radio luminosities are , similar to Mkn galaxies and characteristic of “normal galaxies” (Bicay et al. 1995).
The radio region is still unknown for radio-quiet AGN, especially for NLS1s (Wilkes 1999). A sample of seven NLS1s was studied in the radio by Ulvestad et al. (1995). They found that they are faint sources with radio-power from to W Hz-1, similar to that found for Mkn galaxies by Bicay et al. (1995). Moran (2000) investigated 24 NLS1s at 20 and 3.6 cm using the VLA. Most were found to be unresolved sources at , with generally steep () radio spectra; they are generally radio-quiet objects, with only four being radio-loud: PKS 0558-504 (Remillard et al. 1986, Siebert et al. 1999), RGB J0044+193 (Siebert et al. 1999), J0134.2-4258 (Grupe et al. 2000) and PKS2004-447 (Oshlack et al. 2001). Siebert et al. (1999) found no clear differences between radio-loud and radio-quiet NLS1s.
The importance of radio loud NLS1s lies in the fact that the presence of radio emission, and an associated relativistic jet, might give us an independent light on the orientation issue. The discovery of radio-loud NLS1s indicate that the observational definition of NLS1s requires refinement.
Only 10 SBS NLS1s have radio data and are radio-quiet sources.
FeII emission
One of the general properties of SBS NLS1s is the presence of strong FeII emission, usually quantified by . In our sample it shows a wide range of values, between 0.1 and 1.6. More than half of them (52%) are strong FeII emitters, . The mean flux value obtained is 384, and the mean value is 0.900.44.
Two basic correlations for NLS1s are known, both related to the strength of FeII: FWHM of H and soft X-ray photon index strongly correlated with strength. These correlations suggest, that the strength of FeII emission is closely related to the soft X-ray emission. We obtain a similar result for SBS NLS1s (see Figure3). Weak FeII emitters have always large FWHM but strong FeII emitters have either large or small FWHM. Marziani et al. (2001) show that the R(4570) ratio versus may define an AGN “main sequence”, with NLS1s located at the strong end of R(4570).
We were not able to investigate the correlation between FeII emission and radio properties of SBS NLS1s because of the scarce number of sources detected at 1.4 GHz. The correlation of the radio spectrum with the strength of FeII emission was discussed by Boroson & Green (1992). They found that radio-quiet QSOs tend to have large value of EW FeII and small value of [OIII] (fig. 2 of Boroson & Green). Strong FeII and weak [OIII] tend to have narrow lines (NLS1s/NLQSOs) and objects with weak FeII and strong [OIII] predominantly are steep-spectrum radio-loud QSOs.
Surface density
The data presented in this paper allows us to make the first rough estimate of the surface density of NLS1s. The objects with might be considered as members of a complete sample of SBS NLS1s. The lower limit value of the surface density of SBS NLS1s is about 0.015 per (). The proportion of NLS1s among the complete sample of SBS Sy1s in the sky area of about consists of about . More precise data, together with the results of high-resolution spectroscopy and photometry for the SBS NLS1s complete sample will be presented in a forthcoming paper.
The absolute magnitude of SBS NLS1s are ranged from , optical luminosities between 43.5 44.7, soft X-ray (0.05-2.4 keV) luminosities between 42.8 45.4 and radio luminosities at 1.4 GHz between .
7 Conclusions
A multiwavelength investigation of the homogeneously selected sample of 26 SBS NLSy1s is presented. Basic data (accurate coordinate, magnitudes, redshifts, identification of optical objects with X-ray, IR and radio sources), together with data derived from photometric magnitudes, fluxes and spectroscopy (EW and FWHM of H, [OIII]5007, FeII4570, [OIII]5007/H, FeII4570/H, etc.) are presented. This allowed us to construct the SED for a complete sample of NSL1s.
Our main conclusions are:
-
1.
They are mainly strong or moderately strong (= 42.8-45.4) soft X-ray sources. Non soft x-ray detected sources have a , which means that they are 10 to 50 times less luminous in soft X-rays relative to the bulk of NLS1s or ROSAT AGN. Four objects not detected in soft X-ray band are optically luminous .
-
2.
SBS NLS1s do not tend to be luminous in the infrared. Most of them (92%) were not detected by IRAS. They are not ultraluminous infrared galaxies, and most of them are not luminous infrared galaxies. They are predominantly weak infrared sources. Among them the only LIG galaxy is Mkn 124, which is a rare NLS1s which combines a high FIR luminosity with a low X-ray luminosity.
-
3.
All SBS NLS1s which have detections in the radio are radio-quiet objects, .
-
4.
All SBS NLS1s show FeII emission, with more than half of them (52%) being moderately strong FeII emitters, FeII4570/H1.
-
5.
Like in most AGN, a linear correlation between the X-ray luminosity and optical luminosity is found for the SBS NLS1s, - 15.3. Also, an anticorrelation between FWHM of and the ratio of FeII4570/H is obtained.
-
6.
A weak correlation is found between index and optical luminosity, - 8.5. The mean value of the power-law slope for the SBS NLS1s -1.33.
-
7.
The first estimate of the surface density of NLS1s is obtained: 0.015 per (). The proportion of NLS1s among the Sy1s in the complete sample of SBS AGN comprises 40%.
-
8.
A comparison of the luminosities in the FIR, optical and soft X-ray continuum band leads to the conclusion, that the SED of SBS NLS1s may differ from those studied before. The traditional peak in FIR which is seen in most AGN is not seen in many of these objects. Most of the SBS NLS1s which were not detected by IRAS and may not have the FIR bump. Therefore, the SBS NLS1s are excellent candidates for SIRTF observations, since they were not detected by ISO.
-
9.
The absence of the FIR bump in the majority of the SBS NLS1s coupled with the suggestion that they could possess a BBB and the weakness of X-ray radiation in some of them (if they are intrinsic properties) may argue against the presence of a BLR in these objects.
-
10.
The SBS sample of NLS1s, in spite of their small number, consist of a physically heterogenous group of objects. They do not have physical properties identical as the NLS1s studied so far. The observational properties of NLS1s may not depend predominantly on their orientation but on individual evolutionary history. Among SBS NLS1s, we found controversial objects which do not necessarily fulfill the “main” properties of NLS1s: At least 15% of SBS NLS1s may have a hidden AGN in their central zone, and therefore may be objects highly absorbed, like Mkn 486. They are weak soft X-ray sources, but optically luminous objects. Objects which are strong soft X-ray sources, but weak FIR sources and vice versa. Objects with moderately strong FeII emission, but weak soft X-ray emission and vice versa.
In summary, accordingly with the data presented in the literature and the observational properties of SBS NLS1s presented in this paper, we can say that only the tip of the iceberg was studied, i.e. the most luminous sources. To obtain a more realistic picture, one needs to investigate the X-ray and IR weak NLS1s, which outnumbers (200-300) the brightest ones. The detection of weak soft X-ray NLS1s, radio loud NLS1s, weak FeII emission NLS1s, as well as the presence of objects with the FWHM of H less than 2000 km , but [OIII]/H make the NLS1s definition very smooth and artificial. Therefore, this definition needs to be refined. NLS1s may not be formally a distinct class of objects. The velocity cut FWHM of H km , and [OIII]/H, automatically and artificially isolated this “narrow” group of AGN, that are called NLS1s. We support that in general, there is a continuation of all properties of NLS1s to the class of more luminous objects with the luminosities , NLQSOs, which are the bright cousins of NLS1s; as well as, a continuous transition of all properties between NLS1s and classical BLS1s.
8 Acknowledgements
J. A. Stepanian acknowledges financial support from CONACYT (Cátedra Patrimonial II EX-000287). E. Benítez and I. Cruz-González acknowledge support from grant ES118601 from DGAPA-UNAM, which includes also T. Verdugo student scholarship. This research has made use of NASA/IPAC Extragalactic Database (NED), which is operated by the Jet Propulsion Laboratory, California Institute of Technology, under contract with the National Aeronautics and Space Administration. Finally, we want to thank our anonymous referee for very useful comments which helped to improved this work.
References
- Afanasiev (1995) Afanasiev, V. L., Burenkov, A. N., Vlasyuk, V. V., Drabek, S. V. 1995, SAO Tech. Rep. 234
- (2) Allen, C. W. 1976, Astrophysical Quantities (London: The Athone Press London), 198
- (3) Bade, N., Fink, H. H., Engels, D., Voges, W., Hagen, H.-J., Wisotzki, L., & Reimers, D. 1995, A&A, 110, 469
- (4) Bauer, F. E, Condon, J. J., Thuan, T. X., & Broderick, J. J. 2000, ApJS, 129, 547
- (5) Becker, R. H., White, R. L., & Helfand, D. J. 1995, ApJ, 450, 559
- (6) Berman, G., Schmidt, G. D., West, S. C., & Stockman, H. S. 1990, ApJS, 74, 869
- (7) Bicay, M. D., Kojoian, G., Seal, J., Dickinson, D. F., & Malkan, M. A. 1995, ApJ, 98
- (8) Bicay, M. D., Stepanian, J. A., Chavushyan, V. H., Erastova, L. K., Ayvazian, V. T., Seal, J., & Kojoian, G. 2000, A&AS147, 169
- (9) Boller, Th., Brandt, W. N., & Fink, H. 1996, A&A, 305, 53
- (10) Boller, Th., Meurs, E. I. A., Brinkmann, W., Fink, H., Zimmermann, U., & Adorf, H.-M. 1992, A&A, 261, 57
- (11) Boroson, T. A., & Green R. F. 1992, ApJS, 80, 109
- (12) Brandt, W. N., Laor, A., & Wills, B. J. 2000, ApJ, 528, 637
- (13) Condon J. J., Cotton, W. D., Greisen, E. W., Yin, Q. F., Percey, R. A., Taylor, G., & Broderick, J. J. 1998a, AJ, 115, 1693
- (14) Condon, J. J., Yin, Q. F., Thuan, T. X., & Boller, Th. 1998b, ApJ, 116, 2682
- (15) Daved, L. P., Jones, C., & Forman, W. 1992, ApJ, 388, 82
- (16) Drabek, S. V., Kopilov, I. M., Somov, N. N., & Somova, T. A. 1986, Astrof. Issled. (Izv.SAO), 22, 64
- (17) Elvis, M., & Fabiano, G. 1984, ApJ, 280, 91
- (18) Edelson, R., Vaughan, S., Warwick, R., Puchnarewicz, E. M., & George, I. 1999, MNRAS, 307, 91
- (19) Engels, D., & Keil, R. 2000, Astro-ph/0005157.
- (20) Gallagher, S. C., Brandt, W. N., Laor, A., Elvis, M., Mathur, S., Wills, B. J., & Iyomoto, N. 2001, ApJ, 546, 795
- (21) Greiner, J., Danner, R., Bade, N., Richter, G. A., Kroll, P., & Komossa, S. 1996, A&A, 310, 384
- (22) de Grijp, M. H. K., Keel, W. C., Miley, G. K., Goudfrooij, P., & Lub, J. 1992, A&AS, 96, 389
- (23) Grupe, D., Beuermann, K., Thomas, H.-C., Mannheim, K., & Fink, H. H. 1998, A&A, 330, 25
- (24) Grupe, D., Beuermann, K., Mannheim, K., & Thomas, H.-C. 1999, A&A, 350, 805
- (25) Grupe, D., Leighly, K. M., Thomas, H., & Laurent-Muehleisen, S. A. 2000, A&A, 356, 11
- (26) Goodrich, R. W. 1989, ApJ, 342, 224
- (27) Halpern, J. P., & Oke, J. B. 1987, ApJ, 312, 91
- (28) Hewett, P. C., Foltz, C. B., & Chafee, F. H. 1995, AJ, 109, 1498
- (29) Keel, W. C., de Grijp, M. H. K., Miley, G. K., & Zheng, W. 1994, A&A, 283, 791
- (30) Krolik, J. H. 1996, Vistas in Astronomy, 40, 9
- (31) La Franca, F. A., Cristiani, S., & Vio, R. 1995, A&A, 299, L19
- (32) Laor, A., Fiore, F., & Elvis, M., et al. 1994, ApJ, 435, 611
- (33) Laor, A., Fiore, F., Elvis, M., Wilkes, B. J., & McDowell, J. C. 1997,ApJ, 477, 93
- (34) Lipari, S. 1994, ApJ, 436, 102
- (35) Moran, E. C., Halpern, J. P., & Helfand, D. J. 1996, ApJS, 106, 341
- (36) Moran, E. S. 2000, NewAR, 44, 527
- (37) Marziani, P., Sulentic, J. W., Zwitter, W., Dultzin-Hacyan, D., & Calvani, M. 2001, ApJ, 558, 553
- (38) Markarian, B. E. 1967, Astrofizica, 3, 55
- (39) Markarian, B. E., Lipovetski, V. A., & Stepanian, J. A. 1983, Afz, 19, 29
- (40) Markarian, B. E., & Stepanian, J. A. 1983, Afz, 19, 639
- (41) Martel, A., & Osterbrock, D. E. 1994, AJ, 107, 1283
- (42) Mass-Nesse, J. M. 1992, A&A, 253, 49
- (43) Neugebauer, G., & Mattews, K. 1999, AJ, 118, 35
- (44) Oshlack, A. Y. K. N., Webster, R. L., & Whiting, M. T. 2001, ApJ, 558, 578
- (45) Osterbrock, D. E. 1977, ApJ, 215, 733
- (46) Osterbrock, D. E., & Pogge, R. W. 1987, ApJ, 323, 108
- (47) Pietsch, W., Bischoff, K., & Boller, Th. 2000, Astro-ph/0005167.
- (48) Polletta, M., & Courvoisier, T. J. -L. 2000, NewAR, 44, 551
- (49) Remillard, R. A., Bradt, H. V., Buckley, D. A. H., Robertis, W., Schwartz, D. A., Tuohy, I. R., & Wood, K. 1986, ApJ, 301, 742
- (50) Rush, B., Malkan, M. A., Fink, H. H., & Voges, W., 1996, ApJ, 471, 190
- (51) de Robertis, M. 1985, ApJ, 289, 67
- (52) Rodrigues-Pascual, P. M., Mas-Hesse, J. M., & Santos-Lleo, M. 1997, A&A, 327, 72
- (53) Saunders, W., Sutherland, W. J., Maddox, S. J., Keeble, Q., Oliver, S. J., Rowan-Robinson, M., McMahon, R. G., Efstathiou, G. P., Tadros, H., White, S. D. M., Frenk, C. S., Carramiñana, A., Hawkins, M. R. S., 2000, MNRAS, 317, 55.
- (54) Schmidt, M., & Green, R. F. 1983, ApJ, 269, 352
- (55) Schmidt, M., & Green, R. F. 1986, ApJ, 305, 68
- (56) Schwope, A. D., Hasinger, G., Lehmann, I., Schwarz, R., Brunner, H., Neizvestny, S., Ugrumov, A., Balleg, Y., Trumper, J., & Voges, W. 2000, Astron Nachr., 321, No 1
- (57) Siebert, J., Leghly, K. M., Laurent-Muehleisen, S. A., Brinkmann, W., Boller, Th., & Matsuoka, M. 1999, A&A, 348, 678
- (58) Stepanian, J. A., Chavushyan, V. H., Carrasco, L., Mújica, R., & Valdes, J. R. 2002, AJ, 124, 3
- (59) Stepanian, J. A. 1994, Doctoral Thesis, Nizhnij Arkhiz
- (60) Stepanian, J. A, Green, R. F., Foltz, C. B., Chaffee, F., Chavushyan V. H., Lipovetsky, V. A., & Erastova, L. K. 2001, A&A 122, 3361
- (61) Stepanian, J. A., & Chavushyan, V. H. 2002, in IAU Colloq. 184, AGN Surveys, eds. R. F. Green, E. Y. Khachikian, & D. B. Sanders, ASP Conf. Ser., San Francisco: ASP, in press
- (62) Stepanian, J. A., Lipovetsky, V. A., Schapovalova, A. I., Erastova, L., & Chavushyan, V. H. 1991, Afz, 33, 199
- (63) Stepanian, J. A., Lipovetski, V. A., Erastova, L. K., Schapovalova, A. I., & Gulzadian, M. 1993, Astrofiz. Issled.(Izv.SAO), 35, 15
- (64) Stephens, S. 1989, AJ, 97, 10
- (65) Taniguchi, Y., Murayama, T., & Nagao, T. 1999, Astro-ph/9910036
- (66) Ulvestad, J. S., Antonucci, R. R., & Goodrich, R. W. 1995, AJ, 109, 81
- (67) Veron-Cetty, M. -P., & Veron, P. 2001, A&A, 374, 92
- (68) Veron-Cetty, M. -P., Veron, P., & Goncalez, A. C. 2001, A&A, 372, 730
- (69) Voges, W., Aschernbach, B., Boller, Th., Brauninger, H., Brile, U., Burket, W., Dennerl, K. J., Englhauser, R., Gruber, R., Haberl, F., Hartner, G., Hazinger, G., Kurster, M., Pfeffermann, E., Pietsh, W., Predehl, P., Rosso, C., Schmidt, J. H. M., Trumper, J., & Zimmermann, H. U. 1999, A&A, 349, 389
- (70) Voges, W., Aschernbach, B., Boller, T., Brauninger, H., et al. 2000, IAUC 7432.
- (71) Wilkes, B. 1999, in Quasars and Cosmology, ASPCS, 162, ed. G. Ferland & J. Baldwin (ASP:San Francisco),15
- (72) Wilkes, B., Tananbaum, H., Avni, Y., Worrall, D. M., Oey, M. S., & Flanagan, J. 1994, ApJS, 92, 53
- (73) Williams, R., Pogge, D., & Mathur, S. 2002, AJ, 124, 3042
- (74) Wisotzki, L., & Bade, N. 1997, A&A 320, 395
- (75) Xu, D. W., Wei, J. Y., & Hu, J. Y. 1999, ApJ, 517, 622
- (76) Zickraf, F. J. 1997, A&AS, 123, 103
| SBS | R.A. | Dec. | Identification | d*d | FeII | Other | Ref. | |||||
|---|---|---|---|---|---|---|---|---|---|---|---|---|
| Design. | 2000 | 2000 | 1RXSJ | o/x | radio | o/r | NIR | ″ | name | |||
| (1) | (2) | (3) | (4) | (5) | (6) | (7) | (8) | (9) | (10) | (11) | (12) | (13) |
| 0919+515 | 09 22 47.17 | +51 20 38.6 | 092246.4+512046 | 10 | 8 | vs | vs | [1,2] | ||||
| 0921+525aaEW and FWHM of H, H, H, [OIII] and FeII are given in Å in the rest-frame (Stephens 1989, Bade el al. 1995, Moran et al. 1996, Grupe et al.1999). “L” means a Lorenzian fit to the broad component (Veron et al. 2001). In most cases EW and FWHM of H and H is the sum of the blend H+ and H+. | 09 25 12.89 | +52 17 10.9 | 092512.3+521716 | 7bbThe mean value. The range is according to Veron et al. (2001). | FIRST | 25*12 | w | w | Mkn 110 | [3,4,17,19] | ||
| 0924+495 | 09 28 01.22 | +49 18 16.9 | Non ROSAT | 10 | vs | vs | [6,7] | |||||
| 0933+511 | 09 36 43.12 | +50 52 49.6 | 093642.6+505249 | 5 | 24*12 | s | s | [7,17] | ||||
| 0945+507 | 09 48 42.66 | +50 29 32.2 | 094841.6+502926 | 12 | FIRST | 12 | s | s | Mkn 124 | [4,5,8,9,17,19] | ||
| 0952+552 | 09 56 13.38 | +54 59 05.5 | 095613.3+545904 | 2 | 5 | w | w | [18] | ||||
| 1021+561 | 10 24 34.70 | +55 56 25.7 | 102435.5+555644 | 19 | 8 | vs | vs | [6,17] | ||||
| 1022+519 | 10 25 31.21 | +51 40 34.8 | 102531.2+514039 | 4bbThe mean value. The range is according to Veron et al. (2001). | FIRST | 18*14 | vs | vs | Mkn 142 | [10,17,19] | ||
| 1055+605 | 10 58 30.13 | +60 16 00.5 | 105830.1+601602 | 2bbThe mean value. The range is according to Veron et al. (2001). | 8 | vs | vs | RBS 925 | [10,17,20] | |||
| 1118+541aaEW and FWHM of H, H, H, [OIII] and FeII are given in Å in the rest-frame (Stephens 1989, Bade el al. 1995, Moran et al. 1996, Grupe et al.1999). “L” means a Lorenzian fit to the broad component (Veron et al. 2001). In most cases EW and FWHM of H and H is the sum of the blend H+ and H+. | 11 21 08.55 | +53 51 20.7 | 112109.9+535125 | 12bbThe mean value. The range is according to Veron et al. (2001). | FIRST | 12 | vs | vs | RBS 971 | [12,17,19,20] | ||
| 1136+595 | 11 39 00.48 | +59 13 46.7 | Non ROSAT | 14 | vs | s | ||||||
| 1213+549AaaEW and FWHM of H, H, H, [OIII] and FeII are given in Å in the rest-frame (Stephens 1989, Bade el al. 1995, Moran et al. 1996, Grupe et al.1999). “L” means a Lorenzian fit to the broad component (Veron et al. 2001). In most cases EW and FWHM of H and H is the sum of the blend H+ and H+. | 12 15 49.39 | +54 42 24.1 | 121549.3+544227 | 3 | FIRST | 2MASS | 10*8 | s | s | [12,13,14,17,19] | ||
| 1258+569 | 13 00 52.24 | +56 41 06.9 | 130052.9+564101 | 8 | 2MASS | 12 | s | s | [17] | |||
| 1315+604 | 13 17 50.26 | +60 10 40.7 | 131750.4+601047 | 6 | NVSS | 16ddfootnotemark: | 2MASS | 15*10 | w | w | [17] | |
| 1332+580 | 13 34 35.25 | +57 50 16.3 | 133434.3+575019 | 8 | 2MASS | 9 | vs | vs | [17] | |||
| 1340+569aaEW and FWHM of H, H, H, [OIII] and FeII are given in Å in the rest-frame (Stephens 1989, Bade el al. 1995, Moran et al. 1996, Grupe et al.1999). “L” means a Lorenzian fit to the broad component (Veron et al. 2001). In most cases EW and FWHM of H and H is the sum of the blend H+ and H+. | 13 42 10.23 | +56 42 11.6 | 134210.9+564219 | 8 | 2MASS | 14 | w | w | [17] | |||
| 1353+564 | 13 55 16.50 | +56 12 44.5 | 135515.9+561244 | 5bbThe mean value. The range is according to Veron et al. (2001). | FIRST | 2MASS | 9 | vs | s | [15,17,19] | ||
| 1359+536 | 14 00 50.18 | +53 24 24.8 | 140048.5+532423 | 15 | 6 | w | w | [17] | ||||
| 1404+582 | 14 06 04.73 | +58 00 41.3 | 140606.1+580045 | 12 | 7 | vs | s | [17] | ||||
| 1406+540 | 14 07 59.19 | +53 47 59.8 | 140800.2+534815 | 18 | 6 | s | s | [17] | ||||
| 1412+538 | 14 14 19.78 | +53 38 15.4 | 141419.2+533803 | 13 | 9 | vs | s | [17] | ||||
| 1415+566 | 14 17 00.11 | +56 26 00.9 | 141700.1+562601 | 2ccIn Grupe et al. (1999), in their table 1 seems like the value of and FeII/[OIII] are given, not the logarithms. | 11 | s | s | RBS 1362 | [15,17,20] | |||
| 1509+522 | 15 11 01.91 | +52 03 49.7 | Non ROSAT | 9 | vs | w | ||||||
| 1535+547aaEW and FWHM of H, H, H, [OIII] and FeII are given in Å in the rest-frame (Stephens 1989, Bade el al. 1995, Moran et al. 1996, Grupe et al.1999). “L” means a Lorenzian fit to the broad component (Veron et al. 2001). In most cases EW and FWHM of H and H is the sum of the blend H+ and H+. | 15 36 38.43 | +54 33 33.0 | Non ROSAT | 5 | FIRST | 15 | vs | s | Mkn 486 | [5,16,19] | ||
| 1536+498 | 15 37 32.42 | +49 42 46.4 | 153732.5+494249 | 3 | FIRST | 6 | s | vs | [15,17,19] | |||
| 1656+578 | 16 56 55.93 | +57 45 48.4 | 165656.5+574541 | 8 | 8 | s | w | [17] | ||||
[1] Boller et al. (1996); [2] Stephens (1989); [3] Boroson & Green (1992); [4] Osterbrock (1977); [5] Veron et al. (2001); [6] Stepanian et al. (2001); [7] Stepanian et al. (1993); [8] de Grijp et al. (1992); [9] Keel et al. (1994); [10] Grupe et al. (1999); [11] Stepanian et al. (2002); [12] Moran et al. (1996); [13] Martel & Osterbrock (1994); [14] Stepanian et al. (1991); [15] Bade et al. (1995); [16] de Robertis (1985); [17] Voges et al. (1999); [18] Voges et al. (2001); [19] Becker et al. (1995); [20] Shwope et al. (2000).
| Name of object | J2000 | B1950 | Ref. | ||
|---|---|---|---|---|---|
| (1) | (2) | (3) | (4) | (5) | (6) |
| 1RXSJ121549.3+544227 | 12 15 49.4 | +54 42 28 | 12 13 21.6 | +54 59 07 | [1,4,6] |
| SBS 1213+549A | 12 15 49.36 | +54 42 24.3 | 12 13 21.64 | +54 59 04.2 | |
| FIRSTJ121549.4+544223 | 12 15 49.45 | +54 42 23.8 | [2] | ||
| IRAS 12134+5459 | 12 13 25.3 | +54 59 10 | [3,4,5,6] | ||
| IRAS 12134+5459 | 12 13 27.7 | +54 59 12 | [3,5,6] | ||
| IRAS 12134+5459 | 12 15 52.1 | +54 42 32.5 | [3,6] | ||
| MCG 09-20-133 | 12 15 55.50 | +54 42 32.9 | 12 13 27.83 | +54 59 12.7 | [4,6] |
| NVSSJ121553+544229 | 12 15 53.04 | +54 42 29.5 | [1,7] | ||
[1] Voges et al. (1999); [2] Becker et al. (1995); [3] Saunders et al (2000); [4] Condon et al. (1998a); [5] Moran et al. (1996); [6] Boller et al. (1992); [7] Condon et al. (1998b).
| SBS | H | H | [OIII] | FeII4570 | FeII5100 | H | Ref. | |||||
|---|---|---|---|---|---|---|---|---|---|---|---|---|
| Design. | EW | FWHM | EW | FWHM | EW | FWHM | EW | FWHM | EW | EW | FWHM | |
| (1) | (2) | (3) | (4) | (5) | (6) | (7) | (8) | (9) | (10) | (11) | (12) | (13) |
| 0919+515 | 1390 | 1860 | [2] | |||||||||
| 0921+525 | 145 | 2120 | 83 | 20 | 1670-2500 | [3,5] | ||||||
| 0924+495 | 90 | 1260 | 22 | 2340 | 36 | 840 | ||||||
| 0933+511 | 82 | 1290 | 22 | 1190 | 4 | 500 | ||||||
| 0945+507aaEW and FWHM of H, H, H, [OIII] and FeII are given in Å in the rest-frame (Stephens 1989, Bade el al. 1995, Moran et al. 1996, Grupe et al.1999). “L” means a Lorenzian fit to the broad component (Veron et al. 2001). In most cases EW and FWHM of H and H is the sum of the blend H+ and H+. | 1645L | 43 | 1840L | 540 | 1050-1400 | [5] | ||||||
| 53 | 39 | 42 | [9] | |||||||||
| 1400 | [4] | |||||||||||
| 0952+552 | 390 | 2780 | 98 | 1950 | 32 | 2620 | 50 | 550 | 25 | |||
| 1021+561 | 23 | 1670 | 20 | |||||||||
| 1022+519aaEW and FWHM of H, H, H, [OIII] and FeII are given in Å in the rest-frame (Stephens 1989, Bade el al. 1995, Moran et al. 1996, Grupe et al.1999). “L” means a Lorenzian fit to the broad component (Veron et al. 2001). In most cases EW and FWHM of H and H is the sum of the blend H+ and H+. | 1710 | 270 | [9] | |||||||||
| 1335 | 60 | 1370L | 260 | 1350-1790 | [5] | |||||||
| 69 | 1620 | 7 | 74 | [3] | ||||||||
| 1055+605aaEW and FWHM of H, H, H, [OIII] and FeII are given in Å in the rest-frame (Stephens 1989, Bade el al. 1995, Moran et al. 1996, Grupe et al.1999). “L” means a Lorenzian fit to the broad component (Veron et al. 2001). In most cases EW and FWHM of H and H is the sum of the blend H+ and H+. | 1880 | 470 | [10] | |||||||||
| 1830 | 840 | [2] | ||||||||||
| 1118+541 | 1400 | 1600 | 450 | [11] | ||||||||
| 1136+595 | 1500 | 126 | 1500 | 400 | ||||||||
| 1213+549A | 1000 | 22 | 1740 | |||||||||
| 41 | 780 | 23 | 720 | 38 | [13] | |||||||
| 1258+569 | 44 | 1700 | 30 | 2500 | 30 | 800 | ||||||
| 1315+604 | 160 | 1700 | 20 | 1300 | 11 | 1800 | 20 | 600 | ||||
| 1332+580 | 250 | 1850 | 36 | 1700 | 16 | 2450 | 10 | 530 | 42 | |||
| 1340+569 | 26 | 1500 | 10 | 400 | ||||||||
| 1353+564aaEW and FWHM of H, H, H, [OIII] and FeII are given in Å in the rest-frame (Stephens 1989, Bade el al. 1995, Moran et al. 1996, Grupe et al.1999). “L” means a Lorenzian fit to the broad component (Veron et al. 2001). In most cases EW and FWHM of H and H is the sum of the blend H+ and H+. | 1590 | 520 | [10] | |||||||||
| 241 | 1800 | 41 | 1300 | 9 | 71 | 40 | 75 | 1300-1780 | [15] | |||
| 57 | 1500 | 20 | 2095 | 85 | 700 | |||||||
| 1359+536 | 360 | 1650 | 76 | 1700 | 32 | 2050 | 49 | 500 | 26 | |||
| 1404+582 | 150 | 1400 | 38 | 1300 | 17 | 800 | 6 | 530 | 46 | |||
| 1406+540 | 100 | 1850 | 28 | 1450 | 10 | 2000 | 8 | 27 | ||||
| 1412+538 | 60 | 1400 | 25 | 1100 | 8 | 1500 | 4 | 400 | 32 | |||
| 1415+566aaEW and FWHM of H, H, H, [OIII] and FeII are given in Å in the rest-frame (Stephens 1989, Bade el al. 1995, Moran et al. 1996, Grupe et al.1999). “L” means a Lorenzian fit to the broad component (Veron et al. 2001). In most cases EW and FWHM of H and H is the sum of the blend H+ and H+. | 187 | 2100: | 17 | 700: | 11 | [15] | ||||||
| 1509+522 | 124 | 1800 | 28 | 645 | 62 | 1020 | ||||||
| 1535+457aaEW and FWHM of H, H, H, [OIII] and FeII are given in Å in the rest-frame (Stephens 1989, Bade el al. 1995, Moran et al. 1996, Grupe et al.1999). “L” means a Lorenzian fit to the broad component (Veron et al. 2001). In most cases EW and FWHM of H and H is the sum of the blend H+ and H+. | 1400L | 123 | 1680L | 400 | 1410-1650 | [5] | ||||||
| 109 | 1480 | 16 | 51 | [3] | ||||||||
| 114 | 22 | [16] | ||||||||||
| 1536+498aaEW and FWHM of H, H, H, [OIII] and FeII are given in Å in the rest-frame (Stephens 1989, Bade el al. 1995, Moran et al. 1996, Grupe et al.1999). “L” means a Lorenzian fit to the broad component (Veron et al. 2001). In most cases EW and FWHM of H and H is the sum of the blend H+ and H+. | 183 | 800 | 29 | 1000 | 2 | 18 | 52 | [15] | ||||
| 1656+578 | 260 | 2000 | 69 | 1950 | 26 | 2300 | 21 | 500 | 38 | |||
In the spectrum of SBS 0921+525, SBS 0933+511, 1055+605, 1135+595, and SBS 1656+578 very strong and wide HeI5876 emission as well as are seen. In the spectrum of SBS 0933+511, SBS 0952+552, SBS 1118+541, SBS 1353+564, SBS 1359+536, SBS 1412+538, [FeVII]6087 and strong HeII4686 are seen.
SBS 1213+549A– This galaxy was classified as Sy1 by Stepanian et al. (1991). Martel and Osterbrock (1994) reclassified the object as NLS1.
SBS 0919+515 is the only object in our sample of NLS1s and in the sample of AGN of Stephens (1989), for which the FWHM of 5007 is greater than FWHM of H.
| SBS | [OIII]5007 | H | FeII4570 | FeII4570 | Ref. |
|---|---|---|---|---|---|
| Design. | H | H | [OIII] | H | |
| (1) | (2) | (3) | (4) | (5) | (6) |
| 0919+515 | 0.45 | 2.77 | 3.48 | 1.55 | [2] |
| 0921+525 | 0.13bbThe mean value. The range is according to Veron et al. (2001). | [4,5] | |||
| 0.58 | (0.24) | 0.14 | [3] | ||
| 0924+495 | 0.25 | (4.80) | 1.2 | ||
| 0933+511 | 3 | ||||
| 0945+507 | 0.78 | 5.40 | [8] | ||
| 0.72 | (0.83) | 0.60 | [5] | ||
| 0952+552aaThe line ratios from Bade et al. (1995) are not corrected for reddening. | 0.49 | 2.78 | 0.58 | 0.29 | |
| 1021+561 | 0.40 | (3.43) | 1.37 | ||
| 1022+519ccIn Grupe et al. (1999), in their table 1 seems like the value of and FeII/[OIII] are given, not the logarithms. | 0.19 | 3.31 | (4.05) | 0.77 | [10] |
| 0.14 | (6.57) | 0.92 | [5] | ||
| 0.11 | (9.81) | 1.08 | [3] | ||
| 1055+605ccIn Grupe et al. (1999), in their table 1 seems like the value of and FeII/[OIII] are given, not the logarithms. | 0.30 | (2.27) | 0.68 | [10] | |
| 0.34 | 3.74 | 1.85 | 0.63 | [2] | |
| 1118+541 | 0.5: | [11] | |||
| 1136+595 | 0.30 | ||||
| 1213+549A | 5.10 | [13] | |||
| 0.60 | (1.68) | 1.01 | [12] | ||
| 0.45 | (2.69) | 1.21 | |||
| 1258+569 | 0.5: | ||||
| 1315+604aaThe line ratios from Bade et al. (1995) are not corrected for reddening. | 1.00 | 5.95 | |||
| 1332+580aaThe line ratios from Bade et al. (1995) are not corrected for reddening. | 0.25 | 3.60 | 4.32 | 1.08 | |
| 1340+569 | 1.89 | 3.54 | |||
| 1353+564ccIn Grupe et al. (1999), in their table 1 seems like the value of and FeII/[OIII] are given, not the logarithms. | 1.62 | 0.30 | 0.52 | [10] | |
| 1.5 | [15] | ||||
| 1359+536aaThe line ratios from Bade et al. (1995) are not corrected for reddening. | 0.60 | 2.98 | 0.58 | 0.35 | |
| 1404+582aaThe line ratios from Bade et al. (1995) are not corrected for reddening. | 0.23 | 2.82 | 5.65 | 1.30 | |
| 1406+540aaThe line ratios from Bade et al. (1995) are not corrected for reddening. | 0.23 | 3.59 | 5.65 | 1.30 | |
| 1412+538aaThe line ratios from Bade et al. (1995) are not corrected for reddening. | 0.28 | 3.60 | 5.61 | 1.57 | |
| 1415+566 | 0.65 | [15] | |||
| 1509+522aaThe line ratios from Bade et al. (1995) are not corrected for reddening. | 0.23 | (4.48) | 1.03 | ||
| 1535+547 | 0.13 | (3.54) | 0.46 | [5] | |
| 0.15 | (3.13) | 0.47 | [3] | ||
| 1536+498aaThe line ratios from Bade et al. (1995) are not corrected for reddening. | 0.58 | [15] | |||
| 1656+578aaThe line ratios from Bade et al. (1995) are not corrected for reddening. | 0.29 | 2.48 | 2.17 | 0.63 |
Data in brackets are calculated from the ratio of and [OIII]/H.
| SBS | B | M | log | ROSAT | log | log | Radio | log | log | |||
|---|---|---|---|---|---|---|---|---|---|---|---|---|
| Design. | B | L(B) | cts/s | fx | f(2keV) | Lx | S(R) | |||||
| (1) | (2) | (3) | (4) | (5) | (6) | (7) | (8) | (9) | (10) | (11) | (12) | (13) |
| 0919+515 | 0.161 | 17.33 | -22.6 | 44.56 | 0.418 | 5.21 | -29.24 | 44.76 | -2.98 | -1.07 | ||
| 0921+525 | 0.0353 | 15.63 | -21.0 | 43.85 | 1.690 | 23.01 | -28.60 | 44.11 | 5.16 | 38.60 | -3.01 | -1.09 |
| 0924+495 | 0.1145 | 17.0 | -22.2 | 44.40 | (0.01) | (0.12) | (-30.88) | (42.9) | (-4.74) | |||
| 0933+511 | 0.0553 | 16.5 | -21.1 | 43.94 | 0.054 | 0.65 | -30.15 | 42.96 | -4.21 | -1.54 | ||
| 0945+507 | 0.0550 | 16.47 | -21.0 | 43.85 | 0.028* | 0.35 | -30.42 | 42.80 | 5.39 | 39.02 | -4.49 | -1.64 |
| 0952+552 | 0.317 | 19 | -22.6 | 44.56 | 0.037* | 0.46 | -30.30 | 44.42 | -3.36 | -1.22 | ||
| 1021+561 | 0.197 | 18.02 | -22.4 | 44.49 | 0.117 | 1.09 | -29.92 | 44.34 | -3.37 | -1.22 | ||
| 1022+519 | 0.045 | 15.81 | -21.4 | 44.08 | 1.750 | 20.10 | -28.66 | 44.35 | 1.08 | 38.14 | -3.00 | -1.08 |
| 1055+605 | 0.149 | 17.2 | -22.6 | 44.56 | 0.389 | 3.22 | -29.45 | 44.55 | -3.23 | -1.17 | ||
| 1118+541 | 0.1043 | 16.41 | -22.6 | 44.56 | 0.265 | 2.74 | -29.52 | 44.15 | 2.98 | 39.33 | -3.62 | -1.31 |
| 1136+595 | 0.1138 | 17.0 | -22.2 | 44.40 | (0.01) | (0.12) | (-30.88) | (42.9) | (-4.74) | |||
| 1213+549A | 0.1505 | 16.91 | -22.9 | 44.70 | 0.090 | 1.19 | -29.88 | 44.12 | 2.12 | 39.52 | -3.78 | -1.37 |
| 1258+569 | 0.0719 | 17 | -21.3 | 43.97 | 0.066 | 0.82 | -30.05 | 43.29 | -3.91 | -1.42 | ||
| 1315+604 | 0.1372 | 17.5 | -22.1 | 44.36 | 0.197 | 2.65 | -29.54 | 44.38 | 2.7aaNVSS, Bauer et al. (2000) | 39.54aaNVSS, Bauer et al. (2000) | -3.20 | -1.16 |
| 1332+580 | 0.124 | 17.5 | -21.9 | 44.31 | 0.126 | 1.58 | -29.76 | 44.07 | -3.41 | -1.24 | ||
| 1340+569 | 0.0396 | 16.98 | -19.9 | 43.45 | 0.122 | 1.31 | -29.84 | 42.96 | -3.71 | -1.35 | ||
| 1353+564 | 0.1223 | 17 | -22.4 | 44.46 | 0.546 | 6.19 | -29.17 | 44.66 | 6.14 | 39.79 | -3.03 | -1.10 |
| 1359+536 | 0.175 | 18.5 | -21.7 | 44.17 | 0.035* | 0.44 | -30.32 | 43.83 | -3.58 | -1.30 | ||
| 1404+582 | 0.125 | 17.5 | -21.9 | 44.31 | 0.104 | 1.30 | -29.85 | 43.99 | -3.50 | -1.28 | ||
| 1406+540 | 0.173 | 18.5 | -21.7 | 44.17 | 0.027* | 0.34 | -30.43 | 43.71 | -3.69 | -1.34 | ||
| 1412+538 | 0.164 | 17.5 | -22.5 | 44.53 | 0.066 | 0.75 | -30.08 | 44.01 | -3.74 | -1.36 | ||
| 1415+566 | 0.150 | 17.09 | -22.7 | 44.62 | 0.222 | 2.83 | -29.51 | 44.50 | -3.33 | -1.21 | ||
| 1509+522 | 0.210 | 17.65 | -22.9 | 44.70 | (0.01) | (0.12) | (-30.88) | (43.4) | (-4.49) | |||
| 1535+547 | 0.0397 | 15.21 | -21.6 | 44.17 | (0.01) | (0.12) | (-30.88) | (41.9) | 1.25 | 38.09 | (-5.48) | |
| 1536+498 | 0.280 | 18.3 | -22.9 | 44.70 | 0.387 | 5.25 | -29.24 | 45.36 | 1.63 | 40.00 | -2.58 | -0.93 |
| 1656+578 | 0.198 | 18.5 | -21.9 | 44.31 | 0.053 | 0.91 | -30.00 | 44.27 | -3.26 | -1.18 | ||
*) RASS faint source catalogue (Voges et al. 2000). Data in brackets are upper limit estimates.
| SBS | IRAS | log | ||||||||||||
|---|---|---|---|---|---|---|---|---|---|---|---|---|---|---|
| Design. | 12 | Q | 25 | Q | 60 | Q | 100 | Q | 12/25 | 25/60 | 60/100 | |||
| (1) | (2) | (3) | (4) | (5) | (6) | (7) | (8) | (9) | (10) | (11) | (12) | (13) | (14) | (15) |
| 0945+507 | 0.119 | 2 | 0.266 | 3 | 0.683 | 3 | 0.78 | 2 | -0.351 | -0.409 | -0.058 | -13.49 | 11.07 | 44.65 |
| Index | Variables | N | P | R |
|---|---|---|---|---|
| (1) | (2) | (3) | (4) | (5) |
| 1 | – | 24 | 0.00521 | 0.55155 |
| 2 | – | 17 | 0.01245 | -0.59116 |
| 3 | – | 17* | 0.00039 | -0.76071 |
| 4 | – | 17* | 0.00021 | -0.78144 |
| 5 | – [OIII]/H | 18 | 0.00014 | -0.77805 |
| 6 | – | 19 | 0.80386 | |
| 7 | – | 8 | 0.04455 | -0.71875 |
| 8 | – | 9 | 0.03095 | 0.71335 |
| 9 | – [OIII]/H | 9 | 0.04242 | 0.68339 |
| 10 | – | 9 | 0.03853 | 0.83514 |
| 11 | – | 9 | 0.00081 | 0.90445 |
| 12 | – | 23 | 0.77880 | |
| 13 | – | 23 | 0.87029 |
*) Two discrepant points were discarded for these comparisons. Including them yield N=19, P=0.00741 and 0.08207, and R=-0.59332 and -0.40901 for comparisons 3 and 4, respectively.