Cataclysmic Variables from SDSS II. The Second Year 111Based on observations obtained with the Sloan Digital Sky Survey and with the Apache Point Observatory (APO) 3.5m telescope, which are owned and operated by the Astrophysical Research Consortium (ARC)
Abstract
The first full year of operation following the commissioning year of the Sloan Digital Sky Survey has revealed a wide variety of newly discovered cataclysmic variables. We show the SDSS spectra of forty-two cataclysmic variables observed in 2002, of which thirty-five are new classifications, four are known dwarf novae (CT Hya, RZ Leo, T Leo and BZ UMa), one is a known CV identified from a previous quasar survey (Aqr1) and two are known ROSAT or FIRST discovered CVs (RX J09445+0357, FIRST J102347.6+003841). The SDSS positions, colors and spectra of all forty-two systems are presented. In addition, the results of follow-up studies of several of these objects identify the orbital periods, velocity curves and polarization that provide the system geometry and accretion properties. While most of the SDSS discovered systems are faint ( 18th mag) with low accretion rates (as implied from their spectral characteristics), there are also a few bright objects which may have escaped previous surveys due to changes in the mass transfer rate.
1 Introduction
The commissioning year of the Sloan Digital Sky Survey (SDSS; York et al. 2000), which was released as the Early Data Release (EDR; Stoughton et al. 2002), showed the potential for scientific discoveries across a variety of disciplines. For the field of cataclysmic variables (CVs), SDSS is able to find many new CVs, especially those with faint magnitudes that were missed in previous surveys with brighter limits (Szkody et al. 2002; Paper I). This provides a more accurate picture of the true population of CVs, without the bias of a sample based on high accretion luminosity, and enables the study of the systems which have evolved to the shortest orbital periods and thereby have the lowest mass transfer rates (Howell, Rappaport & Politano 1997). The SDSS photometry provides accurate magnitudes, colors and positions, and the spectroscopy usually allows unambiguous identification from the strong hydrogen Balmer and helium emission lines that are the typical signatures of mass transfer in a close binary. Paper I reported 19 new discoveries from the spectra obtained through December 31, 2000, including high inclination systems, novalikes and those suspected of harboring magnetic white dwarfs (see Warner 1995 for a complete description of all types of CVs). This paper provides information on an additional 42 CVs found from SDSS spectra obtained through 2001 December 31. Of these 42, seven are previously known CVs from prior X-ray, optical, and radio surveys, 3 were previously known objects but not classified as CVs, and 32 are new discoveries. Followup observations on a number of these systems include photometric light curves, time-resolved spectroscopy and polarimetry. The resulting analysis allows us to provide a determination of the orbital period, inclination, and magnetic field for several of the CVs.
2 Observations and Reductions
The SDSS imaging and spectroscopic instrumentation and reductions are explained in detail in Paper I and in the papers by Fukugita et al. (1996), Gunn et al. (1998), Lupton, Gunn, & Szalay (1999), Hogg et al. (2001), Lupton et al. (2001), Smith et al. (2002) and Pier et al. (2003). As a brief summary, SDSS photometry in 5 filters () is used to select objects by color for later spectroscopy in the range of 3900-6200Å (blue beam) and 5800-9200Å (red beam) at a resolving power of 1800. The spectra are wavelength and flux-calibrated and corrected for absorption bands, then classified as stars, galaxies and quasars. The resulting spectra can then be searched by category, redshift or spectral characteristics.
As explained in Paper I, the selection criteria by color ( and ) for the CV category primarily provide spectra of WD+M binaries, some of which are low mass transfer CVs where the underlying stars dominate the light. In addition, the color selection for quasars and very blue objects provide spectra of the blue CVs that are disk or white dwarf dominated. A manual search of all the spectra for emission line objects at zero redshift resulted in the identification of the 42 CVs listed in Table 1. This list includes the objects that will be in Data Release 1 (DR1) as well as several others that were found on additional plates taken in 2001. The magnitudes and colors are from the psf photometry and have not been corrected for reddening. Figure 1 shows the locations of the 42 CVs in SDSS color-color plots along with the stellar locus.
During 2001, we also conducted follow-up observations to refine the nature of the CVs that were being discovered. Photometry was accomplished using the University of Washington 0.76m telescope at Manastash Ridge Observatory (MRO), using a 10241024 CCD and a Harris V filter and also with the U.S. Naval Observatory Flagstaff Station (NOFS) 1m R/C telescope, using a 20482048 SITe/Tektronix CCD. The magnitudes were measured using the IRAF 222IRAF (Image Reduction and Analysis Facility) is distributed by the National Optical Astronomy Observatories, which are operated by AURA, Inc., under cooperative agreement with the National Science Foundation. task and a light curve was constructed from differential magnitudes with respect to comparison stars on each frame. In order to obtain the highest time resolution with the NOFS, no filter was used. The NOFS CCD has a wide-band response that falls between Johnson V and Cousins R, but is somewhat closer to a V response. From separate nights of calibrated all-sky photometry using Landolt standards, the Johnson B and V magnitudes of the comparison stars were calibrated and used to place the photometry of the SDSS sources onto the Johnson V magnitude system.
Time-resolved spectroscopy was done at the 3.5m telescope at Apache Point Observatory (APO) with the Double Imaging Spectrograph in high resolution mode (resolution about 3Å) and a 1.5 arcsec slit. Blue and red spectra were obtained on all nights except for 2002 May 9, when only the red spectrograph was available. The reductions were identical to those of Paper I and details are provided in that reference. For the objects with sufficient time coverage to determine a radial velocity curve, velocities were measured with either the “e” or “k” routines in the IRAF package (for simple or narrow line structure) or with the double-Gaussian method (Shafter 1983). Sinusoidal fits to these velocities were then used to determine (systemic velocity), K (semi-amplitude), P (orbital period) and (phase of crossing from red to blue).
Additionally, the spectropolarimeter SPOL was used on the 2.2m telescope at Steward Observatory (SO) to measure the circular polarization of a few sources to determine if they were magnetic CVs. The dates and type of followup observations are summarized in Table 2.
3 Results
For convenience, throughout the rest of this paper, we will abbreviate the names to SDSShhmm (except for the 2 sources which have identical first 4 coordinates of 1258 so we add the degrees of declination to the name to differentiate the two). The coordinates are accurate enough to identify the objects easily on the Digitized Sky Survey. The few objects that have close companions on the sky are identified as notes to the Table. The last column of Table 1 gives a brief comment on any notable properties of the system.
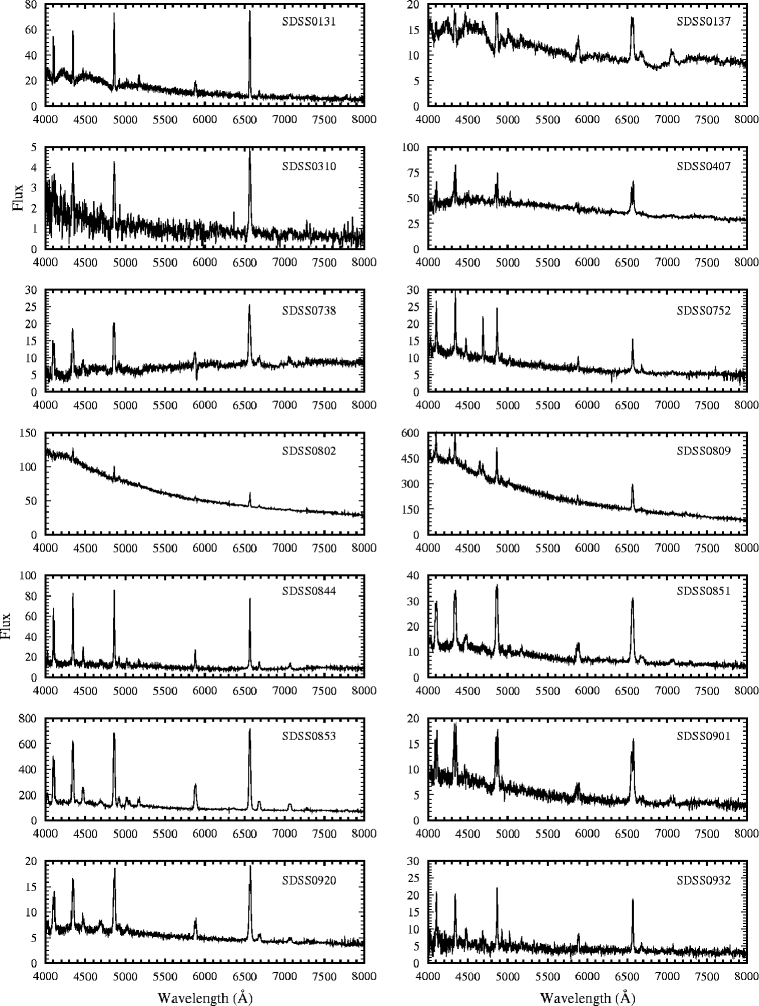
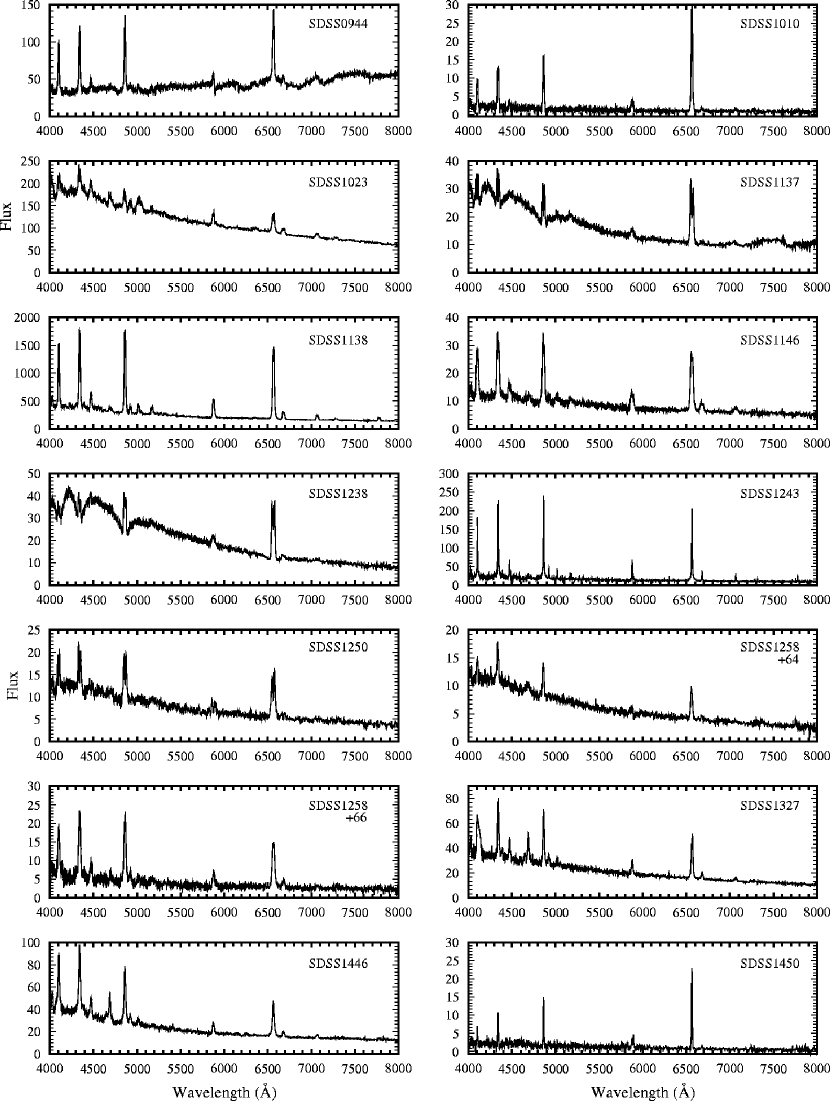
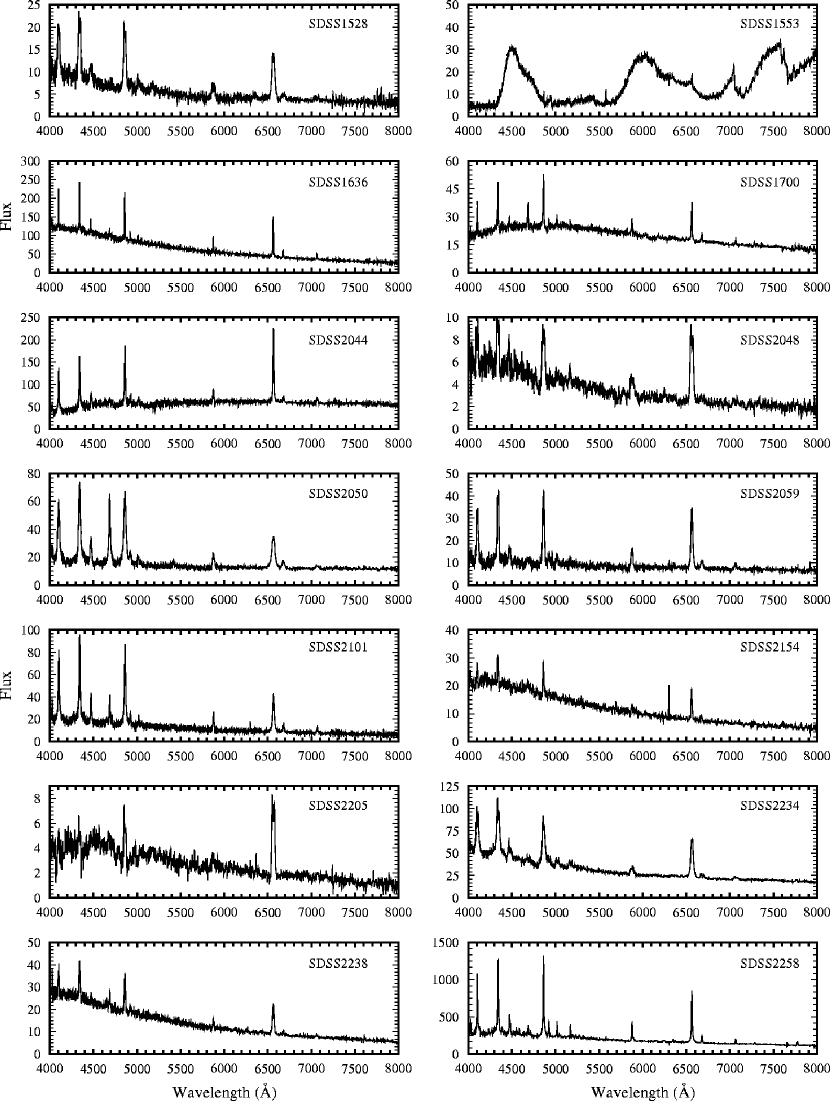
Figure 2 shows the SDSS spectra for all systems. Table 3 lists the equivalent widths and fluxes of the prominent hydrogen Balmer and helium lines, as well as the plate and fiber number of each spectrum. The large strength of He II in some systems allows an automatic separation into those with possible magnetic white dwarfs (see section 3.4). Followup observations were targeted first for those systems with prominent He II or with prominent central absorption lines that would signify an eclipsing system. The results for those systems with sufficient data to accomplish a detailed classification are presented below.
3.1 Previously Known Systems
Spectra of the dwarf novae CT Hya (SDSS0851), RZ Leo (SDSS1137), T Leo (SDSS1138) and BZ UMa (SDSS0853), which are all catalogued in the Downes et al. (2001) catalog (D01), were obtained as a result of the color selection algorithms. The spectra of CT Hya, T Leo and BZ UMa show the typical characteristics of quiescent dwarf novae that are dominated by their accretion disks (i.e. prominent Balmer and He I emission lines and Ca emission in the near IR). RZ Leo, on the other hand, shows strongly doubled lines and broad absorption surrounding the emission lines, which indicates the white dwarf, rather than an accretion disk, is contributing much of the blue light. Mennickent & Tappert (2001; MT01) have recently identified a spectroscopic orbital period of 1.84 hrs and comment on the large V/R variations throughout the orbit. They measured the velocities using a single Gaussian fit to the entire line that resulted in a noisy radial velocity curve. As the lines are clearly not Gaussian (Figure 3), we attempted a better solution by using the double-Gaussian method on the line wings, using the MT01 period. With a Gaussian width of 100 km s-1 and a separation of 2000 km s-1, our solution results in a larger K amplitude (Table 4) and a smoother radial velocity curve (Figure 4).
SDSS0944: The ROSAT identified CV RXJ0944.5+0357 (Jiang et al. 2000; J00) which is SDSS0944 was also in the Sloan spectroscopic coverage. However, the SDSS spectrum (Figure 2) taken in 2001 December shows that the flux at 5500Å is 2.5 times lower (one magnitude) than in the J00 observations (1999 January). This is consistent with the magnitude differences in the two data sets (J00 give a B magnitude of 16.1 whereas the SDSS photometry is 17.0 in g). The lower flux results in changes in the line emission and the domination of the secondary over the accretion disk in the red (see section 3.5). Since both the Hamburg survey and the USNO-A2.0 magnitudes are consistent with the brighter fluxes, while the SDSS and APO spectra are consistent with the fainter magnitudes, this system either has large variations of mass transfer on long timescales or a large orbital flux variation. The followup APO time-resolved spectra over 2.3 hrs show a one magnitude change in the continuum over this interval (Figure 5), which argues for an orbital variation. The radial velocity curve curves of both H and H (Figure 6, Table 4) indicate an orbital period near 3.25 hrs, but a longer data set will be needed to pin this down precisely. It is unusual to have an object in the 3-4 hr period range that has a low enough to show the underlying stars, as most systems in this period range are high mass transfer objects with prominent accretion disks (Warner 1995). In addition, the shape and phasing of the continuum light curve (Figure 5) is inconsistent with either an eclipse (which would have minimum light near phase 0) or a hot spot coming into view (which would have maximum light near phase 0.8). Clearly, further data on this system are needed.
SDSS1023: The recently identified FIRST source J102347.6+003841 (Bond et al. 2002) is also among the SDSS spectra of 2001 (SDSS1023). Since only magnetic CVs have shown radio emission, this is an excellent candidate for a Polar (a spin-orbit synchronized AM Her system with magnetic field over 10 MG) or an Intermediate Polar (IP) system with a field near 1 MG and a spin period for the white dwarf much less than the orbital period. Our 10 APO spectra obtained over 1.7 hrs show the double-peaked profile mentioned by Bond and a changing intensity of He II. The velocity curve (Figure 7 and Table 4) indicates the orbital period is about 3 hrs, and the high semi-amplitude for H is typical of a Polar. While the period is consistent with either an IP or a Polar, the emission lines are more compatible with an IP interpretation, as they do not show the large equivalent widths nor the narrow components that are typically seen in Polars, especially the component from the irradiated secondary which usually is strongest near phase 0.5. Although Bond et al. (2002) could not identify the spin period of the white dwarf from their photometry, it could be shorter than their time resolution. Further spectroscopy throughout the entire orbit as well as spectropolarimetry should resolve the issue.
SDSS2238: The source listed as Aqr1 in D01 and labelled as a CV based on its identification from the Berg et al. (1992) quasar survey also was color-selected (SDSS2238). This object shows He II in both the SDSS and Berg et al. (1992) spectra and could be a magnetic CV candidate. APO spectra show an orbital period of 2.0 hr from the velocities (Figure 8 and Table 4) but the 3.75 hrs of MRO photometry (Table 2) shows only random variability at the 0.2 mag level, with no large periodic variability as is typical for Polars. Polarimetry will be needed to check the magnetic nature.
There are also 3 sources that appear in past surveys but which were not previously identified as CVs.
SDSS0131: SDSS0131 was identified as a blue object (PHL3388, PB8928) in the survey of Berger & Fringant (1984;BF84). Its SDSS spectrum shows strong emission lines surrounded by broad absorption so that it is likely a system with a low disk contribution (see section 3.5 below). The 2 hrs of followup spectra with APO indicate an orbital period of 1.6 hrs (Table 4; Figure 9), which is consistent with a low mass transfer rate.
SDSS0802: The coordinates of SDSS0802 match those of KUV 07589+4019, which was identified as an sdB star by Wegner & Boley (1993). However, the spectrum previously obtained lacked the S/N and resolution to detect the Balmer and HeI emission lines evident in the SDSS spectrum (Figure 2). Thus, this object is likely to be a low inclination, high mass transfer rate novalike system with a bright accretion disk.
SDSS2258: SDSS2258 was also previously identified as a blue star (PB 7412) in the BF84 survey and then classified as an emission line object in the HK survey of Beers et al. (1996). Its coordinates are close (within an arcmin) to the X-ray source RX J225834.4-094945, although this does not guarantee they are the same object. The SDSS spectrum shows a strong, narrow emission line source that is typical of a low inclination CV.
3.2 High Inclination Systems
The systems with high inclination usually show very prominent central absorption in the Balmer lines with increasing absorption up the Balmer series. The CVs in Figure 2 which show this effect are SDSS0407, SDSS0901, SDSS1137, SDSS1238, SDSS1250 and SDSS1327. Photometry of SDSS1137 (RZ Leo) by Howell & Szkody (1988) and MT01 has shown a large orbital modulation but no eclipses. Followup photometry on SDSS0407, SDSS0920 and SDSS1327 reveals eclipses in these 3 systems while time-resolved spectroscopy provides the radial velocities as well as the periods (Tables 2 and 4). The most extensive observations exist for SDSS1327 (which are described in a separate paper; Wolfe et al. 2003) and SDSS0407.
SDSS0407: MRO photometry first revealed a deeply eclipsing (2 mag) system, but clouds prevented the acquisition of further data. NOFS observations later obtained 2 eclipses (Figure 10) that revealed an orbital period of 3.96 hrs and a strong orbital hump modulation due to a prominent hot spot. APO spectra were obtained for 3.5 hrs, covering an eclipse. Figure 11 shows the typical double-peaked profile at phase 0.5, the strong blue peak during the hump phases and the remaining Balmer emission during the eclipse itself. Using the photometric eclipse period, the double-Gauusian fitting applied to the Balmer lines gave a good fit for H, but large errors for H. The resulting parameters from the sine fit to the velocities are given in Table 4 and the velocity curve for H is shown in Figure 12.
SDSS0920: NOFS photometry revealed eclipses for this system even though the lines do not show the usual deep doubling. Figure 13 shows the 2 mag deep eclipses recurring on an orbital period of 3.6 hrs. Unlike SDSS0407, there is no strong modulation hump from a hot spot. Since the APO spectra cover less than half an orbit, a reliable radial velocity solution could not be determined.
SDSS1238: The double-Gaussian fitting to the complex line profiles of this source enabled a period determination of 1.27 hrs from both the H and H lines (Figure 14). The very short period and the appearance of the spectra are very similar low mass transfer systems such as WZ Sge and RZ Leo.
SDSS1250: The 2.3 hrs of APO time-resolved spectra indicate an orbital period near 5.6 hr but further data are needed to confirm this result. There was no noticeable eclipse within our spectral coverage, but the long (15 min) integration times and incomplete coverage of the orbit do not allow us to eliminate their existence. Photometry with better time resolution is needed to search for possible eclipses.
3.3 Dwarf Novae
As mentioned in Paper I, there are 3 epochs of observation for all SDSS spectral sources to determine if there are large magnitude changes related to a dwarf nova outburst or to changes from low to high mass transfer states in novalikes. These include the SDSS photometric epoch, the SDSS spectral epoch and the Digitized Sky Survey (DSS) epoch. A dwarf nova outburst can be distinguished from the high state of a novalike by the spectral appearance, as a dwarf nova at outburst shows broad absorption lines (from the thick disk), while a novalike at a high state usually shows an enhancement of all emission, especially the high excitation lines of He II (Warner 1995).
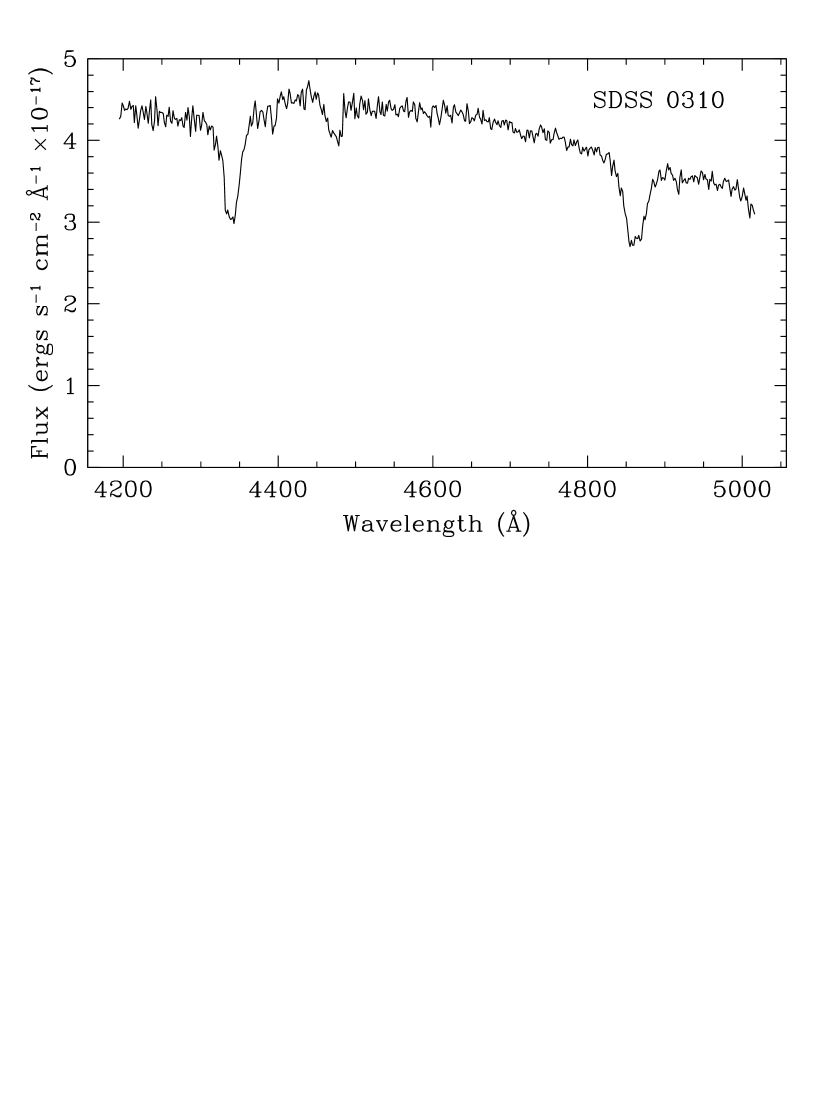
SDSS0310: Of the objects in Table 1, we can identify SDSS0310 as a bona-fide dwarf nova, as the SDSS photometry and the APO followup spectra caught it at outburst (Figure 15), while the SDSS spectrum (Figure 2) was at quiescence. Photometry by A. Henden (private communication) has determined a quiescent magnitude of V=20.7. Unfortunately, followup APO spectra at quiescence were too noisy to allow a good radial velocity solution and we could not obtain a good solution from the broad absorption lines at outburst either, so we have no estimate of the orbital period.
Three additional systems (SDSS1146, SDSS1636 and SDSS2234) show typical spectra of dwarf novae, although photometry/spectroscopy during an outburst is needed to confirm the spacing and amplitude of outbursts.
SDSS1146: The fit to the velocities derived from APO spectra (Table 4) reveal an orbital period near 1.6 hrs (Figure 16). The short orbital period and large H equivalent width are indicative of a low mass transfer system (Patterson 1984).
SDSS1636: The lack of any orbital variation during 4 hours of photometry on SDSS1636 (Table 2) indicates this is likely a low inclination system. Time-resolved spectra should be able to reveal the orbital period.
SDSS2234: The APO spectra reveal an orbital period of 2.0 hrs (Table 4 and Figure 17) for this system, which places it right at the lower edge of the period gap. The strong blue continuum and emission lines are typical of accretion disk systems.
Two other systems show evidence of low states (SDSS2050 was observed to be much fainter than its SDSS photometry during MRO observations in July 2002 and SDSS2101 is fainter on the DSS than during SDSS observations). The presence of low states together with strong He II emission makes both of these likely candidates for magnetic CVs (see next section). However, sufficient followup data are not yet available to confirm the nature of these sources.
3.4 Nova-likes with Strong He II
The presence of strong He II emission lines often signifies a magnetic white dwarf, as they arise from the ionization of the accretion column(s) by the EUV continuum of a radial accretion shock. If an object shows a large circular polarization and strong modulation of the lines and continuum at the orbital period, it can be be classified as a Polar. If it shows little or no polarization, generally single-peaked lines, and periodicity at plausible spin timescales of the white dwarf (minutes), it is considered an IP or SW Sex star (some SW Sex stars have recently been proposed as IPs; Rodriguez-Gil et al. 2000).
Figure 2 and Table 3 contain 9 systems that clearly have stronger He II lines than are expected for a non-magnetic disk system. These, which we identify as the best candidates for magnetic systems, include SDSS0752, 0809, 1023, 1327, 1446, 1553, 1700, 2050, and 2101. SDSS0932 and 2238 may also qualify. Of this group, SDSS1553 has been identified as an extremely low mass-accretion rate Polar (Szkody et al. 2003), and as mentioned above, Bond et al. (2002) have identified SDSS1023 as a FIRST radio source, with high probability of being a magnetic IP system. SDSS1327 is classified as a likely SW Sex star through the work of Wolfe et al. (2003). Our followup observations with APO, MRO, and spectropolarimetry at Steward Observatory have helped to pin down the nature of a few others. These characteristics are summarized below.
SDSS1700: Photometry of SDSS1700 from MRO (Figure 18) reveals a strongly modulated light curve with a period of 115 min., suggestive of a Polar. APO spectra over half the orbit give a radial velocity solution (Table 4) with a relatively low K of 90 km s-1 (Figure 19). Spectropolarimetry at the 2.3m Bok telescope (Figure 20) confirms the Polar nature, with the broadband circular polarization varying between +2% and +28% over the 2 hr period of the observations. The constant sign of circular polarization indicates that we see only one accretion pole through the orbit, while the rather weakly modulated H flux and modest radial velocity amplitude suggest a rather low inclination. In Figure 20 it is clear that the light curve variation is due to a changing continuum shape, from rising slightly to the blue in the first spectrum, to being strongly convex upward for the next few observations, and returning to the initial shape by the end of the sequence. Because these variations correlate with the changing circular polarization, both are taken to arise from the beaming pattern of cyclotron emission. In the coadded polarization spectrum (Figure 21), diffuse absorption features can be recognized near 6100Å and between H and He II 4686. Interpreting these as Zeeman features of H and H, respectively, the field strength near the accretion shock is MG, so the optical spectrum is sampling cyclotron harmonics . These characteristics are rather typical for Polars.
SDSS0752: Photometry obtained at NOFS coincident with our recent XMM observation of this source revealed an orbital period of 2.7 hr (Henden, 2003, private communication). The 1.9 hrs of APO time-resolved spectra show velocity variations on this period (Figure 22). The spectra show the usual narrow and broad components associated with a Polar system, so it is very likely that this object will show some polarization. Further discussion on this source will be deferred until the analysis of the XMM results are completed.
SDSS0809: The time-resolved spectra over almost 3 hrs clearly identify an orbital period of 2.40.1 hr in this system (Figure 23). Although this is slightly shorter than the nominal 3-4 hr range typical of SW Sex stars, the spectra show the strong modulation and usual signature of deep absorption (especially in the He I and Balmer lines near phase 0.5 (Figure 24). As there is no apparent eclipse, this system may be one of the lower inclination SW Sex systems.
SDSS1446: Spectropolarimetry at SO established a polarization limit of +0.380.27% for SDSS1446, indicating that this system cannot be a Polar. The APO coverage was limited by weather to only slightly more than an hour, so further data are needed to establish the exact nature of this system.
SDSS2050: While the 1.8 hrs of APO spectra on 27 Sept 2002 indicate an orbital period near 2 hrs, MRO photometry on 7 Sept only shows an overall declining brightness with some superposed variability during a 2.3 hr observation interval. As noted in the previous section, SDSS2050 was observed to be in a much fainter state (too faint for data acquisition) in 2002 July so the September variability may be related to a transition state between high and low mass transfer, or to orbital variability. Further photometric, spectroscopic, and polarimetric data will be needed to sort out the nature of this object.
SDSS2101: While the Balmer lines are very strong in this system and velocities could be easily measured, there was no obvious variation (within 30 km s-1 during the 1.3 hrs of APO spectra. Further data will be needed to determine the orbital period, but it is apparently not a short period system.
3.5 Systems Showing the Underlying Stars
Six systems (SDSS0131, SDSS0137, SDSS1137, SDSS1238, SDSS2048 and SDSS2205) show broad absorption surrounding the emission lines of H and higher members of the Balmer series. Of these, two (SDSS0137 and SDSS1137) also show the TiO bandheads of an M dwarf secondary. These are indicative of the lowest mass transfer systems where the disk is so tenuous that the underlying stars provide most of the luminosity. Two of the 6 (SDSS1137 and SDSS1238) are also high inclination candidates from their deeply doubled lines (see above). In these cases, the lower disk luminosity may be partly due to the inclination effect, since a disk seen edge on contributes less light than when the entire disk is visible.
Since it is also possible for a dwarf nova on the decline from outburst to show similar absorption features, we checked the spectral fluxes against the SDSS photometry. There is no large difference for any of these systems so we think the spectra are the normal quiescent states of these systems.
SDSS0137: Our two hours of spectral coverage of this source shows an ultrashort orbital period of 1.4 hrs and a high amplitude velocity curve (Figure 25 and Table 4). This is consistent with a very low mass transfer rate system at relatively high inclination.
There are 3 other systems which show evidence of the secondary star from an upturn in the red portion of the spectrum and the presence of the TiO bandhead at 7100Å, but no evidence of the white dwarf. These are SDSS0844, SDSS0944 (RXJ0944.5+0357), and SDSS1553. The weakness of the features in SDSS0844 and the strong blue continuum indicates that the disk is still dominant in this system. SDSS1553 is the very low accretion rate Polar mentioned above.
The contrast of the SDSS spectrum of SDSS0944 with that shown by Jiang et al. (2000) reveals that the Balmer lines are less optically thick (the Balmer decrement is closer to the recombination values) and the accretion disk has a lower density (the M star is dominating redward of 5000Å) at the time of the APO observations. However, as noted above, this system has a large amplitude orbital modulation so the appearance of the secondary star is more noticeable at some phases than others.
3.6 ROSAT Correlations
The cross-identification of the new CVs with the X-ray ROSAT All Sky Survey (RASS; Voges et al. 1999, 2000) reveals that 11 are X-ray sources or have X-ray detections close to their positions. Of these, the 3 known dwarf novae (BZ UMa, RZ Leo, T Leo) all have X-ray emission, as well as the ROSAT identified CV RX J094432.1+035738, and our newly confirmed polar SDSS1700. Table 5 lists the objects and their RASS count rates. Since SDSS1446 has no polarization, yet is an X-ray source with strong He II emission, it may be an IP.
4 Conclusions
The 42 objects here combined with the 22 in Paper I give a total of 64 CVs from 325 plates or an areal density of about 0.03 deg-2. This represents a lower limit to the density of CVs, as not all possible CV candidates (by color) are targetted for spectra. In the future, we hope to use the plate overlap sections to accomplish identifications by a combination of variability and color that will provide us with a measure of completeness. However, even with the selection obtained, SDSS is picking up a wide variety of new CV systems, including those with high mass transfer rates (SW Sex stars) as well as the faintest systems with the lowest mass transfer rates and coolest white dwarfs yet found among CVs (Szkody et al. 2003). Of the 35 new discoveries reported here, about a third show characteristics that indicate they are likely candidates for having a magnetic white dwarf. Another third indicate very low mass transfer rates (from visibility of the underlying stars or from very large emission line fluxes and low continuum). From the followup data available for 26 of the systems, three have shown eclipses. The majority of the orbital periods determined so far are under the period gap, indicating that SDSS is predominantly finding the lowest mass transfer, shortest orbital period systems that brighter surveys have missed e.g. the PG survey (Green et al. 1982) and the Hamburg survey (Hagen et al. 1995). With an aperture of 3.5m, we are currently limited in followup work to systems brighter than 19th magnitude. It will take larger telescopes to determine the nature of the faintest CVs being found. However, by the end of the SDSS survey, we should have a clearer picture of the range of parameters and the distribution of types of CVs in the galaxy, including both high and low accretion rate systems.
References
- (1) Beers, T. C., Rossi, S., Ulrich, D., & Wilhelm, R. 1996, AJ, 112, 1188
- (2)
- (3) Berg, C., Wegner, G., Foltz, C. B., Chaffee, F. H., & Hewett, P. C. 1992, ApJS, 78, 409
- (4)
- (5) Berger, J. & Fringant, A. M. 1984, A&AS, 58, 565
- (6)
- (7) Bond, H, E., White, R. L., Becker, R. H., & O’Brien, M. S. 2002, PASP, 114, 1359
- (8)
- (9) Downes, R. A., Webbink, R. F., M. M., Ritter, H., Kolb, U. , & Duerbeck, H. W. 2001, PASP, 113, 764 (D01)
- (10)
- (11) Fan, X. 1999, AJ, 117, 2528
- (12)
- (13) Fukugita, M., Ichikawa, T., Gunn, J. E., Doi, M., Shimasaku, K., & Schneider, D. P. 1996, AJ, 111, 1748
- (14)
- (15) Green, R. F., Ferguson, D. H., Liebert, J., & Schmidt, M. 1982, PASP, 94, 560
- (16)
- (17) Gunn, J. E. et al. 1998, AJ, 116, 3040
- (18)
- (19) Hagen, H. J., Groote, D., Engels, D., & Reimers, D. 1995, A&AS, 111, 195
- (20)
- (21) Hoard, D. W., & Szkody, P. 1997, ApJ, 481, 433
- (22)
- (23) Hogg, D. W., Finkbeiner, D. P., Schlegel, D. J. & Gunn, J. E. 2001, AJ, 122, 2129
- (24)
- (25) Howell, S. B., Rappaport, S., & Politano, M. 1997, MNRAS, 287, 929
- (26)
- (27) Jiang, X. J., Engels, D., Wei, J. Y., Tesch, F., & Hu, J. Y. 2000, A&A, 362, 263 (J00)
- (28)
- (29) Lupton, R. H., Gunn, J. E., & Szalay, A. 1999, AJ, 118, 1406
- (30)
- (31) Lupton, R. H., Gunn, J. E., Ivezic, Z., Knapp, G. R., Kent, S. M., & Yasuda, N. 2002, ASP Conf. Ser. 238, 269
- (32)
- (33) Mennickent, R. E., & Tappert, C. 2001, A&A, 372, 563 (MT01)
- (34)
- (35) Patterson, J. 1984, ApJS, 54, 443
- (36)
- (37) Pier, J. R., Munn, J. A., Hindsley, R. B., Hennessy, G. S., Kent, S. M., Lupton, R. H., & Ivezic, Z. 2003, AJ, 125, 1559
- (38)
- (39) Ritter, H. & Kolb, U. 1998, A&AS, 129, 83
- (40)
- (41) Rodriguez-Gil, P., Casares, J., Martinez-Pais, I. G., Hakala, P., & Steeghs, D. 2001, ApJ, 548, 49L
- (42)
- (43) Shafter, A. W. 1983, ApJ, 267, 222
- (44)
- (45) Smith, J. A. et al. 2002, AJ, 123, 2121
- (46)
- (47) Stoughton, C. et al. 2002, AJ, 123, 485
- (48)
- (49) Szkody, P. et al. 2002, AJ, 123, 430 (Paper I)
- (50)
- (51) Szkody, P. et al. 2003, ApJ, 583, 902
- (52)
- (53) Voges, W. et al. 1999, A&A, 349, 389
- (54)
- (55) Voges, W. et al. 2000, IAUC 7432
- (56)
- (57) Warner, B. in Cataclysmic Variable Stars, 1995, CUP
- (58)
- (59) Wegner, G., & Boley, F. I. 1993, AJ, 105, 660
- (60)
- (61) Wolfe, M., Szkody, P., Fraser, O., Homer, L., Skinner, S., & Silvestri, N. M. 2003, PASP, submitted
- (62)
- (63) York, D. G. et al. 2000, AJ, 120, 1579
- (64)
| SDSSaaObjects marked with an asterisk are publicly available in the SDSS DR1 | DatebbUT date of spectrum in 2001 | CommentsccDN is a dwarf nova, ec is eclipsing, NL is a nova-like, H,L shows high and low brightness states, NP is not polarized | |||||
|---|---|---|---|---|---|---|---|
| J013132.39090122.3* | Sep 26 | 18.27 | 0.07 | 0.14 | 0.19 | 0.16 | PB 8928 |
| J013701.06091234.9* | Aug 26 | 18.69 | 0.27 | 0.23 | 0.41 | 0.29 | |
| J031051.66075500.3* | Jan 15 | 15.49 | 0.25 | 0.25 | 0.15 | 0.22 | DN |
| J040714.78064425.1* | Jan 01 | 17.75 | 0.26 | 0.32 | 0.36 | 0.28 | ec |
| J073817.75285519.7 | Nov 19 | 19.38 | 0.45 | 0.69 | 0.44 | 0.29 | |
| J075240.45362823.2* | Apr 18 | 17.68 | 0.22 | 0.16 | 0.04 | 0.03 | HeII |
| J080215.39401047.2ddObject is NE star of close pair | Oct 19 | 16.69 | 0.09 | 0.06 | 0.01 | 0.02 | NL KUV075894019 |
| J080908.39381406.2 | Dec 08 | 15.61 | 0.14 | 0.03 | 0.15 | 0.11 | HeII, SW Sex type |
| J084400.10023919.3 | Nov 11 | 18.34 | 0.13 | 0.39 | 0.38 | 0.26 | |
| J085107.39030834.4 | Nov 12 | 18.80 | 0.11 | 0.07 | 0.04 | 0.23 | CT Hya |
| J085344.00574841.0* | Jan 15 | 16.39 | 0.46 | 0.34 | 0.04 | 0.22 | BZ UMa |
| J090103.93480911.1 | Nov 25 | 19.26 | 0.07 | 0.11 | 0.14 | 0.14 | high i |
| J092009.54004244.9* | Jan 20 | 17.45 | 0.01 | 0.13 | 0.11 | 0.03 | ec |
| J093238.21010902.5* | Feb 25 | 20.31 | 0.58 | 0.72 | 0.45 | 0.01 | HeII |
| J094431.71035805.5 | Dec 23 | 16.80 | 0.34 | 0.60 | 0.53 | 0.31 | RX J0944.5+0357 |
| J101037.05024915.0* | Feb 17 | 20.76 | 0.38 | 0.37 | 0.35 | 0.30 | |
| J102347.67003841.2* | Feb 01 | 17.99 | 1.61 | 0.56 | 0.15 | 0.06 | FIRST J102347.6+003841 |
| J113722.25014858.6* | Mar 21 | 18.74 | 0.08 | 0.15 | 0.38 | 0.59 | RZ Leo |
| J113826.82032207.1* | Mar 21 | 14.85 | 0.17 | 0.28 | 0.08 | 0.24 | T Leo |
| J114628.80675909.7* | Feb 15 | 18.78 | 0.31 | 0.09 | 0.20 | 0.02 | |
| J123813.73033933.0* | Apr 01 | 17.82 | 0.06 | 0.05 | 0.15 | 0.07 | high i |
| J124325.92025547.5* | Apr 25 | 18.30 | 0.24 | 0.24 | 0.01 | 0.08 | |
| J125023.85665525.5* | Mar 20 | 18.70 | 0.02 | 0.02 | 0.05 | 0.11 | high i |
| J125834.74640823.1* | Dec 29 | 20.55 | 0.55 | 0.39 | 0.11 | 0.16 | |
| J125834.77663551.6* | Mar 20 | 20.20 | 0.07 | 0.06 | 0.02 | 0.36 | |
| J132723.39652854.3* | Mar 20 | 17.77 | 0.18 | 0.12 | 0.05 | 0.09 | ec,HeII, SW Sex type |
| J144659.95025330.3* | Apr 28 | 18.20 | 0.25 | 0.20 | 0.11 | 0.06 | HeII,NP |
| J145003.12584501.9* | May 27 | 20.64 | 0.08 | 0.23 | 0.32 | 0.03 | |
| J152857.86034911.7* | Apr 26 | 19.53 | 0.49 | 0.16 | 0.18 | 0.11 | |
| J155331.12551614.5* | May 27 | 18.49 | 1.51 | 1.06 | 0.40 | 1.00 | Polar |
| J163605.01465204.5 | Aug 23 | 16.72 | 0.13 | 0.13 | 0.11 | 0.09 | |
| J170053.30400357.6* | Jan 19 | 19.43 | 0.09 | 0.89 | 0.45 | 0.26 | Polar |
| J204448.92045928.8* | Aug 24 | 16.86 | 0.41 | 0.60 | 0.27 | 0.30 | |
| J204817.85061044.8* | Aug 24 | 19.35 | 0.17 | 0.10 | 0.06 | 0.29 | |
| J205017.84053626.8* | Sep 24 | 18.13 | 0.27 | 0.16 | 0.24 | 0.39 | HeII,H,L |
| J205914.87061220.5* | Sep 24 | 18.38 | 0.16 | 0.01 | 0.21 | 0.20 | |
| J210131.26105251.5 | Oct 25 | 18.08 | 0.23 | 0.01 | 0.10 | 0.05 | HeII,H,L |
| J215411.13090121.7 | Oct 20 | 19.19 | 0.15 | 0.01 | 0.05 | 0.04 | |
| J220553.98115553.7 | Nov 11 | 20.07 | 0.30 | 0.00 | 0.18 | 0.02 | |
| J223439.93004127.2 | Aug 22 | 18.10 | 0.19 | 0.19 | 0.13 | 0.32 | |
| J223843.84010820.7 | Aug 24 | 18.17 | 0.08 | 0.04 | 0.02 | 0.03 | HeII, Aqr 1 |
| J225831.18094931.7 | Dec 15 | 15.61 | 0.30 | 0.17 | 0.02 | 0.21 | PB 7412 |
| SDSS | UT Date | Site | Time (UT) | Exp (s) | Data Obtained |
|---|---|---|---|---|---|
| 0131 | 2002 Dec 29 | APO | 03:35-05:30 | 600 | 11 spectra |
| 0137 | 2003 Jan 4 | APO | 03:12-05:14 | 600/900 | 8 spectra |
| 0310 | 2001 Sep 19 | APO | 10:18-11:47 | 300 | 13 spectra at outburst |
| 0407 | 2001 Jan 16 | APO | 02:30-06:06 | 600 | 19 spectra |
| 0407 | 2001 Sep 17 | MRO | 10:30-12:37 | 600 | V filter photometry |
| 0407 | 2002 Nov 14 | NOFS | 04:47-10:18 | 180 | V photometry |
| 0407 | 2002 Dec 13 | NOFS | 03:13-07:07 | 120 | V photometry |
| 0738 | 2001 Dec 21 | APO | 10:10-12:20 | 900 | 8 spectra |
| 0752 | 2001 Oct 21 | APO | 10:23-12:18 | 900 | 7 spectra |
| 0809 | 2002 Jan 9 | APO | 10:04-12:55 | 300 | 27 spectra |
| 0901 | 2001 Dec 21 | APO | 07:45-09:58 | 900 | 8 spectra |
| 0920 | 2001 Mar 16 | APO | 07:48-09:07 | 600 | 7 spectra |
| 0920 | 2003 Feb 7 | NOFS | 06:18-11:49 | 120 | V photometry |
| 0920 | 2003 Feb 10 | NOFS | 05:47-11:40 | 120 | V photometry |
| 0944 | 2002 Jan 9 | APO | 07:37-09:55 | 300 | 22 spectra |
| 1023 | 2001 Dec 10 | APO | 08:57-10:50 | 600 | 10 spectra |
| 1137 | 2002 May 9 | APO | 02:58-05:27 | 600 | 14 red spectra |
| 1146 | 2003 Jan 4 | APO | 10:07-13:09 | 600/900 | 11 spectra |
| 1238 | 2001 Dec 21 | APO | 12:34-13:01 | 900/600 | 2 spectra |
| 1238 | 2002 Mar 25 | APO | 05:07-07:00 | 900 | 7 spectra |
| 1243 | 2002 May 9 | APO | 05:34-07:00 | 600 | 8 red spectra |
| 1250 | 2002 May 9 | APO | 07:24-09:45 | 900 | 10 spectra |
| 1446 | 2002 May 11 | SO | 07:22-08:12 | 3000 | spectropolarimetry |
| 1446 | 2002 Jun 15 | APO | 05:37-06:45 | 600 | 6 spectra |
| 1636 | 2002 Jul 16 | MRO | 06:33-10:23 | 600 | V filter photometry |
| 1700 | 2001 Aug 7 | MRO | 04:33-06:55 | 600 | V filter photometry |
| 1700 | 2001 Aug 9 | MRO | 04:25-07:17 | 600 | V filter photometry |
| 1700 | 2001 Aug 15 | MRO | 04:25-08:54 | 600 | V filter photometry |
| 1700 | 2001 Oct 17 | APO | 02:32-03:20 | 900/1200 | 2 spectra |
| 1700 | 2002 May 9 | APO | 09:51-11:04 | 600 | 7 red spectra |
| 1700 | 2002 May 11 | SO | 09:17-11:12 | 900 | spectropolarimetry |
| 2050 | 2002 Sep 7 | MRO | 04:00-06:19 | 600 | V filter photometry |
| 2050 | 2002 Sep 27 | APO | 04:47-06:36 | 900 | 7 spectra |
| 2101 | 2002 Oct 3 | APO | 05:07-06:26 | 600/900 | 6 spectra |
| 2234 | 2003 Jan 4 | APO | 01:05-03:02 | 600 | 11 spectra |
| 2238 | 2003 Sep 8 | MRO | 06:44-10:29 | 600 | unfiltered photometry |
| 2238 | 2002 Dec 29 | APO | 01:44-03:29 | 600/900 | 7 spectra |
| SDSS | Plate-Fiber | H | H | H | He4471 | HeII4686 | |||||
|---|---|---|---|---|---|---|---|---|---|---|---|
| F | EW | F | EW | F | EW | F | EW | F | EW | ||
| 0131 | 662-384 | 4.7 | 25 | 5.9 | 44 | 9.2 | 147 | 0.6 | 2 | ||
| 0137 | 662-552 | 1.5 | 12 | 2.3 | 21 | 3.4 | 38 | 0.4 | 3 | ||
| 0310 | 459-222 | 0.5 | 31 | 0.6 | 50 | 1.1 | 138 | ||||
| 0407 | 465-226 | 8.1 | 18 | 5.8 | 12 | 10.7 | 30 | ||||
| 0738 | 754-34 | 3.3 | 65 | 3.5 | 56 | 4.9 | 57 | 0.5 | 9 | ||
| 0752 | 543-65 | 2.8 | 24 | 2.4 | 26 | 2.0 | 35 | 0.7 | 6 | 1.4 | 14 |
| 0802 | 544-423 | 1.7 | 2 | 2.0 | 2 | 2.8 | 7 | ||||
| 0809 | 758-570 | 24 | 6 | 30 | 9 | 35 | 24 | 3.8 | 1 | 16 | 5 |
| 0844 | 564-197 | 9.6 | 73 | 10 | 88 | 9.4 | 101 | 2.3 | 18 | 0.7 | 6 |
| 0851 | 565-359 | 7.5 | 62 | 8.7 | 87 | 9.0 | 141 | 1.5 | 12 | ||
| 0853 | 483-332 | 108 | 76 | 143 | 124 | 171 | 195 | 31 | 22 | 11 | 9 |
| 0901 | 764-589 | 3.1 | 37 | 3.8 | 58 | 5.2 | 143 | 0.3 | 4 | ||
| 0920 | 473-98 | 2.4 | 35 | 3.0 | 46 | 4.1 | 91 | 0.5 | 7 | 0.7 | 10 |
| 0932 | 475-66 | 2.4 | 42 | 2.6 | 52 | 2.7 | 72 | 0.7 | 12 | 0.5 | 9 |
| 0944 | 570-512 | 16 | 47 | 18 | 50 | 19 | 39 | 2.8 | 8 | ||
| 1010 | 502-444 | 1.9 | 104 | 2.7 | 186 | 5.8 | 553 | 0.3 | 18 | ||
| 1023 | 272-461 | 16 | 9 | 8.3 | 6 | 13 | 14 | 8.7 | 5 | 7.8 | 5 |
| 1137 | 513-70 | 2.6 | 10 | 3.5 | 20 | 8.3 | 78 | ||||
| 1138 | 513-562 | 288 | 72 | 327 | 111 | 322 | 173 | 65 | 18 | 21 | 7 |
| 1146 | 492-454 | 7.2 | 62 | 7.7 | 80 | 8.2 | 120 | 1.5 | 13 | 0.5 | 5 |
| 1238 | 335-85 | 2.0 | 6 | 4.8 | 20 | 9.8 | 84 | 0.5 | 1.3 | ||
| 1243 | 522-325 | 21 | 89 | 23 | 114 | 23 | 169 | 4.3 | 21 | 1.2 | 6 |
| 1250 | 495-238 | 2.3 | 18 | 3.6 | 39 | 4.6 | 85 | 0.6 | 5 | ||
| 1258+64 | 602-264 | 1.1 | 10 | 1.2 | 14 | 1.4 | 32 | 0.4 | 5 | ||
| 1258+66 | 495-148 | 5.4 | 99 | 5.1 | 111 | 4.3 | 141 | 1.2 | 24 | 0.4 | 10 |
| 1327 | 496-83 | 7.0 | 31 | 6.9 | 32 | 6.4 | 51 | 2.9 | 13 | 4.0 | 18 |
| 1446 | 537-454 | 17 | 44 | 12 | 42 | 7.7 | 46 | 3.9 | 11 | 7.0 | 23 |
| 1450 | 610-349 | 0.7 | 36 | 1.5 | 100 | 2.6 | 346 | ||||
| 1528 | 592-601 | 4.2 | 46 | 4.2 | 60 | 4.1 | 98 | 1.0 | 12 | ||
| 1553 | 619-437 | 0.1 | 3 | ||||||||
| 1636 | 627-479 | 8.0 | 7 | 8.9 | 10 | 11 | 24 | 2.4 | 2 | 1.1 | 1 |
| 1700 | 633-574 | 2.5 | 10 | 2.9 | 12 | 2.8 | 16 | 0.4 | 1.6 | 4.0 | 1 |
| 2044 | 635-387 | 17 | 36 | 17 | 30 | 23 | 37 | 3.6 | 7 | ||
| 2048 | 635-127 | 0.9 | 16 | 1.8 | 42 | 2.7 | 103 | 0.2 | 3 | ||
| 2050 | 636-331 | 17 | 95 | 18 | 109 | 11 | 83 | 3.3 | 20 | 11 | 70 |
| 2059 | 636-599 | 8.1 | 76 | 7.9 | 79 | 7.8 | 101 | 1.9 | 18 | ||
| 2101 | 727-324 | 14 | 66 | 12 | 65 | 8.2 | 90 | 3.6 | 21 | 3.7 | 23 |
| 2154 | 716-299 | 1.3 | 6 | 1.8 | 11 | 1.7 | 21 | 0.4 | 2 | ||
| 2205 | 734-30 | 0.5 | 13 | 1.0 | 38 | 2.3 | 136 | ||||
| 2234 | 376-631 | 20 | 40 | 20 | 55 | 16 | 68 | 2.4 | 5 | ||
| 2238 | 377-540 | 2.1 | 8 | 2.6 | 13 | 3.1 | 34 | 0.3 | 1.5 | 0.7 | 3 |
| 2258 | 725-306 | 122 | 42 | 137 | 52 | 100 | 61 | 35 | 13 | 12 | 5 |
| SDSS | Line | P (min) | K (km/s) | T0 (JD245+) | MethodaadG = double Gaussian (value in parenthesis is separation in km/s), e = centroid in splot | ||
|---|---|---|---|---|---|---|---|
| 0131 | H | 98 | -631 | 295 | 2637.694 | 11 | dG (1400) |
| 0131 | H | 98 | 50.10.3 | 252 | 2637.696 | 5 | dG (1400) |
| 0137 | H | 86 | 212 | 11813 | 2643.687 | 16 | dG (1300) |
| 0137 | H | 80 | 482 | 988 | 2643.673 | 14 | dG (1500) |
| 0407 | H | 238 | 852 | 12215 | 1925.602 | 37 | dG (1700) |
| 0407 | H | 238 | 774 | 6929 | 1926.618 | 72 | dG (1400) |
| 0738 | H | 127 | 7516 | 17643 | 2264.916 | 51 | e |
| 0738 | H | 125 | 8412 | 26474 | 2264.962 | 100 | e |
| 0752 | H | 162 | 38 | 7815 | 2203.848 | 21 | dG (300) |
| 0809 | H | 143 | -141 | 1289 | 2283.967 | 28 | dG (1000) |
| 0809 | H | 143 | 1091 | 8414 | 2283.977 | 45 | dG (900) |
| 0944 | H | 195 | 113 | 695 | 2283.869 | 19 | e |
| 0944 | H | 195 | 875 | 11911 | 2283.850 | 37 | e |
| 1023 | H | 182 | -19414 | 19018 | 2253.841 | 36 | e |
| 1023 | H | 182 | -416 | 8424 | 2253.861 | 40 | e |
| 1137 | H | 113 | -252 | 12612 | 2403.677 | 30 | dG (2000) |
| 1146 | H | 99 | -242 | 12018 | 2643.960 | 38 | dG (2100) |
| 1146 | H | 95 | -2.80.2 | 6914 | 2643.964 | 31 | dG (2000) |
| 1238 | H | 76 | -3210 | 20241 | 2358.708 | 68 | e |
| 1238 | H | 76 | -652 | 939 | 2358.705 | 15 | e |
| 1700 | H | 115 | -663 | 896 | 2403.899 | 6 | e |
| 2050 | H | 138 | 863 | 3812 | 2544.748 | 18 | e |
| 2234 | H | 120 | -19.60.3 | 654 | 2643.524 | 7 | dG (1500) |
| 2234 | H | 124 | 23.50.3 | 1084 | 2643.523 | 8 | dG (1900) |
| 2238 | H | 121 | -1346 | 9914 | 2637.613 | 21 | dG (1300) |
| 2238 | H | 121 | -9116 | 14733 | 2637.625 | 29 | dG (2200) |
| SDSS | ROSAT (c s-1)aaFor a 2 keV bremsstrahlung spectrum, 1 c s-1 corresponds to a 0.1-2.4 keV flux of about 7 ergs cm-2 s-1 | Exp (sec) | RXS-J |
|---|---|---|---|
| 0853 | 0.410.04 | 394 | 085343.5+574846=BZ UMa |
| 0944 | 0.090.02 | 243 | 094432.1+035738 |
| 1137 | 0.030.01 | 243 | 113723.5+014847=RZ Leo |
| 1138 | 0.660.06 | 410 | 113826.8+032210=T Leo |
| 1146 | 0.0230.007 | 689 | 114631.3+675932 |
| 1243 | 0.1250.035 | 141 | 124326.5+025603 |
| 1258 | 0.030.01 | 477 | 125837.1+663608 |
| 1446 | 0.040.01 | 345 | 144700.9+025344 |
| 1700 | 0.070.01 | 744 | 170053.7+400354 |
| 2050 | 0.040.01 | 329 | 205018.4-053631 |
| 2258 | 0.170.04 | 145 | 225834.4-094945 |