Accepted 12 May 2003 for publication in the Astronomical Journal, scheduled for August 2003 issue.
The IRAS Revised Bright Galaxy Sample (RBGS)
Abstract
IRAS flux densities, redshifts, and infrared luminosities are reported for all sources identified in the IRAS Revised Bright Galaxy Sample (RBGS), a complete flux-limited survey of all extragalactic objects with total 60 m flux density greater than 5.24 Jy, covering the entire sky surveyed by IRAS at Galactic latitude . The RBGS includes 629 objects, with a median (mean) sample redshift of 0.0082 (0.0126) and a maximum redshift of 0.0876. The RBGS supersedes the previous two-part IRAS Bright Galaxy Samples (hereafter BGSBGS2), which were compiled before the final (“Pass 3”) calibration of the IRAS Level 1 Archive in May 1990. The RBGS also makes use of more accurate and consistent automated methods to measure the flux of objects with extended emission. The RBGS contains 39 objects which were not present in the BGSBGS2, and 28 objects from the BGSBGS2 have been dropped from RBGS because their revised 60 m flux densities are not greater than 5.24 Jy. Comparison of revised flux measurements for sources in both surveys shows that most flux differences are in the range %, although some faint sources at 12 m and 25 m differ by as much as a factor of 2. Basic properties of the RBGS sources are summarized, including estimated total infrared luminosities, as well as updates to cross-identifications with sources from optical galaxy catalogs established using the NASA/IPAC Extragalactic Database (NED). In addition, an atlas of images from the Digitized Sky Survey with overlays of the IRAS position uncertainty ellipse and annotated scale bars is provided for ease in visualizing the optical morphology in context with the angular and metric size of each object. The revised bolometric infrared luminosity function, , for infrared bright galaxies in the local Universe remains best fit by a double power law, , with below and above the “characteristic” infrared luminosity , respectively. A companion paper provides IRAS High Resolution (HIRES) processing of over 100 RBGS sources where improved spatial resolution often provides better IRAS source positions or allows for deconvolution of close galaxy pairs.
1 Introduction
This paper presents the complete list of objects contained in the IRAS Revised Bright Galaxy Sample (RBGS), a flux-limited sample of all extragalactic objects brighter than 5.24 Jy at 60 m, covering the entire sky surveyed by the Infrared Astronomical Satellite (IRAS ; Neugebauer et al. 1984) at Galactic latitude . The RBGS replaces the earlier IRAS Bright Galaxy Samples (BGSBGS2), which were compiled using the IRAS Point Source Catalog (PSC: 1988) along with other intermediate releases of the IRAS data products and are therefore now out of date with the more accurate “Pass 3” calibration 111“Pass 3” refers to the final calibration adopted for the archived IRAS data by the Infrared Processing and Analysis Center (IPAC) in 1990. Details of the calibration methods for each of the IRAS infrared bands, and the various IRAS catalogs and atlases can be found in the Explanatory Supplement to the IRAS Faint Source Survey (Moshir et al. 1992). adopted for the final release of the IRAS Level 1 Archive.
The RBGS objects are the brightest 60 m sources in the extragalactic infrared sky, and as such they remain the best sources for studying the infrared emission processes in galaxies and for comparison with extragalactic observations at other wavelengths. In this regard the RBGS can be considered the infrared equivalent of the 3CR survey of extragalactic radio sources. Most sources in the RBGS have extended IRAS flux densities that are underestimated by measurements in the IRAS PSC and in the Faint Source Catalog (FSC: Moshir et al. 1992), because the IRAS catalogs are the result of point-source filtering. Therefore, the RBGS should be the reference of choice for accurate IRAS fluxes and infrared luminosities of galaxies in the local Universe.
In this paper we report revised 12 m, 25 m, 60 m and 100 m total flux densities for all 629 infrared sources in the RBGS. Section 2 describes the methods used to select the objects. Details of the IRAS data processing are deferred to the Appendix. Section 3 presents the summary data for the RBGS objects, including the revised IRAS flux measurements, source size information, and derived infrared luminosities. Also included is an atlas of images from the Digitized Sky Survey with overlays of the IRAS position uncertainty ellipse and annotated scale bars; this is intended as a reference to visualize the optical morphology of the infrared source in context with the angular and metric size of each object, and more importantly, in the case of confused or double sources, to quickly see how large the IRAS position offset may be from the optical sources. Section 4 is a discussion of the general properties of the RBGS which includes a comparison of the revised measurements with those published previously, and a summary of the sky coverage, number counts, infrared colors, and infrared luminosity function. A companion paper (Surace, Sanders & Mazzarella 2003) provides High Resolution (HIRES) processing of 20% of the RBGS sources where it was thought that enhanced resolution might provide better source positions, or in the case of close galaxy pairs, allow deconvolution of the individual components.
2 Sample Selection and Data Processing
In constructing the RBGS, the basic methods used to extract candidate bright galaxies from the IRAS catalogs and to compute total fluxes in each of the four IRAS bands using ADDSCAN/SCANPI (hereafter referred to as SCANPI; Helou et al. 1988) were similar to procedures used in earlier compilations of the IRAS BGS (here referred to as BGS1: Soifer et al 1989, 1987, 1986) and the IRAS BGS–Part II (here referred to as BGS2: Sanders et al 1995); the reader is referred to these papers for historical perspective as well as for a more thorough description of original sample membership criteria. In this paper we outline the major steps that were followed to construct the new sample, and where appropriate, emphasize the differences between the earlier BGSBGS2 procedures and the more refined RBGS processing.
The IRAS FSC and IRAS PSC were used as starting points for the initial search of the IRAS data archive. It was necessary to use the PSC because the FSC does not include objects in confused regions of the infrared sky with Galactic latitude . The FSC Rejects (FSCR) 222The FSCR, along with all other IRAS catalogs, is available for queries through the GATOR service of the Infrared Science Archive (IRSA) at IPAC; http://irsa.ipac.caltech.edu/. The FSCR contains objects that have only one IRAS hours-confirmed (HCON) observation; however, IRAS measurements in the FSCR are much more reliable when a high signal-to-noise detection is combined with confirmation via positional cross-identification with a known source detected at another wavelength. were also examined for bright objects at 60 m. In the end, the only source accepted from the FSCR is NGC 4151 (IRAS Z12080+3940). The reasons for its inclusion in RBGS are: a) the SCANPI signals in all 4 IRAS bands are very strong (see Table 1); b) the FIR signal is positionally coincident with the optical galaxy, and the coadded scan profile from ADDSCAN/SCANPI is consistent with the optical size of the galaxy; c) the IRAS SCANPI flux density values at 12 m and 25 m are comparable (slightly higher, as expected given some extended flux) to independent ground-based measurements at 10.6 m and 21 m in apertures centered on the nucleus (Lebofsky & Rieke 1979).
A second step involved another search of the IRAS PSC and FSC, this time with a lower 60 m point source threshold of 4.5 Jy, which was designed primarily for the purpose of capturing sources that might have a reasonable chance of having extended flux sufficient to bring their total 60 m flux densities above the RBGS threshold. To investigate how many objects with total 60 m flux density greater than 5.24 Jy may be “hiding” among objects with even fainter point-source components, a few dozen galaxies randomly selected from the FSC with were also coadded with SCANPI. These objects were not found to contain sufficient extended emission to bring their total fluxes above the RBGS flux limit. Searches of NED for optical galaxies larger than 4 arcminutes, without regard for their (likely underestimated) flux measurements from the IRAS catalogs, were also performed to obtain additional candidates. However, objects with total among these large optical galaxies objects were also recovered in the IRAS catalog searches noted above. This provides confidence that our procedures resulted in a sample with a very high level of completeness at 60 m.
All candidate IRAS sources were compared with the latest catalog cross-correlations available in the NASA/IPAC Extragalactic Database (NED)333NED is available at http://ned.ipac.caltech.edu/., which were then inspected using overlays on the DSS1 images. The data were then reprocessed (co-addition of all acceptable IRAS scans) using SCANPI, and the resulting 1-D coadded scan profiles were visually inspected to determine the amount of extended emission, and in the case of blended or confused sources, to determine the best method for computing the total flux density. A computer program was written to determine objectively and consistently whether the total flux density of each source is better represented by the baseline zero-crossing method , the value integrated within the nominal IRAS detector size , the point source template fit amplitude (“template”), or the peak flux in the profile (“peak”). This was accomplished by checking whether the value is significantly larger than the template fit and peak values (considering also the RMS noise in the coadded scan outside the detected signal range), and if so whether the value is significantly larger than the value. This procedure, combined with comparisons of the coadded scan profile widths at 25% (“W25”) and 50% (“W50”) of the peak flux with the nominal beam size (point-spread function), was also used to determine whether each IRAS source is resolved, marginally extended or unresolved. All measurements were performed using SCANPI’s median (1002) method of coadding the individual IRAS scans, and all sources with 60 m point source flux greater than 5.24 Jy (the completeness limit of the original BGS) were included in the final sample.
Appendix A gives more details regarding the various methods used for setting thresholds to select between the flux density estimators and for estimating the total flux densities of the extended sources, and provides a tabular listing of all key SCANPI measurements in each IRAS band, as well as the ratio of the new RBGS total flux density measurements compared with the old values reported in the BGSBGS2 (where available). Example coadded scan profiles are also plotted to illustrate the extent of IRAS emission compared to the point spread function and to show how different flux measurement methods were objectively selected in the automated SCANPI reprocessing of the data for all potential RBGS sources.
Finally, IRAS flux measurements from the “Catalog of IRAS Observations of Large Optical Galaxies” (Rice et al. 1988) and “An Atlas of High-Resolution IRAS Maps of Nearby Galaxies” (Rice 1993) were examined. Careful comparison of flux densities integrated within the signal range between SCANPI’s baseline fit zero-crossing points, , to those measured by Rice et al. from IRAS 2-D image products showed generally good agreement for galaxies with optical diameters smaller than about 25 arcminutes. For objects with optical diameters larger than 25 arcminutes it is clear that even SCANPI’s method systematically underestimates the total flux density compared to the 2-D method used by Rice. Therefore, to maintain consistency with other objects in the RBGS to the highest degree possible, in the final compilation we adopted Rice et al. measurements over those from SCANPI’s estimator only for objects larger than 25 arcminutes; such objects are flagged in Table 1.
3 The IRAS RBGS Data
Table 1 presents the summary data for all of the sources in the IRAS RBGS. The complete sample contains 629 galaxies that met our threshold criteria of Jy. The column entries are as follows:
(1) Common Name – Common name taken in decreasing priority order from the NGC, UGC, ESO, IC, A, MCG, CGCG, Zwicky compact galaxies, Markarian, and IRAS catalogs. “N” follows the common name for “new” RBGS objects which were not included in the compilation of the BGS1 (Soifer et al. 1989) or BGS2 (Sanders et al. 1995); “1” flags objects from the BGS1, and “2” flags objects from the BGS2.
(2) IRAS Name – Names from the IRAS Faint Source Catalog (FSC) are given using the standard “F” prefix; if the source is not in the FSC, the name from the Point Source Catalog (PSC) is given, which has no letter prefix. IRAS source names are based on equinox B1950.0 coordinates. Names from the IRAS Faint Source Catalog Rejects (FSCR) are given using the standard “Z” prefix. (NGC 4151 is the only FSCR object in the RBGS; see Section 2.) IRAS catalog names are not listed for a few very large galaxies (indicated by “ —”) because entries in the IRAS catalogs do not represent the total flux and generally correspond only to the nucleus or other bright component. Flags following the IRAS name are as follows: “R” indicates large galaxies with for which total flux densities derived from IRAS images were published by Rice et al. (1988) or Rice (1993); the Rice et al. values are adopted here only in cases listing an “R” value for the Method code in columns (8) – (11); see text for details. “ *” identifies objects located in regions of the Milky Way, LMC, or SMC with high source confusion. [Note: The objects are listed in order of increasing B1950 right ascension (R.A.), as reflected in the source names from the IRAS catalogs; this places some objects out of order in terms of their J2000 coordinates.]
(3–4) R.A., Dec – Equinox J2000.0 R.A. and declination (Dec), transformed from equinox B1950.0 coordinates published in the IRAS FSC (Version 2.0) or PSC (Version 2), as indicated in Col. (2). These coordinates correspond to the centroid of the IRAS positional uncertainty ellipse as superimposed on the Digitized Sky Survey fields shown in Figure 1. Exceptions are for the large galaxies NGC 55, SMC, NGC 300, LMC, NGC 6744, and NGC 6822 whose positions are taken from Rice et al. (1988).
(5–6) ,b – Galactic latitude and longitude in decimal degrees.
(7) HIRES code – IRAS HIRES code from Surace, Sanders & Mazzarella (2003). A listing here indicates that the infrared source contains two or more objects that were confused in one or more of the IRAS detectors. The high-resolution image restoration algorithm HIRES (Aumann, Fowler, & Melnyk 1990) was applied to these sources in an attempt to resolve flux from individual galaxies. “R” means the source was resolved into two or more components, resulting in new IRAS positions and fluxes; “*” means the source was resolved, but the IRAS position lies between the two galaxies as seen on the DSS; “S” means the source was partially resolved into two or more components, and fluxes were estimated for each object, but no new reliable positions were derived; “U” means HIRES was unsuccessful at resolving separate components. See Surace et al. (2003) for detailed HIRES results for these objects. For consistency, the fluxes listed in Table 1 were derived using SCANPI in the same manner as the single objects in the table. There are known calibration problems with the HIRES data product (Surace et al. 1993), and while the flux ratio between individual galaxies within a system can be more accurately measured using HIRES, the absolute calibration of the galaxy system flux is better determined by SCANPI. Since in many cases a single galaxy dominates the far-infrared flux of a multiple galaxy system, there are only a handful of systems that would have not been selected in the RBGS but which are included by virtue of having an integrated flux above the selection limit.
(8–11) Flux Densities – Total IRAS flux densities (Jy) in the 12 m, 25 m, 60 m, and 100 m bands, respectively. Following each flux density value are the uncertainty (1 in mJy) followed by three code letters (SMF) indicating the infrared Size (U = “unresolved”, M = “marginally extended”, R = “resolved”); the Method chosen as the best flux estimate from SCANPI (Z = “zero crossing”, I = “in-band total”, T = “template fit”, P = “peak value”, S = “deconvolution with SCLEAN” (see Appendix), R = from Rice et al. (1988); and a Flag indicating the type of confusion (c = “cirrus”, g = “nearby galaxy”, n = “excessive noise”, b = “blended objects”) causing large uncertainty as indicated by a colon (“:”) prefix on the flux density. Note that some large galaxies flagged with “R” in Col. (2) have new SCANPI zero-crossing estimates, indicated here using “Z” for the second flag, which are judged to have more accurate calibration than previously adopted values from Rice et al. (1988).
(12) cz – The Heliocentric radial velocity (km s-1) of the IRAS source computed as times the redshift . The source for the redshift is given in Col. (2) of Table 2 as a 19 digit reference code from NED. In cases where either a millimeter (e.g. CO) or HI 21-cm line measurement has been reported we have chosen to adopt these redshifts given that they better reflect the systemic velocity of the galaxy, as opposed to optical measurements which are often biased (typically blue-shifted) due to optical depth effects.
(13) Distance – The estimated source distance in Mpc; metric (“proper”) distance is listed, not luminosity distance. For most objects this was calculated from using the cosmic attractor model outlined in Appendix A of Mould et al. (2000), using and adopting a flat cosmology in which and (which corresponds to ). Superscripts are defined as follows: “ P” indicates the distance is not computed by correcting the heliocentric redshift using the cosmic attractor model, but comes from a direct primary distance measurement; “S” flags a direct secondary distance measurement; “V” indicates that the cosmic attractor flow model places the object within the Virgo cluster at a distance of 15.3 Mpc; “G” indicates that the cosmic attractor flow model places the object within the Great Attractor. References for the adopted primary and secondary distance indicators are Freedman et al. (2001), Madore & Freedman (1998), Ferrarese et al. (2000), Mould et al. (1991), Tully & Shaya (1984), Aaronson & Mould (1983), Aaronson et al. 1982, and Aaronson, Mould & Huchra (1980).
(14–15) Luminosities – The base10 logarithm of the far-infrared luminosity, , determined using the prescription described in Appendix B of Cataloged Galaxies and Quasars Observed in the IRAS Survey (1989), and the infrared luminosity, , determined using the fluxes in all four IRAS bands (Perault 1987; see also Table 1 in Sanders & Mirabel 1996), in units of solar bolometric luminosity, erg s-1.
(16) Rank – The object’s sequential rank in the distribution of values, where 1 is the most luminous source.
(17) Other Names – Other names from catalogs of interacting galaxies (IG) or active galactic nuclei (AGN). Spaces between catalog name prefix and number (as standard in NED) are omitted here to save space.
![[Uncaptioned image]](/html/astro-ph/0306263/assets/x1.png)
![[Uncaptioned image]](/html/astro-ph/0306263/assets/x2.png)
![[Uncaptioned image]](/html/astro-ph/0306263/assets/x3.png)
![[Uncaptioned image]](/html/astro-ph/0306263/assets/x4.png)
![[Uncaptioned image]](/html/astro-ph/0306263/assets/x5.png)
![[Uncaptioned image]](/html/astro-ph/0306263/assets/x6.png)
![[Uncaptioned image]](/html/astro-ph/0306263/assets/x7.png)
![[Uncaptioned image]](/html/astro-ph/0306263/assets/x8.png)
![[Uncaptioned image]](/html/astro-ph/0306263/assets/x9.png)
![[Uncaptioned image]](/html/astro-ph/0306263/assets/x10.png)
![[Uncaptioned image]](/html/astro-ph/0306263/assets/x11.png)
![[Uncaptioned image]](/html/astro-ph/0306263/assets/x12.png)
![[Uncaptioned image]](/html/astro-ph/0306263/assets/x13.png)
3.1 Annotated Images from the Digitized Sky Survey
Figure 1 presents images extracted from the Digitized Sky Survey (DSS1)444 The Digitized Sky Survey was produced at the Space Telescope Science Institute under U.S. Government grant NAG W-2166. The images of these surveys are based on photographic data obtained using the Oschin Schmidt Telescope on Palomar Mountain and the UK Schmidt Telescope. The plates were processed into the present compressed digital form with the permission of these institutions. for all objects in the RBGS. They are intended to quickly visualize the optical morphology in context with the angular and metric size of each object. Horizontal bars on the bottom of each plot show the angular scale labeled in arcminutes, and vertical bars on the lower right side of each plot show the metric scale labeled in kiloparsecs. Metric sizes are derived using the source distance estimates listed in Table 1. The ellipses represent 3-sigma uncertainties in the IRAS positions from the FSC and PSC. Note that for the LMC and SMC, no ellipse is shown because there is no point source from the FSC or PSC corresponding to the “center” of these large, diffuse galaxies. In general there is very good agreement between the IRAS catalog source position and the coordinates of the optical galaxy. A notable exception is the position of IRAS 10574-6603 taken from the PSC, which has a large offset from the optical galaxy ESO 093-G003. The fact that this offset is in the direction of the major axis of the IRAS positional uncertainty ellipse (PA = 150∘), and that SCANPI shows a peak in the IRAS emission that is coincident with the position of the optical galaxy, confirms this cross-identification. In some cases the IRAS source position is located between components of optical pairs or groups of galaxies. This is a clear indication that more than one galaxy contributes significantly to the IRAS emission. Such objects (e.g., AM 0702-601, ESO 297-G011/12, IC 563/4, NGC 7465) are a subset of the pairs and groups investigated using HIRES processing of the IRAS data (Surace, Sanders & Mazzarella 2003), which are flagged by “(H)” following the object names in Figure 1.
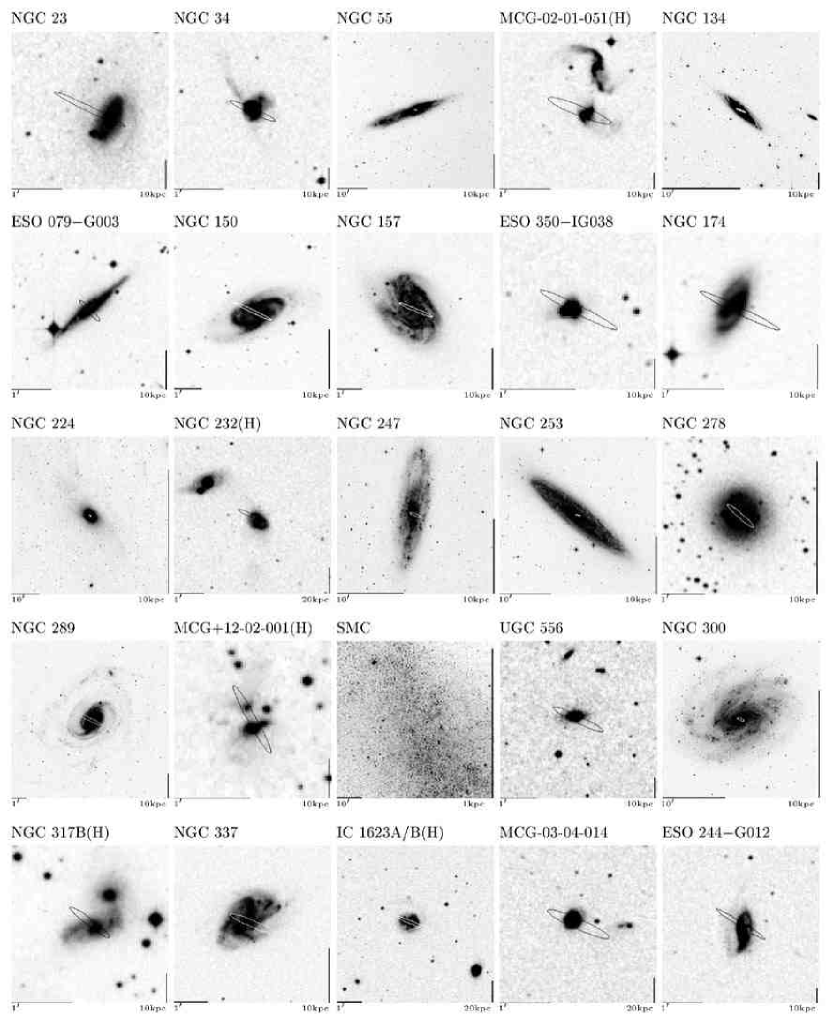
Pages 1-26 of Figure 1: http://nedwww.ipac.caltech.edu/level5/March03/IRAS_RBGS/Figures/ (Fig1p*.ps.gz).
3.2 Revisions from the Original BGS1 and BGS2
Table 2 is a list of objects from the BGSBGS2 that have been omitted from the RBGS because their revised 60 m flux density is less than or equal to 5.24 Jy. The table caption explains why some of these objects were listed with Jy in BGS1.
| Name | Revised | Status |
|---|---|---|
| NGC 0578 | aaThese objects were listed in Table 1(b) of (Soifer et al. 1989) as having . However, they were also included in the main catalog listing [Table 1(a)], because of their presence in an earlier compilation (Soifer et al. 1987). Since some readers may have been confused regarding the status of these objects, these sources are listed here again and omitted in Table 1 of this work to clarify their status. | |
| NGC 1012 | ||
| NGC 1141/2 | aaThese objects were listed in Table 1(b) of (Soifer et al. 1989) as having . However, they were also included in the main catalog listing [Table 1(a)], because of their presence in an earlier compilation (Soifer et al. 1987). Since some readers may have been confused regarding the status of these objects, these sources are listed here again and omitted in Table 1 of this work to clarify their status. | |
| UGC 2789 | ||
| ESO 484-G036 | ; named IR 0433-25 in | |
| VII Zw 019 | ||
| IRAS F00555+7614 | ; named IR 00555+7614 in | |
| IRAS F06035-7102 | ; named IR 06035-7102 in | |
| NGC 2820 | aaThese objects were listed in Table 1(b) of (Soifer et al. 1989) as having . However, they were also included in the main catalog listing [Table 1(a)], because of their presence in an earlier compilation (Soifer et al. 1987). Since some readers may have been confused regarding the status of these objects, these sources are listed here again and omitted in Table 1 of this work to clarify their status. | |
| NGC 2990 | ||
| NGC 3353 | ||
| ESO 174-G005 | ||
| NGC 4395 | aaThese objects were listed in Table 1(b) of (Soifer et al. 1989) as having . However, they were also included in the main catalog listing [Table 1(a)], because of their presence in an earlier compilation (Soifer et al. 1987). Since some readers may have been confused regarding the status of these objects, these sources are listed here again and omitted in Table 1 of this work to clarify their status. | |
| NGC 4438 | aaThese objects were listed in Table 1(b) of (Soifer et al. 1989) as having . However, they were also included in the main catalog listing [Table 1(a)], because of their presence in an earlier compilation (Soifer et al. 1987). Since some readers may have been confused regarding the status of these objects, these sources are listed here again and omitted in Table 1 of this work to clarify their status. | |
| NGC 4594 | aaThese objects were listed in Table 1(b) of (Soifer et al. 1989) as having . However, they were also included in the main catalog listing [Table 1(a)], because of their presence in an earlier compilation (Soifer et al. 1987). Since some readers may have been confused regarding the status of these objects, these sources are listed here again and omitted in Table 1 of this work to clarify their status. | |
| NGC 4618 | aaThese objects were listed in Table 1(b) of (Soifer et al. 1989) as having . However, they were also included in the main catalog listing [Table 1(a)], because of their presence in an earlier compilation (Soifer et al. 1987). Since some readers may have been confused regarding the status of these objects, these sources are listed here again and omitted in Table 1 of this work to clarify their status. | |
| MCG +08-23-097 | aaThese objects were listed in Table 1(b) of (Soifer et al. 1989) as having . However, they were also included in the main catalog listing [Table 1(a)], because of their presence in an earlier compilation (Soifer et al. 1987). Since some readers may have been confused regarding the status of these objects, these sources are listed here again and omitted in Table 1 of this work to clarify their status. | |
| ESO 383-G027 | ||
| UGC 09668 | ||
| IRAS F15335-0513 | ; named IR 1533-05 in | |
| IRAS 18587-1653 | ||
| AM 1925-724 | ||
| IRAS 19279+3534 | ||
| IRAS 20100-4156 | ||
| IC 4946 | ; named A2020-44 in | |
| NGC 6015 | aaThese objects were listed in Table 1(b) of (Soifer et al. 1989) as having . However, they were also included in the main catalog listing [Table 1(a)], because of their presence in an earlier compilation (Soifer et al. 1987). Since some readers may have been confused regarding the status of these objects, these sources are listed here again and omitted in Table 1 of this work to clarify their status. | |
| NGC 6070 | aaThese objects were listed in Table 1(b) of (Soifer et al. 1989) as having . However, they were also included in the main catalog listing [Table 1(a)], because of their presence in an earlier compilation (Soifer et al. 1987). Since some readers may have been confused regarding the status of these objects, these sources are listed here again and omitted in Table 1 of this work to clarify their status. | |
| NGC 7673 | aaThese objects were listed in Table 1(b) of (Soifer et al. 1989) as having . However, they were also included in the main catalog listing [Table 1(a)], because of their presence in an earlier compilation (Soifer et al. 1987). Since some readers may have been confused regarding the status of these objects, these sources are listed here again and omitted in Table 1 of this work to clarify their status. | |
Table 3 is a list of objects from the BGSBGS2 which have revised cross-identifications in various catalogs. These corrected, revised cross-identifications were determined by visualizing the IRAS uncertainty ellipses superimposed on the DSS images (Figure 1), and by using current information available in NED.
| Name | Status |
|---|---|
| MCG -02-01-051/2 (Arp 256) | IRAS emission identified with MCG -02-01-051 in aaIRAS centroid is on the SE component of the pair, but both galaxies are within the IRAS beam (Fig. 1); see also Surace, Sanders & Mazzarella 2003. |
| SMC | Named A0051-73 in (not recognized by NED) |
| NGC 0317B | IRAS emission identified with pair NGC 317A/B in bbIRAS centroid is clearly on the SE component of NGC 317; see Fig. 1. |
| CGCG 436-030 | Named MCG +02-04-035 in (same object) |
| NGC 0716 | Named UGC 1351 in (same object) |
| ESO 297-G011/12 | IRAS emission identified with largest galaxy in the pair (NGC 633 ESO 297-G011) in ccIRAS centroid is clearly between the NW (NGC 633 = ESO 297-G011) and SE (ESO 297-G012) pair components; see Fig. 1. |
| IC 0214 | Named UGC 1720 in (same object) |
| IRAS F03217+4023 | Named IRAS 03217+4022 in (same object) |
| CGCG 465-012 | Named Zw 465.012 in (same object) |
| ESO 550-IG02 | Named MCG -03-12-002 in (same object) |
| ESO 485-G003 | Named MCG -04-12-003 in (same object) |
| ESO 491-G020/021 | Named ESO 491-G020 in (same object) |
| CGCG 011-076 | Named MCG +00-29-023 in (same object) |
| NGC 4175 | Mistakenly named NGC 4174 (12h12m26.9s, +29d08m58s J2000) in |
| NGC 2798 | IRAS emission identified with NGC 2799 (SE companion) in |
| MCG +08-18-013 | IRAS emission identified with MCG +08-18-012 (SW companion) in |
| IC 2810 | Named UGC 6436 in (same object) |
| NGC 3994/5 | IRAS emission identified with NGC 3994 in ddIRAS centroid is clearly between SW (NGC 3994) and NE (NGC 3995) pair components; see Fig. 1. |
| NGC 4568/7 | IRAS emission identified with NGC 4568 (SE component of pair) in |
| NGC 4793 | Mistakenly named NGC 4783 (12h54m36.6s, -12d33m28s J2000) in |
| CGCG 043-099 | Named MCG +01-33-036 in (same object) |
| MCG -02-33-098/9 | Named MCG -02-33-098 in ; IRAS emission dominated by MCG -02-33-098 |
| MCG -03-34-014 | Named A1309-17 in (not recognized by NED) |
| VV 250a | IRAS emission identified with UGC 8335 = VV 250 in eeIRAS centroid is clearly dominated by VV 250a = MCG +10-19-057; see Fig. 1. |
| MCG -03-34-064 | IRAS emission identified with MCG -03-34-063 in |
| NGC 5257/8 | IRAS emission identified with NGC 5257 in ffIRAS centroid is clearly between NGC 5257/8; see Figure 1. |
| CGCG 247-020 | Named Zw 247.020 in (same object) |
| NGC 5665 | Mistakenly named NGC 5663 (14h33m56.3s, -16d34m52s J2000) in |
| VV 340a | IRAS emission identified with UGC 9618 = VV 340 in ggIRAS centroid is clearly dominated by VV 340a = MCG +04-35-019; see Fig. 1. |
| CGCG 049-057 | Named Zw 049.057 in (same object) |
| VV 705 | Named I Zw 107 in (same object) |
| NGC 5930 | IRAS emission identified with NGC 5929 in hhNGC 5929 is the SW companion of the dominant IRAS source NGC 5930; see Fig. 1. |
| CGCG 052-037 | Mistakenly named MCG +01-42-088 in (no such object in NED) |
| NGC 6286 | IRAS emission identified with NGC 6285/6 in |
| CGCG 083-025 | Named Zw 083.025 in (same object) |
| CGCG 141-034 | Named Zw 141.034 in (same object) |
| NGC 6621 | IRAS emission identified with NGC 6621/22 in |
| CGCG 142-034 | Named Zw 142.034 in (same object) |
| IC 4946 | Named A2020-44 in ((not recognized by NED) |
| CGCG 448-020 | Named Zw 448.020 in (same object) |
| ESO 602-G025 | Named MCG -03-57-017 in (same object) |
| CGCG 453-062 | Named Zw 453.062 in (same object) |
| IC 5298 | Named Zw 475.056 in (same object) |
Table 4 is a summary of the 39 objects which are new members of the RBGS. These objects were missed during compilation of the BGSBGS2 for a variety of reasons. Their presence in the RBGS is the result of comprehensive searches utilizing NED in conjunction with queries of the IRAS catalogs, followed by examination of the IRAS scan data using SCANPI.
| Name | Revised | Status |
|---|---|---|
| NGC 0289 | 5.47 | Found in IRAS PSC/FSC and confirmed with SCANPI |
| NGC 0300 | 15.30 | Large optical galaxy (Rice et al. 1993)aaSCANPI profile zero-crossing size is comparable to optical size of the galaxy, and SCANPI and values are larger than or comparable to those of Rice et al. (1988) and Rice (1993), so SCANPI zero-crossing values are adopted in RBGS for this object. |
| NGC 0925 | 7.82 | Large optical galaxy (Rice et al. 1988)aaSCANPI profile zero-crossing size is comparable to optical size of the galaxy, and SCANPI and values are larger than or comparable to those of Rice et al. (1988) and Rice (1993), so SCANPI zero-crossing values are adopted in RBGS for this object. |
| IC 0356 | 6.77 | Found in IRAS PSC/FSC and confirmed with SCANPI |
| NGC 1532 | 9.63 | Found in IRAS PSC/FSC and confirmed with SCANPI |
| CGCG 468-002 | 9.66 | Orion region with high Galactic foreground confusion (see Fig. 5) |
| NGC 1819 | 6.85 | Orion region with high Galactic foreground confusion (see Fig. 5) |
| IRAS F05170+0535 | 14.4 | Orion region with high Galactic foreground confusion (see Fig. 5) |
| IRAS F05405+0035 | 7.03 | Orion region with high Galactic foreground confusion (see Fig. 5) |
| UGCA 116 | 6.57 | Orion region with high Galactic foreground confusion (see Fig. 5) |
| IRAS F06076-2139 | 6.43 | Orion region with high Galactic foreground confusion (see Fig. 5) |
| IC 2163 | 17.55 | Orion region with high Galactic foreground confusion (see Fig. 5) |
| UGCA 127 | 17.61 | Orion region with high Galactic foreground confusion (see Fig. 5) |
| UGCA 128 | 5.38 | Orion region with high Galactic foreground confusion (see Fig. 5) |
| NGC 2221 | 6.41 | Found in IRAS PSC/FSC and confirmed with SCANPI |
| ESO 557-G002 | 7.42 | Orion region with high Galactic foreground confusion (see Fig. 5) |
| AM 0702-601 | 6.70 | Found in IRAS PSC/FSC and confirmed with SCANPI |
| UGCA 150 | 6.03 | Found in IRAS PSC/FSC and confirmed with SCANPI |
| NGC 2992 | 7.51 | Each component of NGC 2992/3 has Jy |
| IC 2522 | 6.47 | Found in IRAS PSC/FSC and confirmed with SCANPI |
| NGC 3125 | 5.33 | Found in IRAS PSC/FSC and confirmed with SCANPI |
| NGC 3732 | 5.36 | Found in IRAS PSC/FSC and confirmed with SCANPI |
| NGC 4151 | 6.46 | Found in IRAS FSC Rejects (IRAS Z12080+3940) and confirmed with SCANPI |
| NGC 4217 | 11.60 | Found in IRAS PSC/FSC and confirmed with SCANPI |
| NGC 4437 | 7.87 | Large optical galaxy (Rice et al. 1988)aaSCANPI profile zero-crossing size is comparable to optical size of the galaxy, and SCANPI and values are larger than or comparable to those of Rice et al. (1988) and Rice (1993), so SCANPI zero-crossing values are adopted in RBGS for this object. |
| NGC 5010 | 10.29 | Found in IRAS PSC/FSC and confirmed with SCANPI |
| NGC 5068 | 12.50 | Found in IRAS PSC/FSC and confirmed with SCANPI |
| NGC 5331 | 5.86 | In Soifer et al. (1987) sample but dropped in |
| NGC 5483 | 6.30 | Found in IRAS PSC/FSC and confirmed with SCANPI |
| UGCA 394 | 5.83 | Found in IRAS PSC/FSC and confirmed with SCANPI |
| IRAS 16399-0937 | 8.42 | Found in IRAS PSC/FSC and confirmed with SCANPI |
| NGC 6744 | 18.92 | Large optical galaxy (Rice et al. 1988)aaSCANPI profile zero-crossing size is comparable to optical size of the galaxy, and SCANPI and values are larger than or comparable to those of Rice et al. (1988) and Rice (1993), so SCANPI zero-crossing values are adopted in RBGS for this object. |
| NGC 6786/UGC 11415 | 7.58 | Found in IRAS PSC/FSC and confirmed with SCANPI |
| NGC 6822 | 47.63 | Large optical galaxy (Rice et al. 1988)aaSCANPI profile zero-crossing size is comparable to optical size of the galaxy, and SCANPI and values are larger than or comparable to those of Rice et al. (1988) and Rice (1993), so SCANPI zero-crossing values are adopted in RBGS for this object. |
| IRAS 19542+1110 | 6.18 | Found in IRAS PSC/FSC and confirmed with SCANPI |
| NGC 7331 | 45.00 | Large optical galaxy (Rice et al. 1988)aaSCANPI profile zero-crossing size is comparable to optical size of the galaxy, and SCANPI and values are larger than or comparable to those of Rice et al. (1988) and Rice (1993), so SCANPI zero-crossing values are adopted in RBGS for this object. |
| NGC 7418 | 6.67 | Found in IRAS PSC/FSC and confirmed with SCANPI |
| MCG -01-60-022 | 5.39 | Found in IRAS PSC/FSC and confirmed with SCANPI |
| NGC 7752/3 | 5.79 | Found in IRAS PSC/FSC and confirmed with SCANPI |
4 Discussion
The main purpose for compiling the RBGS was to produce a more accurate and complete list of IRAS bright galaxies, one that both incorporates the improved final calibration of the IRAS Level 1 Archive and one that makes use of the best available SCANPI tools to more accurately compute total IRAS flux densities in all four IRAS wavebands. Just as important was the desire to provide a more accurate assessment of the various sources of uncertainty (e.g. source confusion, cirrus contamination, etc.) in the final list of tabulated flux densities. This was not always clear in the earlier published versions of the BGSBGS2. The reader can use the flags in the RBGS tables to decide when it may be desirable to use the SCANPI tool available through the Infrared Science Archive (IRSA) at IPAC 555See http://irsa.ipac.caltech.edu/. for a direct visual inspection of the scan profiles. Also, rather than leave it to the reader to compute infrared luminosities for each source, we have attempted to compile the most recent and accurate redshifts from the literature. We then list the adopted source distances which have been used to compute total far-infrared (using IRAS bands 3 and 4) and infrared (all 4 IRAS bands) luminosities according to standardized prescriptions that are now widely adopted in the literature (e.g., Sanders & Mirabel 1996).
We begin the discussion of the RBGS data by first providing a detailed comparison of how the “new” IRAS flux densities compare with the “old” previously published values. This is followed by a discussion of the survey sky coverage and distribution of sources on the sky, plus a discussion of the completeness of the survey in all four IRAS bands. Various properties of the RBGS are then discussed, ending with the presentation of the new infrared luminosity function for IRAS bright galaxies selected at 60 m.
4.1 Comparison Between Revised and Previous Flux Density Measurements
Figure 2 shows the ratio of the new RBGS total flux density measurements to the previously published BGSBGS2 measurements versus the new total flux density measurements in each IRAS band. In general the largest differences occur at the low end of the range of measured flux densities in all four IRAS bands, with the 12 m and 25 m bands showing the most dramatic changes, up to a factor of 2 in the few most extreme cases. Much of these differences can be accounted for simply by more mature data processing, which had the greatest effect near the survey lower limits in each of the IRAS bands. At 60 m and 100 m, where the measured fluxes were often substantially above the IRAS FSC survey limits, the maximum change is typically a more modest factor of 30%. At flux densities more than a factor of 2 above the IRAS FSC limits the “new” and “old” values differ by typically 15%. There is a noticeable tendency for the revised flux density measurements to be systematically higher, on average 5%, among objects brighter than about 35 Jy at 60 m, and across the entire range of observed flux densities at 100 m. This is due to a better understanding of the fact that for many of the extended sources with high signal-to-noise ratios, some of the flux extends beyond the previously adopted aperture size, and is better measured by using . In addition, the original processing used for BGSBGS2 based the choice of whether to use instead of only on the coadded scan profile widths (a comparison of FWHM and the width at 25% peak to nominal values observed for pure point sources). However, many galaxies have profile widths which are not significantly broader than what is expected for a point source, yet there is extended emission in a faint “pedestal” that can be reliably measured as a statistically significant excess of the aperture value over the point source fitted value; see the Appendix (Fig. 16) for further details.

All sources with extreme flux ratios in Figure 2 were examined in detail, and they are explained by various improvements in the revised processing. Some objects with are cases where the RBGS flux densities have been estimated by using SCLEAN (see Appendix) or peak values to minimize confusion from companion galaxies in pairs, nearby stars, or cirrus, where in BGSBGS2 the method was used and therefore the flux densities quoted there were contaminated (over estimated). Examples are NGC 5194 and NGC 5195, where SCLEAN was used in RBGS to separate the components of this galaxy pair (M 51) at 12 m and 25 m. Another example is IRAS F16516-0948 at 100 m (), where cirrus confusion has been minimized by using the peak flux estimate in RBGS, and was contaminated (resulting in an over estimated flux density) in BGS2. Most objects with are cases where the RBGS flux selection algorithm resulted in the choice of or over , where in BGSBGS2 a lower flux density estimate was made for reasons explained in the previous paragraph (also see the Appendix). Examples are NGC 3147 at 12 m () and at 25 m (). Other extreme ratios are due simply to differences between the results obtained using the final (PASS3) IRAS archive calibration versus the earlier versions utilized in BGSBGS2; an example is NGC 4565 at 60 m (). Most of the remaining outliers in Figure 2 are explained by the use of the SCANPI measurement for all objects smaller than 25 arcminutes in size, where in BGSBGS2 flux measurements from Rice et al. (1983; 1988) were always used when available. Examples are NGC 134 at 60 m () and NGC 4631 at 100 m (). As discussed in Section 2, comparison of the Rice et al. measurements with SCANPI measurements for galaxies with optical sizes less than 25 arcminutes showed relatively uniform scatter in the residuals, indicating that the use of SCANPI , when significantly larger than , is the best choice for these objects to insure uniformity and consistency in the calibration with the rest of the RBGS objects.
Figure 3 shows the ratio of total flux density to the peak flux density in the coadded scans at 12 m, 25 m, 60 m and 100 m. The value is used here rather than because the latter measurement does not exist for objects in which the point source template (PSF) fit failed, while for pure point sources and thus the ratio is very close to unity. This figure illustrates the degree to which point-source fitted measurements in the IRAS PSC and IRAS FSC underestimate the total flux densities for objects in the RBGS. There are likely numerous errors in the literature concerning the infrared flux densities and infrared colors of galaxies, due to the fact that some users of IRAS data have not fully appreciated the fact that most bright infrared galaxies in the local universe, as represented here in the RBGS, are marginally extended or resolved by IRAS.

A summary of the percentages of sources that were found to be extended in each of the IRAS bands in given in Table 5. The most notable result is that at 60 m and 100 m, where S/N is highest and distinctions can be reliably made, there are significantly more resolved or marginally resolved objects than previously thought: 48% in the RBGS versus 45% as previously reported in the BGSBGS2 at 60 m, and 30% in the RBGS versus 23% as previously reported in the BGSBGS2 at 100 m. This is due to a more careful definition of resolved or marginally extended objects as those having significantly more flux between the baseline zero-crossings, , than within the nominal detector size, , in combination with a comparison of W25 and W50 measurements to point-source values. We should emphasize that the BGSBGS2 used only W25 and W50 to determine whether sources are resolved, and always chose to estimate the flux for the R and M (U) objects. The revised processing has resulted in significantly fewer objects with underestimated total fluxes in the RBGS compared to BGSBGS2.
| Detection Type | ||||
|---|---|---|---|---|
| RBGS ResolvedaaIRAS scan profile size information as identified with the size code (S) following each flux density and uncertainty listed in Table 1. See the description of columns (8) – (11) in Table 1, and Figure 14 (Appendix) for examples of coadded scan profiles that illustrate size codes “R”, “M”, and “U”. - R | 338 (54%) | 266 (42%) | 219 (35%) | 81 (13%) |
| BGS1BGS2 Resolved - R | 349 (56%) | 321 (52%) | 195 (32%) | 72 (12%) |
| RBGS Marginally ResolvedaaIRAS scan profile size information as identified with the size code (S) following each flux density and uncertainty listed in Table 1. See the description of columns (8) – (11) in Table 1, and Figure 14 (Appendix) for examples of coadded scan profiles that illustrate size codes “R”, “M”, and “U”. - M | 43 (7%) | 77 (12%) | 82 (13%) | 105 (17%) |
| BGS1BGS2 Marginally Resolved - U+ | 84 (14%) | 112 (18%) | 80 (13%) | 71 (11%) |
| RBGS UnresolvedaaIRAS scan profile size information as identified with the size code (S) following each flux density and uncertainty listed in Table 1. See the description of columns (8) – (11) in Table 1, and Figure 14 (Appendix) for examples of coadded scan profiles that illustrate size codes “R”, “M”, and “U”. - U | 229 (36%) | 286 (46%) | 328 (52%) | 443 (70%) |
| BGS1BGS2 Unresolved - U | 179 (29%) | 185 (30%) | 343 (55%) | 471 (76%) |
| RBGS Upper Limits | 19 (3%) | 0 | 0 | 0 |
| RBGS Uncertain fluxesbbVarious types of measurement uncertainties as encoded in the flag (F) following some flux density and uncertainty values listed in Table 1. See the description of columns (8) – (11) in Table 1, and Figure 16 (Appendix) for examples of scan profiles that illustrate the uncertainty flags “g”, “b”, “c”, and “n”. | 34 (5%) | 37 (6%) | 40 (6%) | 59 (9%) |
4.2 IRAS Flux Densities – Completeness
With the exception of 19 sources which were not detected at 12 m, the objects in the RBGS were detected in all four IRAS bands. Therefore, despite the fact that the RBGS was selected only on the basis of 60 m flux, the flux distributions and infrared colors involving all four of the IRAS bands (see Table 1) are a fair representation of the true distributions of the IRAS properties of galaxies selected at 60 m.
The distribution of fluxes in Table 1 can be compared with the distribution expected for a complete sample of objects in a non-evolving Euclidean universe that should be a reasonable approximation for the relatively small redshift range covered by the objects in the RBGS. Figure 4 shows the integral and differential log –log plots for each IRAS band. The apparent turn over in the fainest bin of the differential source counts suggests a possible incompleteness near the 60 m sample flux limit. However, this interpretation is based on the assumption that the volume shell containing the bulk of these objects is as uniformly filled with galaxies as the shells containing the brighter galaxies; studies of large-scale structure indicate that such uniformity is not actually present. In addition, the error bars plotted in Figure 4 are merely statistical uncertainties, ; they do not account for other possible errors. The relatively constant slope of the number of sources versus flux density at 60 m down to the selection limit, with a power law fit of in the integral counts, shows that at 60 m the RBGS is reasonably complete to the selection limit of 5.24 Jy.

At 12 m, 25 m, and 100 m, there is a portion of the log –log plot that follows the power-law relation, suggesting that the RBGS sample contains a complete flux-density-limited sample at those wavelengths to the turnover point in the plots (i.e. near , 0.0, and 1.1 at 12 m, 25 m, and 100 m respectively). The turnover point represents the flux-density value beyond which a significant population of sources is being lost as a result of the 60 m selection criterion. At 100 m the turnover is at a value 16 Jy, nearly 10 times the completeness limit of the PSC at 100 m (IRAS Explanatory Supplement 1988), and is consistent with the rare occurrence of “extremely cold” galaxies with . At 25 m the turnover point at 0.8 Jy is only a factor of 2.2 above the PSC completeness limit at 25 m, and the turnover reflects a true loss of “warm” IRAS galaxies with from the RBGS. Similarly at 12 m where the turnover at 0.75 Jy is again approximately twice the PSC completeness limit at 12 m, there is a true loss of objects with from the RBGS.
4.3 Sky Coverage
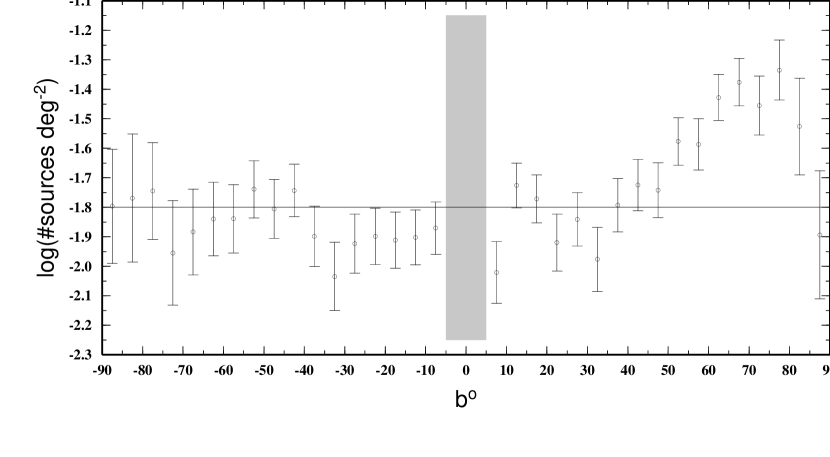
The final RBGS covered all of the sky surveyed by IRAS except for a thin strip within degrees of the Galactic Plane. Figure 5 displays a Hammer-Aitoff projection in Galactic coordinates of all source positions in the RBGS. Also indicated in Figure 5 are three small regions suffering heavy contamination from nearby Galactic molecular clouds (Orion: ; Ophiuchus: R.A. ) and an area of confusion near the Large Magallenic Cloud (LMC: R.A. , ). These three regions were excluded from the BGS2 (see Figure 1 of Sanders et al. 1995). However, with the more thorough data processing carried out for the RBGS, and the fact that the aerial density of sources in these regions is not significantly different from regions of high Galactic latitude, we now believe that most if not all IRAS bright galaxies within these regions have been identified. Sources that lie within these regions are included in Table 1 along with a flag (an asterisk following the IRAS source name in Column 2) indicating that they are located in a region of high Galactic foreground confusion.
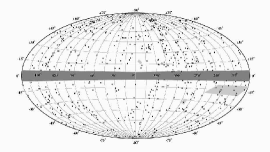
In the BGS2, Sanders et al. (1995) explored the effect that decreasing Galactic latitude might have on our ability to detect all of the real 60 m bright galaxies present. On the basis of the fact that there was no statistically significant decrease in the density of sources detected versus , it was concluded that the BGS2 was essentially complete down to the limit of . We have re-examined this issue using the new RBGS data. Figure 6 shows the surface density of RBGS sources versus Galactic latitude. Although the three bins (bin width ) with the lowest surface density of sources all lie at , there is again no observed systematic decrease in source density with Galactic latitude, and the three lowest points are not that extreme. However, we do not rule out the possibility that a few sources have been missed at lower Galactic latitude, and in particular, that the systematic low values at to may reflect this fact. What is most noticeable in the data of Figure 6 is the large excess surface density of sources in the northern hemisphere compared to the south. This reflects the effect of the Local Supercluster (e.g., Tully 1982).
4.3.1 Clustering
In the original discussion of the properties of IRAS bright galaxies (i.e. the 324 galaxies in the original BGS1 – Soifer et al. 1987) significant attention was given to the effect of the nearby Virgo cluster, which was found to be reflected in the BGS1 sample as an “over density” of sources due to 30 galaxies within a radius around M87 (taken to be the center of the Virgo cluster). These “Virgo galaxies” were shown to be gas-rich spirals with relatively modest luminosity, i.e. log (. While nearly all of these galaxies remain in the RBGS, the overall effect of Virgo on the full RBGS sample is less. This is partly due to the increase in the total number of galaxies in the RBGS, but is also due to the realization that Virgo is simply one (albeit the largest) of several galaxy concentrations within the Local Supercluster (e.g. Tully 1982; Tully & Shaya 1984). We have chosen not to formally separate out the properties of Virgo galaxies from the overall properties of the RBGS, but instead will simply point out the effect of Virgo on the distribution of RBGS galaxy properties where appropriate.
In the Aitoff all-sky plot shown in Figure 5, one of the most obvious features is the asymmetry in the relative number of IRAS bright galaxies found in the north (370) versus the south (259). Tully (1982) has previously shown that this asymmetry is also found for optically selected galaxies, and that it can be accounted for by a relatively small number of “concentrations” within the Local Supercluster, which lies almost entirely at high Galactic latitude. The cumulative affect of the Local Supercluster produces the prominent broad peak in the surface density distribution of IRAS bright galaxies versus Galactic latitude () in Figure 6.
4.4 IRAS Colors
A full discussion of the IRAS colors for this sample is beyond the scope of this paper. However, it is worth pointing out here that the primary statistical trends reported previously in BGS1 (Soifer et al. 1989) have not changed substantially when using the more accurate RBGS fluxes. We discuss the IRAS colors of the RBGS objects briefly below.
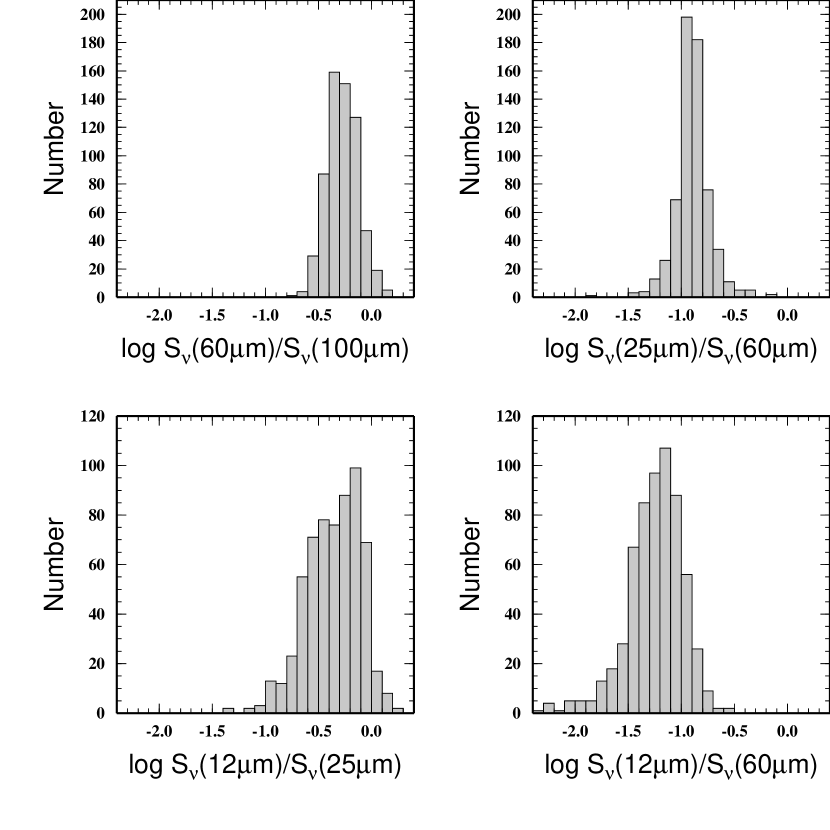
Figure 7 shows the distributions of the RBGS IRAS flux density ratios observed in individual sources. The largest range is found for the ratios 12m/25m and 12m/60m ( 1.5 dex), while the ratios 60m/100m and 25m/60m cover a narrower range ( 0.8 dex).
All of the galaxies in the RBGS exhibit SEDs whose infrared emission increases between 25 m and 60 m with the bulk of the sample having in the range . This simply reflects the dominance of thermal emission from relatively “cool” dust (i.e. ) in the infrared SEDs of the 60 m selected IRAS bright galaxies. This range of dust temperature is also consistent with the range of observed ratios (). Several authors have now shown that this latter ratio is correlated with infrared bolometric luminosity, with the most luminous IRAS sources having the largest values of (see Sanders & Mirabel 1996 for references).

Not all of the observed IRAS flux ratios can be simply understood in terms of a single dust temperature component. For example, the relatively flat distribution found for versus (Figure 8, top panel) likely reflects the combined effects of more than one prominent dust temperature component. Although most galaxies have a dominant “cool” dust component as discussed above, a significant fraction also show a secondary “warm” dust component that typically peaks near 25 m and that appears to be associated with the presence of Seyfert/AGN activity (e.g. Miley et al. 1984; deGrijp et al. 1985).
One of the more surprising results concerning the IRAS colors of galaxies in the RBGS is seen in the inverse correlation between the 60m/100m ratio and the 12m/25m ratio (Figure 8, bottom panel). Soifer & Neugebauer (1991) previously showed that this ratio was also strongly correlated with galaxy infrared luminosity (see their Figs. 5 and 6). One plausible “simple” interpretation that has been proposed is that the component of “hot” ( K) dust found in the SEDs of most “normal” spiral disks decreases due to the increasing destruction rate of small grains as the intensity of the nuclear radiation field increases with increasing total galaxy infrared luminosity.
4.5 Luminosity Function
An appropriate quantity for comparing the RBGS galaxies with other classes of extragalactic objects selected at other wavelengths is the infrared luminosity, , computed using all four IRAS bands (Soifer et al. 1987; Sanders & Mirabel 1996). Soifer et al. (1987) first used the “infrared bolometric luminosity” to compare IRAS BGS galaxies with the total bolometric luminosity for several optically selected galaxy samples (Seyferts, starbursts, QSOs, etc). Here we reconstruct the infrared bolometric luminosity function using the new IRAS measurements listed in Table 1 for the RBGS galaxies. All of the RBGS objects have measured redshifts, and all have measured flux densities in all four IRAS bands (except for a very small percentage of objects with upper limits at 12 m). The space density of the galaxies, , is the number of objects per cubic megaparsec per unit absolute magnitude interval. The units of are , where signifies infrared absolute magnitude bins computed using logarithmic intervals in which each luminosity bin boundary is a factor of larger than the previous one 666This effectively converts intervals of infrared luminosity () to equivalent intervals of absolute magnitude (); an alternate way to express the units of is ..
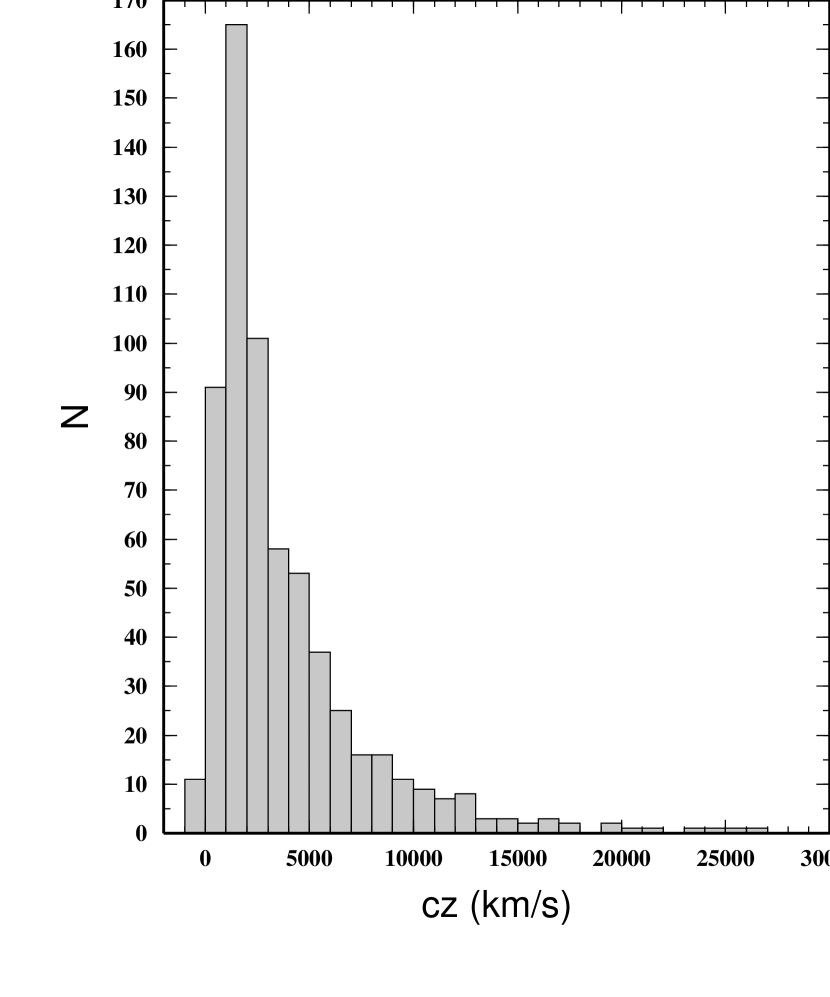
Figure 9 plots the distribution of heliocentric radial velocities () for the complete RBGS using the redshifts tabulated in Table 1 taken from the references given in Table 7. The sharp peak in the 1000-2000 km s-1 redshift bin is largely due to the Virgo cluster. Otherwise, the redshift distribution for the RBGS shows a relatively smooth high redshift tail out to a cut-off near km s-1.
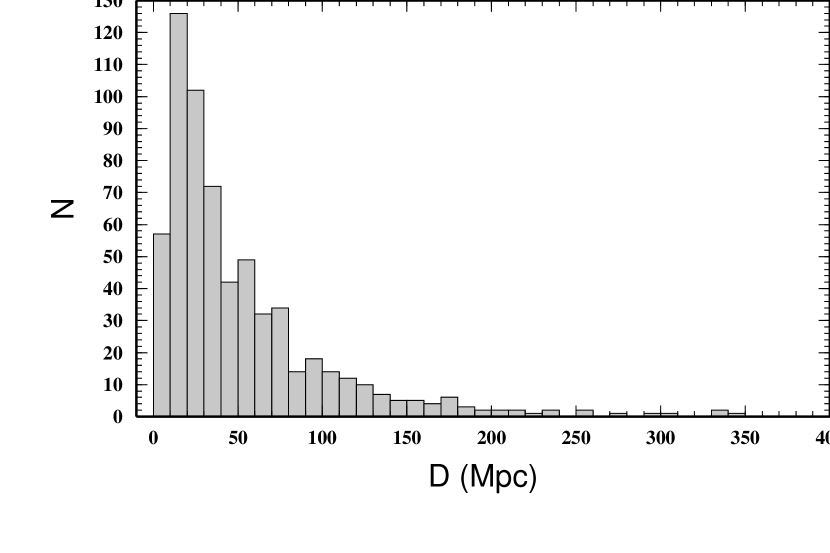
Distances for the RBGS galaxies have been computed using the new cosmic attractor flow model outlined in Appendix A of Mould et al. (2000), assuming km s-1Mpc-1 and adopting a flat cosmology, and . Figure 10 plots the distribution of distances (Mpc) as tabulated in Table 1. Again, the effect of the Virgo cluster can be seen as affecting the strength of the peak in the 10-20 Mpc bin (assuming our adopted distance to Virgo of 15.3 Mpc).
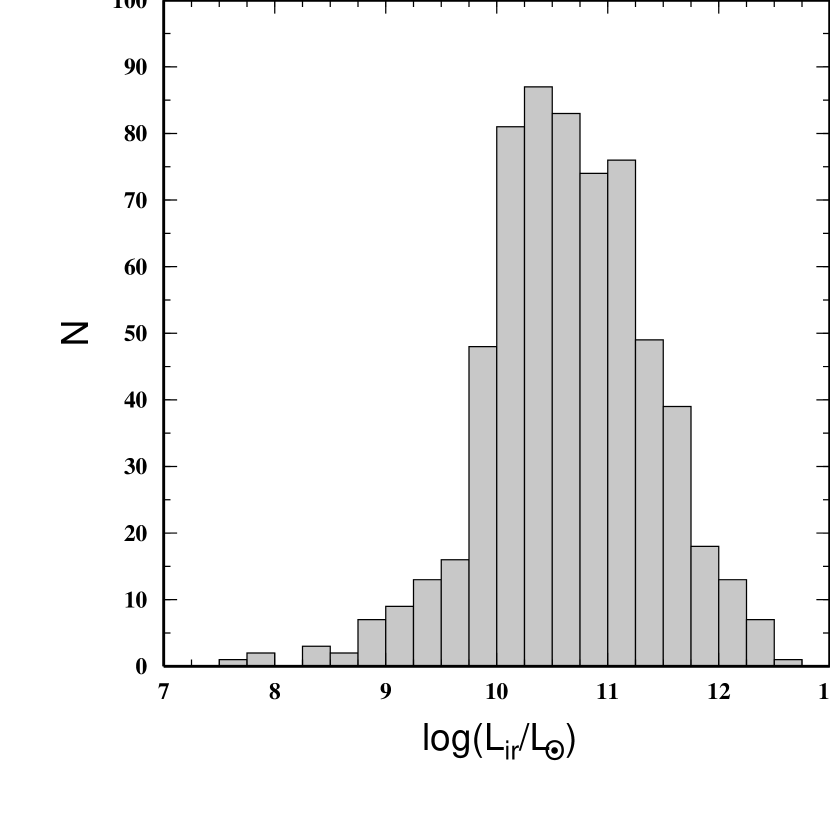
The resulting distribution of infrared luminosities is shown in Figure 11. The prescription and references used for computing are given in the column notes to Table 1. Except for a modest excess of objects at (largely due to Virgo) the distribution shows a relatively broad peak over the luminosity range log ( (half-power). The median observed luminosity, log (, is somewhat larger than the total bolometric luminosity of the Milky Way, and the maximum observed luminosity in the sample, log ( (Mrk 231), is nearly 100 times larger than the median.
The luminosities plotted in Figure 11 were used to compute the infrared bolometric luminosity function for the RBGS (Figure 12), using the method (Schmidt 1968). The computed values are listed in Table 6. The “double power-law” shape of the luminosity function for IRAS bright galaxies is similar to that derived earlier for the BGS1 (e.g. Soifer et al. 1987), except for improved statistics at both low and high infrared luminosities, plus the decreased influence of the Virgo cluster in the all-sky sample as compared to its effect in the smaller BGS1 survey. The best fit power-laws, , give below and above respectively.

5 Summary
This paper presents the complete list of objects in the IRAS Revised Bright Galaxy Sample, a sample of extragalactic objects selected at 60m from the IRAS all-sky survey. The observed slope of in the log –log relation at 60 m confirms that the RBGS is statistically complete down to the limit of Jy. The properties of the RBGS objects were computed using the final release of the IRAS Level 1 Archive and thus the RBGS replaces the earlier BGS samples which were determined using older versions of the IRAS data products. The RBGS contains 39 objects which were not present in the BGSBGS2, and 28 objects from the BGSBGS2 have been dropped from the RBGS because their revised 60 m flux densities are not greater than 5.24 Jy. Improved methods were used to measure the total IRAS flux densities of individual sources, resulting in typical changes of 5-25% when compared to previous values reported for the BGSBGS2, with changes of up to a factor of 2 for the faintest sources at 12 m and 25 m. Better procedures for resolving position uncertainties and resolving cross-identifications with other galaxy catalogs resulted in name changes for 7% of the previous BGSBGS2 compilations. This work presents the most accurate estimates to date of the total IRAS flux densities and derived infrared luminosities of galaxies in the local Universe. Basic properties of the RBGS galaxies are summarized below.
-
1.
The RBGS sample contains a total of 629 galaxies with Jy in an area of 37,657.5 square degrees (91.3% of the sky) covering the entire sky surveyed by IRAS down to Galactic latitude ;
-
2.
Extended flux ( 0.77′) at 12 m, ( 0.78′) at 25 m, ( 1.44′) at 60 m, and ( 2.94′) at 100 m is detected in 61%, 54%, 48%, and 30% of the galaxies respectively.
-
3.
The mean and median redshift for the entire RBGS sample is ( km s-1) and ( km s-1), respectively. The object with the highest redshift is IRAS , and the object with the largest computed infrared luminosity in this local sample is Mrk 231 ().
-
4.
The bolometric infrared luminosity function, , for infrared bright galaxies in the Local Universe remains best fit by a double power law, , with below and above , respectively.
NASA/IPAC Extragalactic Database (NED), which is operated by the Jet Propulsion Laboratory, California Institute of Technology, under contract with the National Aeronautics and Space Administration. Queries of the IRAS catalogs and scan coadd processing using SCANPI were supported by the NASA/IPAC Infrared Science Archive (IRSA), which is operated by the Jet Propulsion Laboratory, California Institute of Technology, under contract with the National Aeronautics and Space Administration. DBS acknowledges support from a Senior Award from the Alexander von Humboldt-Foundation and from the Max-Planck-Institut fur extraterrestrische Physik as well as support from NASA grant NAG 90-1217. JMM, DCK, and JS were supported by the Jet Propulsion Laboratory, California Institute of Technology, under contract with NASA. DCK is grateful for financial support from KOSEF grant No. R14-2002-058-01000-0 and from the BK21 project of the Korean Government. JS and BTS are supported by the SIRTF Science Center at the California Institute of Technology; SIRTF is carried out at JPL, under contract with NASA.
APPENDIX
Data Reduction and Detailed SCANPI Measurements
Many sources in the RBGS are near enough such that they appear resolved or marginally extended in one or more of the IRAS detector bands, while others are unresolved. Therefore, an objective and consistent procedure had to be developed to select the best estimate of the total flux density for each object in each of the four IRAS bands. Table 7 lists the IRAS SCANPI measurements for all sources in the RBGS; these data were used along with the coadded scan plots to determine the “best” flux density estimates as listed in Table 1. These measurements are from the SCANPI median (1002) method of IRAS scan coaddition (Helou et al. 1988). Table 7 includes the coaddition results from all four SCANPI methods (“zc”, “tot”, “template”, “peak”) for each source in the RBGS. Our automated processing methods selected the final flux densities listed in Table 1 based on the relative values from these four coadd methods, plus the use of important additional information concerning source extent, and possible confusion due to blended sources, companions, Galactic cirrus, or excessive noise. Examples of how these choices were made are illustrated in Figures 14-16, and more thoroughly discussed in the captions to these figures.
The column entries in Table 7 are as follows:
(1) Name – The Common name as listed in Table 1.
(2) Redshift Reference – 19 digit reference code from NED for the redshift listed in Table 1.
(3) N/O – Ratio of the new IRAS flux density estimate to the
old flux density estimate published previously in BGS1 or BGS2 at 12 m; objects
new to the RBGS have missing values
(“ —”) in this and following columns.
(4) zc – flux density from SCANPI’s zero-crossing measurement, (Jy) at 12 m.
(5) tot – flux density from SCANPI’s in-band total measurement, (Jy) at 12 m.
(6) temp – flux density from SCANPI’s template amplitude measurement, tmpamp (Jy) at 12 m.
(7) peak – flux density from SCANPI’s peak measurement, peak (Jy) at 12 m.
(8) W25 – scan profile full width (arcminutes) measured at 25% of the peak signal at 12 m.
(9) W50 – scan profile full width (arcminutes) measured at 50% of the peak signal at 12 m.
(10–16) – Same measurements as in columns (3) – (9), but at .
(17–23) – Same measurements as in columns (3) – (9), but at .
(24–30) – Same measurements as in columns (3) – (9), but at .
![[Uncaptioned image]](/html/astro-ph/0306263/assets/x26.png)
Pages 1-11 of Table 7: http://nedwww.ipac.caltech.edu/level5/March03/IRAS_RBGS/Figures/Table7.ps.gz.
For some objects, values of temp are 0.00 or values of W25 and W50 are negative in Table 7. These are indications that the point source template amplitude fit failed, which occurred for some very extended objects best measured using the flux estimator; see the example of NGC 1532 at 25 m as plotted in panel (a) of Figure 15.
Perhaps of most immediate interest to those familiar with the previous BGSBGS2 data are the N/O values given in columns (3), (10), (17) and (24) of Table 7. Part of the differences in the “new” versus “old” flux densities is simply that due to the improved “Pass 3” calibration adopted for the final release of the IRAS Level 1 Archive. However, a significant effect is that due to the improved methods of estimating the total flux, in particular the use of when this flux measurement was significantly larger than the other coadd methods due to extended emission not captured by . In addition, as mentioned in Section 4.1, many galaxies have profile widths which are not significantly broader than what is expected for a point source, yet there is extended emission in a faint “pedestal” that can be easily seen in the profiles, and reliably measured as a statistically significant excess of the aperture value over the point source fitted value. Figure 13 shows the distribution of the ratio at 60 m; also plotted are Gaussian fits intended to model the distribution expected solely from noise in the relative and measurements for unresolved objects, data for a sample of comparably bright stars, and 60 m profiles for representative RBGS objects. This information was used as follows to establish the threshold for when could be selected as a reliable, confident indicator of extended emission in excess of the value measured by the point source template fit.
A sample of candidate stars was selected from the IRAS Point Source Catalog (PSC) using the joint criteria of , a high point source fit correlation coefficient (%), and positional association with objects in one or more star catalogs. The resulting candidate list (195 objects) was further filtered by cross-identification of each IRAS source with known stars using information available in SIMBAD. Some are planetary nebulae or unknown object types and were therefore omitted for this purpose of identifying a large sample of pure 60 m point sources. The remaining sample of confirmed stars were then processed with SCANPI using the same procedure as the RBGS objects. The distribution of the measured ratios of for 121 confirmed bright stars with high quality 60 m IRAS scans (e.g., not confused by cirrus, excessive noise, or companions) is plotted in the same bins as the RBGS objects in Figure 13 (asterisks). The presence of stars with ratios greater than 1.05 was unexpected, and this complicated the goal of building a comparison sample of pure IRAS 60 m point sources; close inspection of the data showed that each of these objects have 60 m scan profiles similar to the RBGS galaxy profiles plotted in Figure 13, with faint “pedestals” of faint emission under a dominating point source. Larger ratios correspond to higher or more extended pedestals well above the background noise in the scans. These are clear candidates for stars embedded in extended circumstellar dust disks, shells or nebulae; some objects have published data that support this interpretation, including spectral classifications such as carbon stars, emission-line stars, and stars with known OH/IR envelopes. These objects are not considered further in this paper, but their presence required omitting stars outside the range 0.95 - 1.05 to form a Gaussian fit representative of unresolved stars measured by SCANPI. This fitted distribution of stars (dotted line, with a mean of ) was then scaled to match the peak of the Gaussian fit to the RBGS objects (solid line), and plotted as a dashed line in Figure 13.
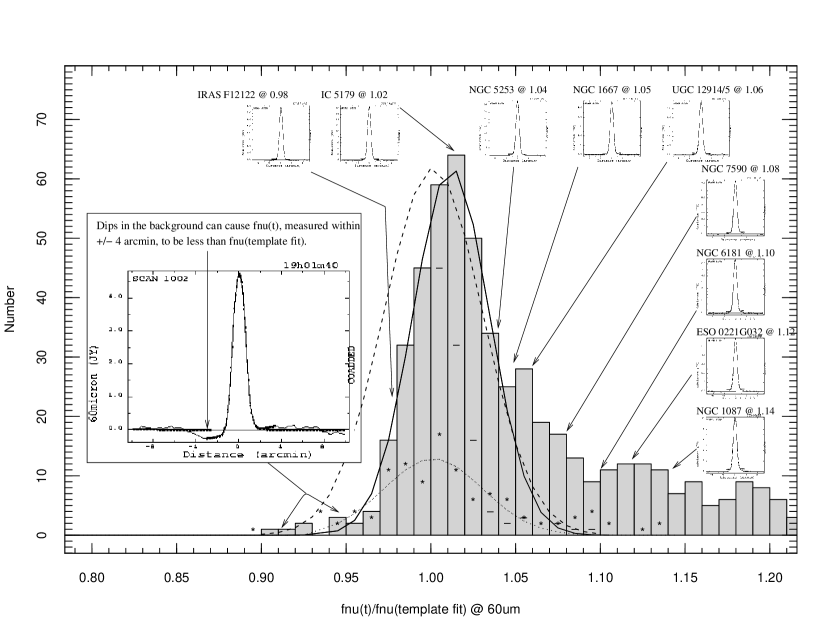
Another approach to predicting the expected distribution for unresolved
galaxies with
is based on the assumption
that small differences between the two measurements (whether negative or
positive) are due solely to noise in the coadded scans and uncertainties
in the IRAS point source template fits. That is, if all galaxies with
between 1.00 and 1.10 were unresolved by
IRAS at 60 m, we would expect the observed RBGS histogram bins over this
range to match a reflection of the distribution over the range 0.90 -
1.00, where differences between and are
clearly not physical and therefore due solely to noise. These expected
counts are shown as horizontal line segments drawn within the bins with
values between 1.0 and 1.10. Using this
noise symmetry argument to predict the
ratios expected for truly unresolved objects over the range 1.0 - 1.1,
there is a clear excess of galaxies with ratios as small as 1.04 – 1.05
that likely have real (but weak) extended components; roughly 50% of the
RBGS objects in these bins are in this category. However, since we cannot
distinguish, using visual inspection of the coadded scan profiles, between
galaxies that have true extended emission and those which have due only to noise among these objects, we cannot reliably
use a threshold ratio smaller than 1.05 to classify specific objects
as marginally extended. Although the bins with
in the range 1.05 – 1.10 have counts that suggest some of these objects may
be explained by the Gaussian fits described above for unresolved objects,
visual inspection of the SCANPI profiles shows that every object in this range
(and of course larger values) have clear, obvious extended emission as shown
in the example profiles inset in Figure 13. Finally, the reality of extended
emission for RBGS objects with ratios
is visualized in Figure 13 through the progressive increase in the height or
spatial extent of the pedestals corresponding to an increase in the flux ratio,
all clearly defined well above the background noise in the coadded scans.
The threshold ratio of (5% excess flux over the point source template fit) was therefore used for defining marginally extended objects (M). Visual examination of the coadded scan profiles widths in conjunction with the flux ratio distribution in Figure 13 lead to selection of a threshold of (20% flux excess over the point source template fit) to flag a source as fully resolved (R), even if there is no additional excess flux measured by the method and therefore the value is selected. The final algorithm chosen for selecting the best SCANPI method for estimating the total flux density and for assigning IRAS source size codes in each IRAS band is as follows:
-
1.
If the condition is true OR the condition is true, is selected and the source is classified as marginally extended (M). The above and in other conditions that follow is the standard deviation of the coadded data measured by SCANPI in the background noise outside the signal range; these values are tabulated in columns (8) – (11) of Table 1 in units of mJy. and are the thresholds used to establish when a galaxy profile’s width at 50% peak (FWHM) or 25% peak are significantly larger than observed among unresolved point sources. The and thresholds adopted, rather conservatively, are the computed mean plus 3 times the rms dispersion observed in each IRAS band for a large sample of point sources: 1.04and 1.40at 12 m, 1.00and 1.38at 25 m, 1.52and 2.06at 60 m, and 3.22and 4.32at 100 m. For reference, the nominal FWHM of the IRAS detectors is 0.77(12 m), 0.78(25 m), 1.44(60 m), and 2.94(100 m).
-
2.
If the condition is true OR the condition is true, is selected and the object is classified as resolved (R).
-
3.
If the condition is true, AND the condition is true, AND the condition is true, is selected and the source is classified as resolved (R).
-
4.
If none of the above conditions are satisfied, the method is selected and the source is classified as unresolved (U).
-
5.
For coadded scans that display confusion from nearby sources, blends of close pairs, excessive noise, cirrus contamination, etc., based on visual inspection made for all of the data, selections resulting from the algorithm above were overridden using flags specified in the input data. For example, the peak flux value is a better estimate (flagged with method code “P” in Table 1) when the value is tainted by a bad point source template fit due to a nearby confusing source or cirrus (e.g., IRAS at 60 m; see Fig. 15.). Another example is when the SCLEAN algorithm was used in an attempt to de-blend components of a pair (e.g., NGC 5194/95 M 51; see Fig. 15.).
Figures 14 – 16 display coadded IRAS scan profiles that illustrate the meaning of the source size codes (S), SCANPI flux density methods (M), and uncertainty flags (F) as listed for each source in Table 1.


The flux estimates chosen by the final processing are indicated by the “Method” codes following the flux densities quoted in Table 1: Z = “zero crossing” (“zc” in Table 7); I = “in-band total” (“tot” in Table 7); T = “template fit” (“temp” in Table 7); P = “peak value” (“peak” in Table 7); S = “deconvolution with SCLEAN”777SCLEAN is a simple routine that fits an IRAS point-source template at an input position and subtracts (“cleans”) the fit from the 1-D coadded profile. This allows the user to estimate the flux remaining in a source which is not accounted for by point source component(s). SCLEAN was used to estimate the flux densities for components of pairs and a number of confused objects, as indicated in Table 1.; R = from Rice et al. (1988). For objects with “R” listed as the Method code in Table 1 (objects larger than 25 arcminutes) the SCANPI measurements in were not used; they are included in Table 7 just for reference.
Table 5 (Section 4.1) lists the distribution among the size codes (U,M,R) for the sources at each wavelength, and reflects primarily the changing angular resolution of the IRAS detectors as a function of wavelength, although the increased sensitivity of the IRAS detectors at 60 m partially compensates for the larger size of the 60 m detectors compared to the smaller angular resolution of the detectors at 12 m and 25 m. The number of resolved or marginally resolved objects (i.e. size codes “M” or “R” respectively in Table 1) is 61% at 12 m, 54% at 25 m, 48% at 60 m, and drops to 30% at 100 m, as listed in Table 5.
References
- (1) Aaronson, M., et al 1982a, ApJ, 258, 64.
- Aaronson et al. (1982b) Aaronson, M., et al 1982b, ApJS, 50, 241.
- Aaronson & Mould (1983) Aaronson, M., & Mould, J. 1983, ApJ, 265, 1.
- Aaronson, Mould, & Huchra (1980) Aaronson, M., Mould, J., & Huchra, J. 1980, ApJ, 237, 655
- Aumann, Fowler, & Melnyk (1990) Aumann, H. H., Fowler, J. W., & Melnyk, M. 1990, AJ, 99, 1674
- (6) Cataloged Galaxies and Quasars Detected in the IRAS Survey 1985, prepared by C. J. Lonsdale, G. Helou, J. C. Good, & W. L. Rice (JPL D1932).
- da Costa et al. (1991) da Costa, L. N., Pellegrini, P. S., Davis, M., Meiksin, A., Sargent, W. L. W., & Tonry, J. L. 1991, ApJS, 75, 935.
- Dale et al. (2001) Dale, D. A., Helou, G., Contursi, A., Silbermann, N. A., & Kilhatkar, S. 2001, ApJ, 549, 215.
- de Carvalho, Ribeiro, Capelato, & Zepf (1997) de Carvalho, R. R., Ribeiro, A. L. B., Capelato, H. V., & Zepf, S. E. 1997, ApJS, 110, 1.
- deGrijp et al. (1985) de Grijp, M. H. K., Miley, G. K., Lub, J., & de Jong, T. 1985, Nature, 314, 240.
- de Vaucouleurs et al. (1991) de Vaucouleurs, G., de Vaucouleurs, A., Corwin, JR., H. G., Buta, R. J., Paturel, G., & Fouque, P. 1991, Third Reference Catalogue of Bright Galaxies, Austin: University of Texas Press.
- de Vaucouleurs, de Vaucouleurs, & Corwin (1976) de Vaucouleurs, G., de Vaucouleurs, A., & Corwin, J. R. 1976, Second Reference Catalogue of Bright Galaxies, Austin: University of Texas Press.
- Dey, Strauss, & Huchra (1990) Dey, A., Strauss, M. A., & Huchra, J. 1990, AJ, 99, 463.
- Fajardo-Acosta, Stencel & Backman (1997) Fajardo-Acosta, S. B., Stencel, R. E. & Backman, D. E. 1997, ApJ, 487, 151.
- Ferrarese et al. (2000) Ferrarese, L. et al. 2000, ApJS, 128, 431.
- Freedman et al. (2001) Freedman, W. L. et al. 2001, ApJ, 553, 47.
- Giovanelli & Haynes (1993) Giovanelli, R. & Haynes, M. P. 1993, AJ, 105, 1271.
- Giovanelli et al. (1997) Giovanelli, R., Haynes, M. P., Herter, T., Vogt, N. P., Wegner, G., Salzer, J. J., da Costa, L. N., & Freudling, W. 1997, AJ, 113, 22.
- Giovanelli, Avera, & Karachentsev (1997) Giovanelli, R., Avera, E., & Karachentsev, I. D. 1997, AJ, 114, 122.
- Gudehus (1976) Gudehus, D. H. 1976, ApJ, 208, 267.
- Haynes et al. (1997) Haynes, M. P., Giovanelli, R., Herter, T., Vogt, N. P., Freudling, W., Maia, M. A. G., Salzer, J. J., & Wegner, G. 1997, AJ, 113, 1197.
- Haynes et al. (1998) Haynes, M. P., van Zee, L., Hogg, D. E., Roberts, M. S., & Maddalena, R. J. 1998, AJ, 115, 62.
- (23) Helou, G., Kahn, I. R., Malek, L., & Boehmer, L. 1988, ApJS, 68, 151.
- Huchra, Davis, Latham, & Tonry (1983) Huchra, J., Davis, M., Latham, D., & Tonry, J. 1983, ApJS, 52, 89.
- Huchra et al. (1993) Huchra, J., Latham, D. W., da Costa, L. N., Pellegrini, P. S., & Willmer, C. N. A. 1993, AJ, 105, 1637.
- Huchra et al. (1992) Huchra, J., P. et al. 1992, CfA Redshift Catalog (ZCAT).
- Huchra, Geller, & Corwin (1995) Huchra, J. P., Geller, M. J., & Corwin, H. G. 1995, ApJS, 99, 391.
- Huchra, Vogeley, & Geller (1999) Huchra, J. P., Vogeley, M. S., & Geller, M. J. 1999, ApJS, 121, 287.
- (29) IRAS Catalogs and Atlases – Explanatory Supplement 1985 (NASA RP-1190).
- (30) IRAS Catalogs and Atlases: Small Scale Structure Catalog 1988, eds. G. Helou & D. Walker (Washington, DC: GPO) (SSS).
- (31) IRAS Catalogs and Atlases: Point Source Catalog 1988, (Washington, DC: GPO) (PSC Version 2).
- (32) IRAS Faint Source Survey, Explanatory Supplement version 2, 1992, eds. M. Moshir, G. Kopman, T. Conrow (Pasadena: IPAC).
- Keel (1996) Keel, W. C. 1996, AJ, 111, 696.
- Keel (1996) Keel, W. C. 1996, ApJS, 106, 27.
- Kim et al. (1995) Kim, D.-C., Sanders, D. B., Veilleux, S., Mazzarella, J. M., & Soifer, B. T. 1995, ApJS, 98, 129.
- Kirshner (1977) Kirshner, R. P. 1977, ApJ, 212, 319.
- (37) Kirshner, R. P., Oemler, A., & Schechter, P. L. 1978, AJ, 83, 1549.
- Lauberts & Valentijn (1989) Lauberts, A. & Valentijn, E. A. 1989, “The Surface Photometry Catalogue of the ESO-Uppsala Galaxies,” (Garching: European Southern Observatory).
- Lebofsky & Rieke (1979) Lebofsky, M. J. & Rieke, G. H. 1979, ApJ, 229, 111.
- Lu et al. (1990) Lu, N. Y., Dow, M. W., Houck, J. R., Salpeter, E. E., & Lewis, B. M. 1990, ApJ, 357, 388.
- Lu et al. (1993) Lu, N. Y., Hoffman, G. L., Groff, T., Roos, T., & Lamphier, C. 1993, ApJS, 88, 383.
- Mathewson, Ford, & Buchhorn (1992) Mathewson, D. S., Ford, V. L., & Buchhorn, M. 1992, ApJS, 81, 413.
- Madore & Freedman (1998) Madore, B. F., & Freedman, W. L. 1998, in “Stellar Astrophysics for the Local Group: VIII Canary Islands Winter School of Astrophysics.” Edited by A. Aparicio, A. Herrero, & F. Sanchez. Cambridge; New York: Cambridge University Press, p.263
- Mathewson & Ford (1996) Mathewson, D. S. & Ford, V. L. 1996, ApJS, 107, 97.
- Miley et al. (1984) Miley, G., Neugebauer, G., Soifer, B. T., Clegg, P. E., Harris, S., Rowan-Robinson, M., & Young, E. 1984, ApJ, 278, L79
- Mirabel & Sanders (1988) Mirabel, I. F. & Sanders, D. B. 1988, ApJ, 335, 104.
- Moshir et al. (1992) Moshir, M., Kopan, G., Conrow, T., McCallon, H., Hacking, P., Gregorich, D., Rohrbach, G., Melnyk, M., Rice, W., Fullmer, L., White, J., & Chester, T. 1992, Explanatory Supplement to the IRAS Faint Source Survey, Version 2, JPL D-10015 8/92 (Pasadena: JPL)
- Mould et al. (1991) Mould, J. R. et al. 1991, ApJ, 383, 467
- Mould et al. (2000) Mould, J. R. et al. 2000, ApJ, 529, 786
- Murphy et al. (2001) Murphy, T. W., Soifer, B. T., Matthews, K., Armus, L., & Kiger, J. R. 2001, AJ, 121, 97.
- Neugebauer et al. (1984) Neugebauer, G., et al. 1984, ApJ, 278, L1.
- Nordgren, Chengalur, Salpeter, & Terzian (1997) Nordgren, T. E., Chengalur, J. N., Salpeter, E. E., & Terzian, Y. 1997, AJ, 114, 77.
- Nordgren, Chengalur, Salpeter, & Terzian (1997) Nordgren, T. E., Chengalur, J. N., Salpeter, E. E., & Terzian, Y. 1997, AJ, 114, 913.
- Palumbo, Tanzella-Nitti, & Vettolani (1983) Palumbo, G. G. C., Tanzella-Nitti, G., & Vettolani, G. 1983, “Catalogue of Radial Velocities of Galaxies,” New York, Gordon and Breach Science Publishers, 592 pp.
- Pantoja, Altschuler, Giovanardi, & Giovanelli (1997) Pantoja, C. A., Altschuler, D. R., Giovanardi, C., & Giovanelli, R. 1997, AJ, 113, 905.
- (56) Perault, M. 1987, Structure et Evolution des Nuages Moleculaires, PhD thesis, Univ. Paris
- Ribeiro et al. (1996) Ribeiro, A. L. B., de Carvalho, R. R., Coziol, R., Capelato, H. V., & Zepf, S. E. 1996, ApJ, 463, L5.
- Rice (1993) Rice, W. 1993, AJ, 105, 67.
- (59) Rice, W. L., Lonsdale, C. J., Soifer, B. T., Neugebauer, G., Kopan, E. L., Lloyd, L. A., deJong, T., & Habing, H. 1988, ApJS, 68, 91.
- Rubin, Kenney, & Young (1997) Rubin, V. C., Kenney, J. D. P., & Young, J. S. 1997, AJ, 113, 1250.
- Sandage, Bell, & Tripicco (1999) Sandage, A., Bell, R. A., & Tripicco, M. J. 1999, ApJ, 522, 250.
- (62) Sandage, A., & Tammann, G. A. 1981, A Revised Shapley-Ames Catalog of Bright Galaxies (Carnegie Institute, Washington, DC) (RSA).
- Sanders & Mirabel (1996) Sanders, D. B., & Mirabel, I. F. 1996, ARA& A, 34, 749.
- Sanders et al. (1995) Sanders, D. B., Egami, E., Lipari, S., Mirabel, I. F., & Soifer, B. T. 1995, AJ, 110, 1995 (BGS2).
- Sanders, Scoville, & Soifer (1991) Sanders, D. B., Scoville, N. Z., & Soifer, B. T. 1991, ApJ, 370, 158.
- Schmidt (1968) Schmidt, M. 1968, ApJ, 151, 393
- Schneider, Thuan, Magri, & Wadiak (1990) Schneider, S. E., Thuan, T. X., Magri, C., & Wadiak, J. E. 1990, ApJS, 72, 245.
- Schneider, Thuan, Mangum, & Miller (1992) Schneider, S. E., Thuan, T. X., Mangum, J. G., & Miller, J. 1992, ApJS, 81, 5.
- Shier & Fischer (1998) Shier, L. M. & Fischer, J. 1998, ApJ, 497, 163.
- Shostak (1975) Shostak, G. S. 1975, ApJ, 198, 527.
- (71) Soifer, B. T., Boehmer, L., Neugebauer, G., & Sanders, D. B. 1989, AJ, 98, 766 (BGS1).
- (72) Soifer, B. T., Sanders, D. B., Madore, B. F., Neugebauer, G., Danielson, G. E., Elias, JU. H., Lonsdale, C. J., & Rice, W. L. 1987, ApJ, 320, 238.
- (73) Soifer, B. T., Sanders, D. B., Neugebauer, G., Danielson, G. E., Lonsdale, C. J., Madore, B. F., & Persson, S. E. 1986, ApJ, 303, L41.
- Solomon, Downes, Radford, & Barrett (1997) Solomon, P. M., Downes, D., Radford, S. J. E., & Barrett, J. W. 1997, ApJ, 478, 144.
- Storchi-Bergmann et al. (1996) Storchi-Bergmann, T., Rodriguez-Ardila, A., Schmitt, H. R., Wilson, A. S., & Baldwin, J. A. 1996, ApJ, 472, 83.
- Strauss et al. (1992) Strauss, M. A., Huchra, J. P., Davis, M., Yahil, A., Fisher, K. B., & Tonry, J. 1992, ApJS, 83, 29.
- (77) Surace, J. A., Sanders, D. B., & Mazzarella, J. M. 2003, ApJS, submitted.
- Tift & Cocke (1988) Tift, W. G. & Cocke, W. J. 1988, ApJS, 67, 1.
- Tinney, Scoville, Sanders, & Soifer (1990) Tinney, C. G., Scoville, N. Z., Sanders, D. B., & Soifer, B. T. 1990, ApJ, 362, 473.
- Tully (1982) Tully, R. B. 1982, ApJ, 257, 389.
- Tully & Shaya (1984) Tully, R. B., & Shaya, E. 1984, ApJ, 281, 31.
- Walsh, Staveley-Smith, & Oosterloo (1997) Walsh, W., Staveley-Smith, L., & Oosterloo, T. 1997, AJ, 113, 1591.
- Young et al. (1995) Young, J. S. et al. 1995, ApJS, 98, 219.
- (84) Zwicky, F., et al (1961-68), Catalog of Galaxies and Clusters of Galaxies, (California Institute of Technology, Pasadena).
- (85) Zwicky, F., & Zwicky, M. A. 1971, Catalog of Selected Galaxies and Post-Eruptive Galaxies, (Zurich: Offsetdruck L. Speich).