7323
S. Andreon
11email: andreon@brera.mi.astro.it
22institutetext: CEA/DSM/DAPNIA, Service d’Astrophysique, Saclay, France
The XMM–LSS project: a short presentation of the survey and of the first results
Abstract
We (Pierre et al. 2003) have designed a medium deep large area X-ray survey with XMM – the XMM Large Scale Structure survey, XMM-LSS – with the scope of extending the cosmological tests attempted using ROSAT cluster samples to two redshift bins between while maintaining the precision of earlier studies. The optimal survey design was found to be an area, paved with 10 ks XMM pointing separated by 20 arcmin. This area is the target of several complementary surveys, from the ultraviolet to the radio wavelengths, allowing, beside cosmological studies, detailed studies of the objects included in our area.
keywords:
X-ray, Large Scale Structures, clusters of galaxies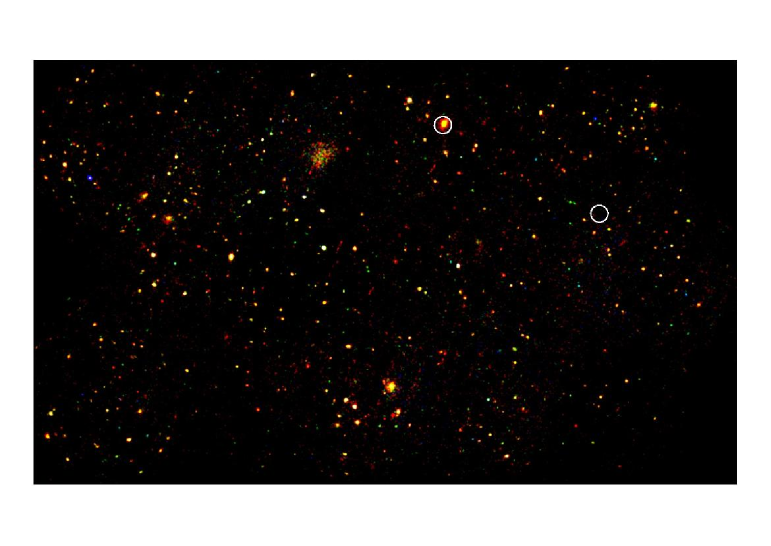
1 Introduction
From a simple theoretical point of view, clusters of galaxies - the most massive bound structures in the Universe - are objects having a mass of the order of growing by accretion at a rate governed by the initial density fluctuation spectrum, the cosmological parameters, the nature and amount of dark matter as well as the nature of the dark energy. Their 3-dimensional space distribution and number density as functions of cosmic time constrain cosmological parameters in a unique way. Clusters offer considerable advantages for large scale structure (LSS) studies: they can provide complete samples of objects over a very large volume of space, and they are in crucial respects simple to understand. The extent (and mass) of clusters can be traced by their X-ray emission while the theory describing their formation (biasing) and evolution from the initial fluctuations can be tested with numerical simulations. Such a level of understanding does not exist for galaxies - which have reached a highly non-linear stage - to and even less for QSO and AGN formation. The resulting cluster LSS counts studies can constrain cosmological parameters, independently of Cosmic Microwave Background (CMB) and supernova (SN) studies since they do not rely on the same physical processes. A quantitative overview of the cosmological implications of cluster surveys can be found for instance in Haiman, Mohr & Holder (2001).
XMM is in a position to open a new era for X-ray surveys. Its high sensitivity, considerably better PSF than the RASS ( on axis) and large field of view (), make it a powerful tool for the study of extragalactic LSS. In this respect, two key points may be emphasized. Firstly, a high galactic latitude field observed with XMM at medium sensitivity ( erg cm2 s-1) is “clean” as it contains only two types of objects, namely QSOs (pointlike sources) and clusters (extended sources) well above the confusion limit. Secondly, if clusters more luminous than herg/s are present at high redshift, they can be detected as extended sources out to , in XMM exposures of only 10 ks.
2 The XMM–LSS survey and the associate surveys
We (Pierre et al. 2003) have designed a survey to yield some 800 clusters in two redshift bins with : the XMM Large Scale Structure Survey (XMM-LSS). The optimal survey design was found to be an area, paved with 10 ks XMM pointing separated by 20 arcmin (i.e. 9 pointings per degree square). The expected ultimate sensitivity is erg cm2 s-1 for pointlike sources in the [0.5-2] keV band. It will also trace the LSS as defined by X-ray QSOs out to redshifts of .
In addition, the proposed X-ray survey is associated with several other major new generation surveys (optical, IR, Radio, UV), as detailed in Table 1.
3 First results
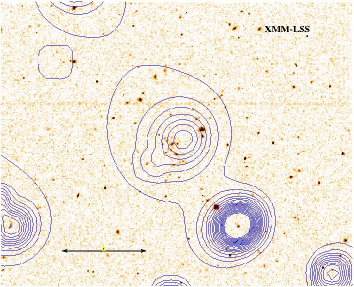
During fall 2002, we did perform near–infrared observations at NTT of clusters and trial spectroscopic observations of candidate clusters at VLT and Magellan telescopes. Figure 2 shows an example of a cluster spectroscopically confirmed at (Valtchanov et al. 2003). Spectroscopic observations confirm 17 out 18 of the candidate clusters observed (Valtchanov et al. 2003, Willis et al. 2003).
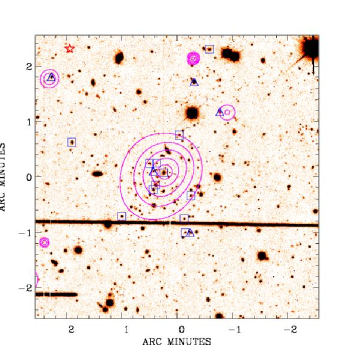
Candidate clusters are extracted from XMM–LSS database as extended X-ray sources with no obvious optical counterpart (our optical data are deep enough to detect clusters up to ) and observed in the near–infrared using SOFI at NTT (Andreon et al. 2003a). The run was very useful, confirming 5 clusters in just over 1 deg2 of the survey and suggesting a few clusters. One of the near–infrared confirmed clusters is shown in Figure 3.
| Observatory/Instrument | (Planned) Coverage | Band | Final Sensitivity |
|---|---|---|---|
| XMM/EPIC | 64 deg2 | [0.2-10] keV | erg cm2 s-1 [1] |
| CFHT/CFH12K (VVDS Deep) * | 2 deg2 GT | B, V, R, I | 26.5, 26.0, 26.0, 25.4 [2] |
| CFHT/CFH12K (VVDS Wide) * | 3 deg2 GO | V, R, I | 25.4, 25.4, 24.8 [2] |
| CFHT/MegaCam | 72 deg2 | u*, g’, r’, i’, z’ | 25.5, 26.8,26.0, 25.3, 24.3 [3] |
| CTIO 4m/Mosaic | 16 deg2 | R, z’ | 25, 23.5 [4] |
| UKIRT/WFCAM | 8.75 deg2 | J, H, K | 22.5, 22.0, 21.0 [5] |
| VLA/A-array * | 110 deg2 | 74 MHz | 275 mJy/beam [6a] |
| VLA/A-array | 5.6 deg2 | 325 MHz | 4 mJy/beam [6b] |
| OCRA | all XMM-LSS clusters | 30 GHz | 100 Jy [7] |
| AMiBA | 70 deg2 | 95 GHz | 3.0 mJy [8] |
| SIRTF/IRAC (SWIRE Legacy) | 8.7 deg2 | 3.6, 4.5, 5.8, 8.0 m | 7.3, 9.7,27.5, 32.5 Jy [9a] |
| SIRTF/MIPS (SWIRE Legacy) | 8.9 deg2 | 24, 70, 160 m | 0.45, 6.3, 60 mJy [9b] |
| Galex | deg2 | 1305-3000 Å | [10] |
The wealth of data available for almost a thousand of clusters allows to study the properties of cluster galaxies, their evolution (both with lookback time and during the infall in the cluster), while keeping the different galaxies classes separated. At the time of this writing, the accumulated sample is already the largest at high redshift ever studied. In a first exploratory study, we focus on the evolution of both the reddest galaxies and of the whole cluster galaxy population. Due to space limitations, we summarize results for only the latter. Figure 4 shows the Schechter (1976) characteristic magnitude, , in the band ( Å), for some of our clusters. The upper curve shows the expected relationship between redshift and if stars do not evolve, and it is clearly rejected by the data. A model in which stars form at (middle curve) reproduces well the faintest (at a given redshift, id est the curve traces well the upper envelope of the data points). Clusters with brighter than the prediction of a model (bottom curve), show a re-youngening, due to a secondary star–formation activity happened at “low” redshift, maybe related to the Butcher–Oemler effect (Butcher & Oemler 1984). The reader is invited to refer to Andreon et al. (2003b) for details.
4 Conclusion
The first optical and spectroscopic observations of the XMM–LSS fields observed during the AO-1 period show the feasibility of the cosmological XMM–LSS program, and give interesting results on the galaxy evolution up to .

References
- (1) Andreon S. et al, 2003a, in preparation
- (2) Andreon S. et al, 2003b, in preparation
- Butcher & Oemler (1984) Butcher, H. & Oemler, A. 1984, ApJ, 285, 426
- (4) Haiman Z., Mohr J. J., Holder G. P., 2001, ApJ, 553, 545
- (5) Pierre et al. 2003, A&A, submitted (astro-ph/0305191)
- Schechter (1976) Schechter, P. 1976, ApJ, 203, 297
- (7) Valtchanov I. et al 2003, A&A, submitted (astro-ph/0305192)
- (8) Willis et al. 2003, in preparation