Catching NGC 4051 in the low state with Chandra
Abstract
We report the results from a Chandra TOO observation of the low-luminosity Narrow Line Seyfert 1 galaxy NGC 4051, obtained during a 6-week duration low-flux state in 2001 February. During the Chandra observation, the 2-10 keV source flux was erg cm-2 s-1, corresponding to a 2-10 keV luminosity of erg s-1. We confirm the absence of strong extended soft X-ray emission in NGC 4051, and that the low state spectrum is dominated by the central point source. The X-ray spectrum has an unusual, hybrid shape, very soft below keV (and which we model with a black body of temperature 0.14 keV) and very hard at higher energies (power-law slope of ). The lightcurves in both soft and hard bands are significantly variable and correlated, implying a connection between hard and soft components and proving that the hard component is dominated by primary continuum emission and is not due to pure reflection from distant cold material. However, a comparison with RXTE data obtained during the same 2001 low state suggests the presence of unusually prominent disk reflection features, which may help to explain the apparent upwards curvature and extreme hardness of the Chandra spectrum above a few keV. The shape of the 2001 low state spectrum is consistent with that observed in a brief ( d) low flux excursion during the source’s normal state in April 2000, suggesting that emission processes during the low state are not significantly different to those in the normal state. The unusual spectral shape observed in the low state may be a continuation to low fluxes of the normal, flux-dependent spectral variability of the source.
1 Introduction
NGC 4051 is a nearby (), low luminosity ( erg s-1) AGN, optically classified as a narrow-line Seyfert 1 (NLS1). In common with other members of the NLS1 class, and following the well-known anti-correlation of X-ray variability amplitude with luminosity (e.g. Green, McHardy & Lehto 1993; Nandra et al. 1997), NGC 4051 typically shows large amplitude X-ray variability on short time-scales (e.g. Lamer et al. 2003; McHardy et al., in prep.). In the medium X-ray band (2-10 keV), the X-ray continuum slope is well-correlated with flux, with photon index () increasing from to 2.4 over a factor increase in observed flux (Lamer et al., 2003). Flux variations in the EUV and 2-10 keV bands are also very well-correlated (Uttley et al., 2000a), but a recent Chandra High Energy Transmission Grating (HETG) observation of NGC 4051 (Collinge et al., 2001) suggests this result is due to a correlation between the X-ray power-law continuum and a ‘soft excess’ which dominates in the soft X-ray band, rather than variations in the X-ray power-law alone.
Besides the short-term X-ray variability, NGC 4051 also shows long-time-scale flux changes, as revealed by monitoring with the Rossi X-ray Timing Explorer (RXTE). In particular, on two occasions - in 1998 and later in 1999 - NGC 4051 appeared to enter a distinct, prolonged low-flux state which lasted 5 and 3 months respectively (Uttley et al., 1999, 2000b), during which the absolute amplitude of X-ray variability was much smaller than the large amplitude variations normally seen. The X-ray spectrum of NGC 4051 during this ‘low state’, was measured simultaneously by BeppoSAX and RXTE in May 1998 (Guainazzi et al., 1998; Uttley et al., 1999) and found to be extremely hard () above keV, also showing a prominent ( keV) iron K line. Below 4 keV, the spectrum was found to be extremely soft (with a power-law fit giving ). Flux variability in either the soft or hard band was not detected during these day-long observations. The natural interpretation of the low state was that the central X-ray source had somehow switched off, revealing the hard spectrum and prominent fluorescent iron K line expected from distant ( light-months) cold material, possibly the molecular torus, which did not have time to respond to the long-term change in flux (Guainazzi et al., 1998; Uttley et al., 1999). The soft X-rays might also correspond to some extended component, a view supported by a claim by Singh (1999) that ROSAT HRI observations of NGC 4051 showed evidence for extended ( arcsec) soft X-ray emission, of a comparable flux to that observed during the low state.
The hypothesis that the low states in NGC 4051 represent some physically distinct behaviour of the AGN, possibly with the central X-ray source switching off, rather than merely a low-flux epoch associated with the same variability processes which produce the short-term variability, is supported by optical monitoring observations. Peterson et al. (2000) have shown that during the 1998 low state, the variable component of the He II 4686Å emission line seems to disappear while H remains strongly variable, implying that the variable component of the ionizing continuum above eV disappears during the low state, possibly due to the transition of the inner accretion disk to a radiatively inefficient advectively dominated accretion flow (ADAF).
In order to test models for the origin of the low states in NGC 4051, we were awarded a 50 ks target of opportunity observation (TOO) using the ACIS-S instrument on Chandra, to measure the continuum spectral shape of the primary X-ray source spectrum over a broad band, and disentangle the soft continuum of the central source from any extended soft emission. NGC 4051 entered into a low state of months duration in January 2001, and was observed by Chandra in early February, as described below.
2 Observation, data reduction and analysis
The Chandra TOO of NGC 4051 was triggered using data from our continuing long-term monitoring observations of NGC 4051 with RXTE (Fig. 1). In late 2000, NGC 4051 showed a decline in long-term average X-ray flux over several months, before entering a prolonged low-flux state around 2001 Jan 10.
2.1 Data reduction
Chandra successfully observed NGC 4051 on 2001 Feb 6 06:24:59-20:55:58 UT, for a total useful exposure of ksec with the spectroscopic array of the ACIS instrument (ACIS-S) without any transmission grating in place. The source was located on the back-illuminated chip (S3) and offset by the standard 20″ from the default on-axis location to avoid a node boundary (see the Chandra Proposers Observatory Guide [POG]). We chose a 1/8 subarray mode with 0.43 s frametime to mitigate pile-up effects, resulting in a 1′ x 8′ image. The analysis of the data was performed using standard CIAO tools (version 2.2.1). We regenerated the level 2 event file corrected with the latest gain and aspect data. We extracted the spectrum of the source from a 12 pixels radius ( 6″) circular aperture, to yield a total of 57760 counts. Assuming the empirical spectral model which we use later (Section 4.1), we estimate from Web-PIMMS a pileup fraction of %. The background spectrum was extracted from a 7000 pix2 rectangular region, away from the target and containing no obvious sources. Because the ACIS QE degradation111http://cxc.harvard.edu/cal/Acis/Cal_prods/qeDeg/index.html affects our data, we used the ‘corrarf’ code provided by the Chandra X-ray Center to correct all the effective areas used in our spectral analysis. Throughout the paper, we use XSPEC v11.0.1 to carry out spectral fits.
2.2 Extended emission in the Chandra image
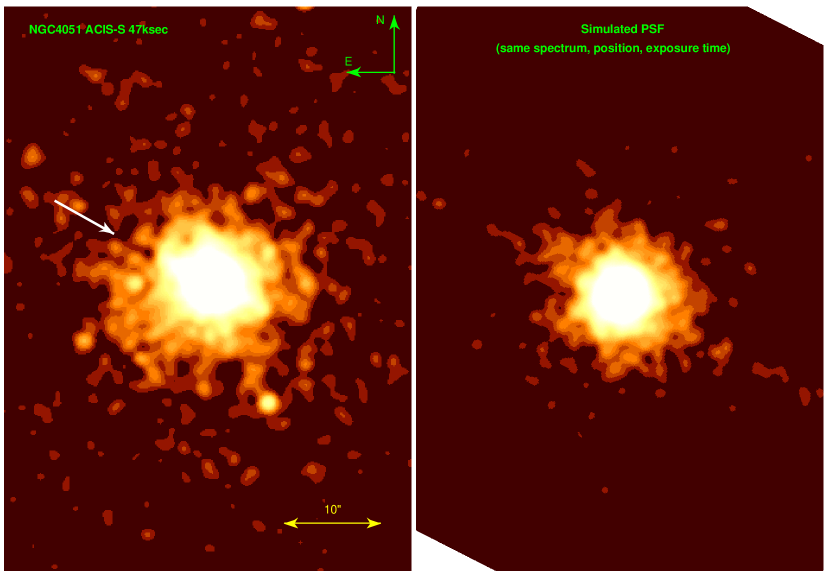
To detect any possible weak X-ray extended emission, we extracted and smoothed the image of the source and compared it with a simulated Chandra PSF calculated with ChaRT222http://cxc.harvard.edu/chart at the exact location of the source (assuming our best fitting empirical spectral model described later in Section 4.1). The observed and simulated images are shown in Fig. 2. Fitting the azimuthally averaged source radial profile with the simulated PSF radial profile indicates only weak extended emission in the SE direction out to 20″. Details of nearby source detections and further imaging analysis will be presented in a forthcoming paper (Fruscione et al. in preparation), so we do not carry out any detailed analysis of extended emission here. However, we note that excluding the readout streak, we find 796 counts in the annular region 12-25 pixels (6″-12.5″) from the central source, which is dominated by the central PSF so that any extended emission contributes % of the total observed counts, and is intrinsically very weak (i.e. much weaker than the component claimed by Singh 1999). This result strengthens the finding of Collinge et al. (2001), based on the zeroth order HETG grating image, that there is no significant extended soft X-ray emission in NGC 4051, and implies that the central source spectrum we extract is dominated by nuclear emission and not contaminated by any extended component.
3 Broadband spectral shape and lightcurves
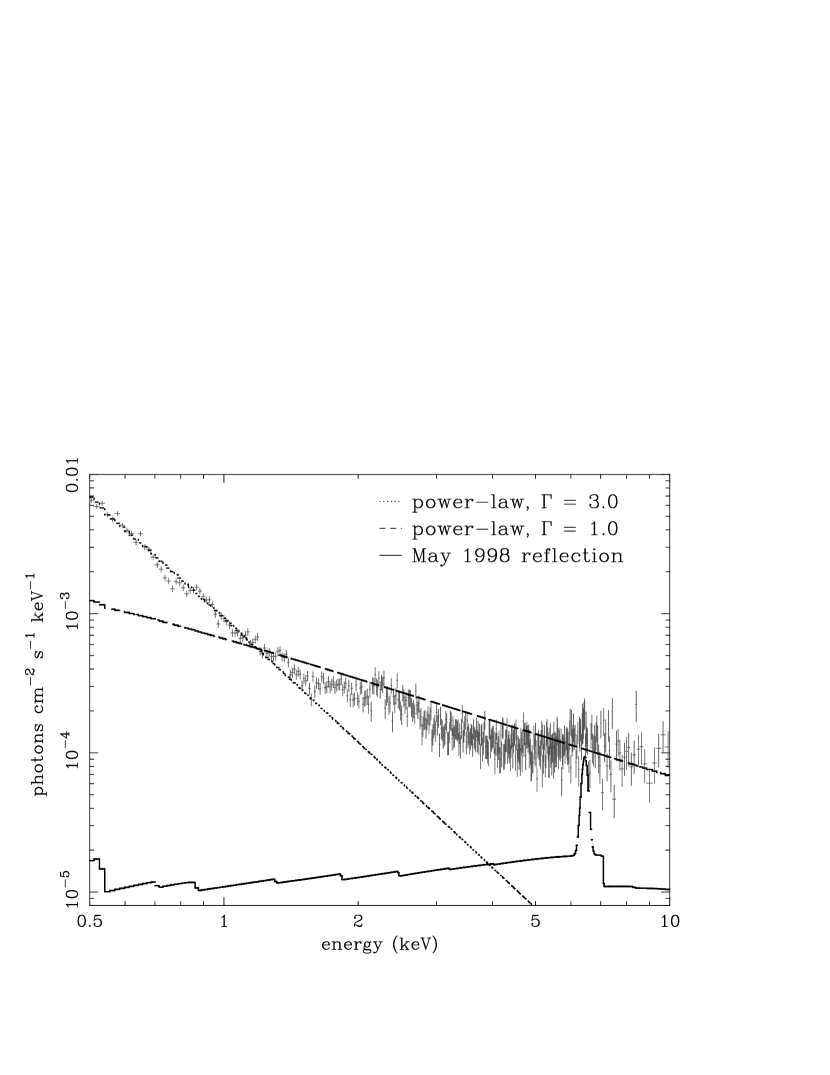
To demonstrate the broadband shape of the Chandra 2001 low state spectrum relative to different power-law slopes, we first plot an unfolded spectrum (Fig. 3) fitted to a simple absorbed power law of fixed photon index and Galactic absorbing column, (from Elvis, Lockman & Wilkes 1989). The power-law model is plotted as a dashed line and for comparison we plot a steep power law model () as a dotted line. We also plot the model of a reflection spectrum (including iron K line) that provided a good fit to the 1998 May low state spectrum above 4 keV (Uttley et al., 1999). Note that although unfolded X-ray spectra are always model-dependent, that dependence is weak for broadband continuum models of the type we plot here, so that in the 0.5-10 keV range the unfolded data relative to all three models is almost identical. Therefore the unfolded observed spectrum is a good representation of the true continuum shape. Clearly the 2001 low state spectrum has the same ‘hybrid’ form of a very hard component above a few keV, and a soft component at low energies, as seen in the 1998 low state. However, the normalization of the hard component is a factor greater than in 1998 May, suggesting that the primary continuum itself is intrinsically hard.
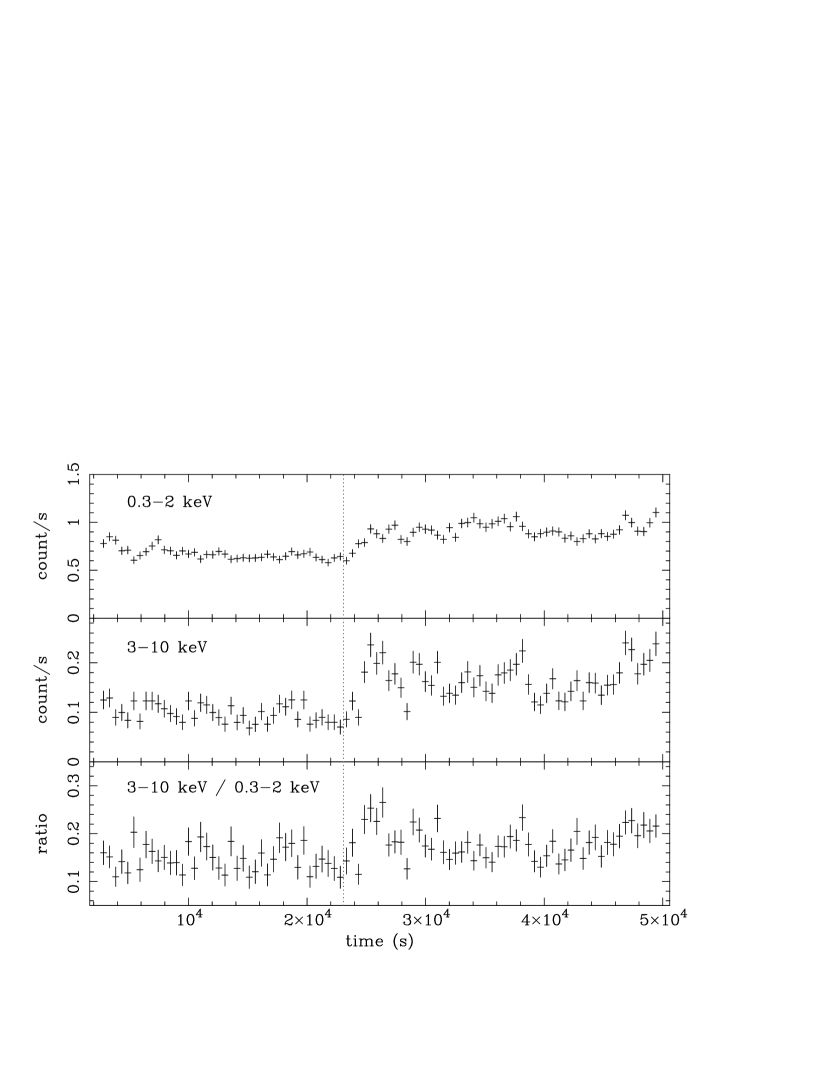
In Fig. 4 we show the Chandra lightcurves in soft (0.3-2 keV) and hard (3-10 keV) bands, together with the corresponding hardness ratio. Clearly the soft and hard lightcurves are well correlated (CCF analysis shows any lag must be less than ks), but the hard band is significantly more variable than the soft band (hard band fractional rms 29% versus 16% in the soft band), so that the broadband continuum becomes harder with increasing flux. The large-amplitude continuum variations in the hard band confirm that we are seeing the primary continuum during the 2001 low state, and not simply emission from a distant reflector.
4 Spectral fits and comparison with previous observations
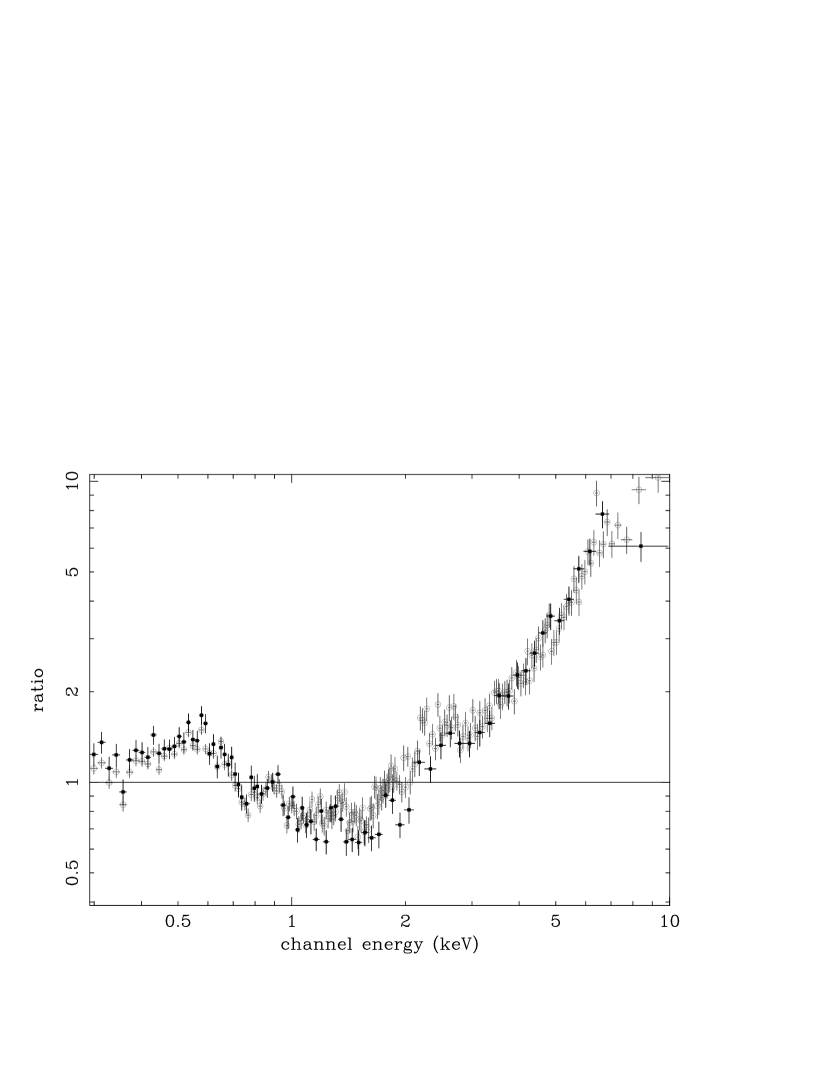
The shape of the broadband spectrum of NGC 4051 in the low state is clearly an unusual hybrid of an extremely hard component above a few keV and a prominent soft excess at lower energies. We can confirm that this unusual shape is not caused by pileup effects (which would redistribute low energy photons to higher energies and so harden the spectrum) by comparing the spectrum with a spectrum extracted from only the wings of the PSF (excluding counts from a circle of 1.5” diameter centred on the source). In Fig. 5 we plot the ratio of the total spectrum and PSF wing spectrum to the same simple power-law (renormalized by 0.223, the ratio of counts in the two spectra, to fit the PSF wing spectrum). The effect of pileup is to harden the soft component of the spectrum somewhat, but the discrepancy is small, consistent with the estimated pileup fraction of 14%, and should not affect the broad interpretation of the spectral shape, although we should be cautious about assigning too much significance to the specific spectral models and parameters which we fit. With this caveat in mind, we proceed with more detailed spectral fits to empirically describe the spectral shape and variability. Unless otherwise stated, fits to the broadband Chandra spectrum are carried out to data in the 0.5-10 keV range, in order to mitigate effects of pileup and uncertainties in calibration below 0.5 keV.
4.1 An empirical model for the low state spectrum
The 2001 February low state spectrum in the 3-10 keV band can be well-fitted (reduced , for 259 degrees of freedom) with a hard power law () plus an unresolved Gaussian at 6.4 keV, with equivalent width eV (absolute line flux photon cm-2 s-1). Below 3 keV, the spectrum is complex (as is apparent in Fig. 3), probably due to a combination of emission/absorption features, slight pileup effects on high data and possibly an intrinsically unusual continuum shape. Therefore we cannot obtain a good overall spectral fit with any model we have attempted. However we obtain a simple approximation to the broadband spectral shape ( for 424 degrees of freedom) by fitting a blackbody plus power law, together with an absorption edge at 0.7 keV (optical depth ) and an unresolved emission line at 0.89 keV (these features likely correspond to the 0.74 keV Ovii edge and 0.91 keV Neix emission line reported by Collinge et al. 2001). The best-fitting flux for the 0.89 keV line feature is photon cm-2 s-1, consistent with that observed by Collinge et al. (2001). The best-fitting blackbody and power law parameters are shown in Table 1 (together with hard and soft-band fluxes) and the data, model and data/model ratio are plotted in Fig. 6. Note that due to the statistically poor fit, we cannot quote meaningful errors on the fit parameters. The observed fluxes correspond to luminosities of erg s-1 and erg s-1 in the 0.5-2 keV and 2-10 keV bands respectively (assuming km s-1 Mpc-1).
The power law plus blackbody combination leads to a steeper power law than obtained when fitting only above 3 keV, but residuals above 5 keV suggest that the model underestimates the hard flux, implying that some spectral curvature may be present or some additional spectral complexity at hard energies (Section 4.3). Replacing the blackbody with a steep power law does not worsen the fit, ( remains at 1.56 for a best-fitting power-law photon index ) . Extending the fitted spectral range to lower energies (0.4 keV) shows an apparent flattening of the continuum around 0.5 keV which can be replicated by the blackbody fit but not the soft power law, although we cannot be certain that this flattening is not due to pile-up effects. However, (Collinge et al., 2001) also find that the soft excess observed in the ‘normal’ state rolls over at low energies and is more consistent with a blackbody than a power law, so we continue with the assumption that a blackbody provides a good approximation to the soft excess in the low state.
All the simple models we have fitted to the broadband spectrum leave residuals above the model at energies keV (see Fig. 6). It is likely then that our power-law model for the continuum at harder energies is incorrect. One possibility is that significant reflection is present in the spectrum, leading to apparent upwards curvature towards hard energies. To test this possibility, we included a reflection component in the model. We used the pexrav model in xspec (Magdziarz & Zdziarski, 1995), assuming solar abundances and fixing inclination at 30∘ and power-law cutoff energy at 100 keV although note that these latter two parameters do not affect substantially the results of the fit. First, we assumed that the direct power-law continuum included in the observation is the primary continuum to be reflected (i.e. the reflection responds to the change in continuum flux and in the low state). The fit is improved substantially (=1.42 for 424 d.o.f.), with the residuals at high energies being significantly reduced, as expected. The best-fitting photon index is still quite hard , but the covering factor of the reflector is , and this number cannot be substantially reduced without worsening the quality of the fit333Because the fit is still not formally acceptable, no meaningful standard errors can be given. However we note that a reduction of covering factor to the value of 1.0 expected for a steradian sky coverage of the reflector (as seen from the continuum source), results in ..
Such a large covering factor of reflection might be expected if the reflector is distant (and hence is still illuminated by the normal state continuum), for example, if the reflector corresponds to the possible pure reflection spectrum observed in the May 1998 low state, which could originate from cold material light months or light years from the continuum source (Guainazzi et al. 1998,Uttley et al. 1999). Therefore, we kept the direct primary continuum slope free and fixed the illuminating continuum slope and normalisation at 1 keV to , photon cm-1 s-1 keV-1 respectively, to match those in the reflection model used to fit the 1998 May RXTE PCA plus BeppoSAX MECS spectra (Uttley et al., 1999), to see if that model might explain the residuals seen at hard energies in the 2001 Feb Chandra spectrum. With =1.52 for 425 d.o.f. (for observed primary continuum ), the best fit is worse than the previous fit obtained by forcing the illuminating continuum to be identical to the direct primary continuum. Furthermore, the fit requires a covering factor , compared to which was used to fit the 1998 May spectrum. Since we fixed the normalisation of the illuminating continuum to that fitted to the 1998 May spectrum, a larger covering factor might correspond to a greater time-averaged (over months) illuminating continuum flux prior to the 2001 low state. However in that case we would also expect a comparably larger 6.4 keV narrow line flux which we do not observe. Therefore the high energy residuals from the power law cannot be self-consistently explained by the presence of a reflection spectrum from a distant reflector. Due to the difficult physical interpretation of any reflection model, we will continue to use a simple power law in our fits to the broadband Chandra spectrum, as an approximate representation of the hard spectral component.
4.2 Broadband spectral variability within the low state
We can split the Chandra observation into two halves of exposure ks and ks respectively, corresponding to the low and high-flux epochs seen in the lightcurves in Fig. 4 (the split is denoted by a dotted line in the Figure), in order to examine spectral variability in more detail. Fitting the simple empirical (no reflection) model used to fit the spectrum of the whole observation, we find that only the relative normalizations of the black body and power-law components change markedly, with blackbody and power law normalization increasing by 28% and 68% respectively between low and high flux epochs, while the black body temperature, power-law slope, edge depth and line fluxes do not change noticably. The fit is not particularly good however (=1.54 for 643 d.o.f.), partly due to the presence of positive residuals at high energies. The relatively small variation in the flux of the soft spectral component compared to the hard component is as expected considering the lower variability seen in the soft band (Fig. 4).
We can also use the low and high-flux data obtained during the low state to further test whether a constant reflection component from a distant reflector could be present in the spectrum. We applied the same fixed reflection model (i.e. assuming May 1998 parameters) as used in Section 4.1, fixing the covering factors to be the same in both low and high flux spectra (so the reflected component flux is constant). The best-fitting model again produced a better fit than the empirical power-law model described above (=1.31 for 641 d.o.f.), but requires . Furthermore, the model requires the direct power-law continuum to be steeper at low fluxes than at high fluxes ( versus ), contrary to the result of Taylor et al. (2003) that the varying spectral component hardens as flux decreases in NGC 4051, due to spectral pivoting. Again, errors cannot be well defined as the fit is still not formally acceptable, but if we force the low-flux direct continuum to be flatter or the same as the high-flux direct continuum, we obtain a best fit for for the identical slope case (for ), but the fit is significantly worse than when the slopes are left free (=1.42 for 641 d.o.f.). The observed broadband spectral variability is therefore inconsistent with the presence of a constant reflection component from a distant reflector, of a magnitude which can explain the hard residuals. We stress however that a much weaker reflection component (comparable to that observed in May 1998) may be present, but it does not contribute signficantly to the hard continuum spectral shape.
4.3 Spectral shape above 3 keV
Although a simple power law plus Gaussian model provides a good fit to the 3-10 keV Chandra spectrum (Section 4.1), the fitted power law is extremely hard (). As noted in the preceding Sections, combined black body plus power law fits to the 0.5-10 keV spectrum favour a steeper (and perhaps more plausible) photon index of , but show significant residuals at energies above 5 keV (Fig. 6). As shown in the previous Sections, these hard residuals in the broadband fits cannot be simply explained by including a constant reflection component as expected from a distant reflector. It might be argued that the model is incorrect at softer energies, e.g. if the soft component is in fact harder than the assumed black body, then the fitted slope of the hard power law component would steepen to compensate, resulting in an underprediction of the flux at harder energies. Due to the complexity of the spectral shape at soft energies and the expected distortion of the spectrum due to pile-up, we cannot easily determine the best model for the soft spectral component. Therefore, to take into account the possibility of biases in the spectral fitting due to an incorrectly modelled soft spectrum, we now investigate the spectral shape in the 3-10 keV range, ignoring the data at lower energies.
We first test the constant reflection model fitted to the broadband low and high flux spectra in Section 4.2 (direct continuum allowed to be free, we do not include the soft spectral components: black body, edge and soft Gaussian in the fit). We find an acceptable fit ( for 329 d.o.f.), and hence can determine meaningful confidence limits on the fit parameters. We confirm the result of the broadband fits that the hard spectral shape cannot be largely due to reflection from a distant reflector, finding a 99% confidence upper limit on covering factor and corresponding upper limits on low and high-flux direct continuum slopes of and respectively, i.e. the varying continuum must itself be intrinsically hard.
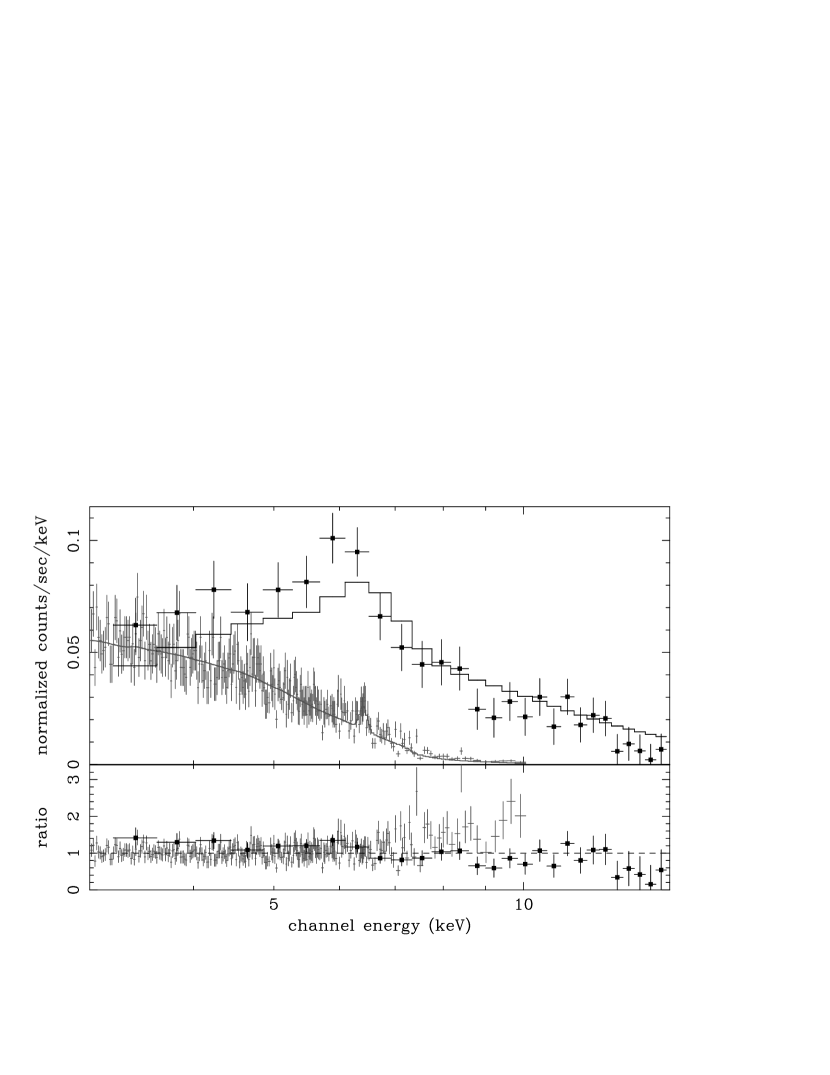
An alternative possibility to explain the hard spectral shape is that it may be associated with strong disk reflection from close to the central black hole, which is boosted by gravitational light bending effects (e.g. Fabian & Vaughan 2003). In this scenario, the shape of at least some part of the hard residuals in the broadband fits above 5 keV may be caused by unmodelled emission in the form of a prominent broad iron line and the reflection component associated with it. To test this possibility, we first investigated the spectrum at higher energies using data from RXTE, which has a greater collecting area and hence greater sensitivity to broad line features than Chandra. We combined RXTE PCA data from PCU2 (which is continuously switched on), from all observations between 2001 January 10 and 2001 February 23, using standard reduction techniques and selection criteria (e.g. Lamer et al. 2003). The resulting 3-15 keV spectrum shows a prominent feature at keV, which may be a strong broad diskline. In order to test whether such a broad line feature might be present in the Chandra spectrum (but is not obvious due to its broadness combined with the low at high energies) we have attempted to fit both the Chandra 3-10 keV spectra and RXTE 3-15 keV PCA spectra with the same model of a power law, plus narrow Gaussian (adopting the best-fitting line flux from Table 1) plus Laor diskline (for a maximally rotating black hole, Laor 1991). We fix the diskline parameters to be the same in both Chandra and RXTE fits, but allow the power law normalization to vary between the fits. We allow the power law normalization to vary to account for the different fluxes observed during the Chandra and combined RXTE observations. We caution that since the source flux is particularly low, systematic errors in the RXTE PCA spectrum may arise due to uncertainties in the background model (e.g. see Lamer, Uttley & McHardy 2000). Therefore, the fit we obtain should be taken as merely indicative of whether or not a broad diskline-like feature could plausibly be present in the Chandra spectrum, rather than an attempt to fit a realistic model (in this context, we further note that a simple power-law is used to approximate what may in fact be a reflection-dominated continuum).
The data and best-fitting models for both spectra are plotted in Fig. 7. A reasonable fit is obtained to both spectra (combined for 282 degrees of freedom) for a model with power law slope and prominent diskline flux of photon cm-2 s-1 (corresponding to line equivalent widths of 1 keV and 1.6 keV in the Chandra and RXTE spectra respectively), for line energy keV, emissivity index , a fixed disk inclination angle and inner and outer emitting radii of 1.23 and 33 gravitational radii respectively. The fit shows that the prominent broad diskline-like feature seen in the RXTE spectrum could be present in the Chandra spectrum, and this feature may be the cause of some of the high-energy residuals observed in the broadband spectral fit.
Some positive high energy residuals remain in the Chandra spectrum however, and in the opposite sense to those in the RXTE spectrum. It is likely that at hard energies, the RXTE PCA spectrum may be significantly affected by uncertainties in the background model, so we next only fit the Chandra 3-10 keV data with a diskline including an additional reflection component to explain the hard continuum shape in a self-consistent way. We freeze the diskline parameters at those values obtained in the previous fit to the RXTE and Chandra spectra, and also include a reflection component tied to the direct power-law continuum shape. The strength of the reflection component is not well constrained (due to the degeneracy with the hard power law continuum which is required). However, we note that a covering factor (for ) is formally acceptable ( for 260 degrees of freedom) and consistent with the large equivalent width of the diskline ( eV).
4.4 Comparison with previous observations
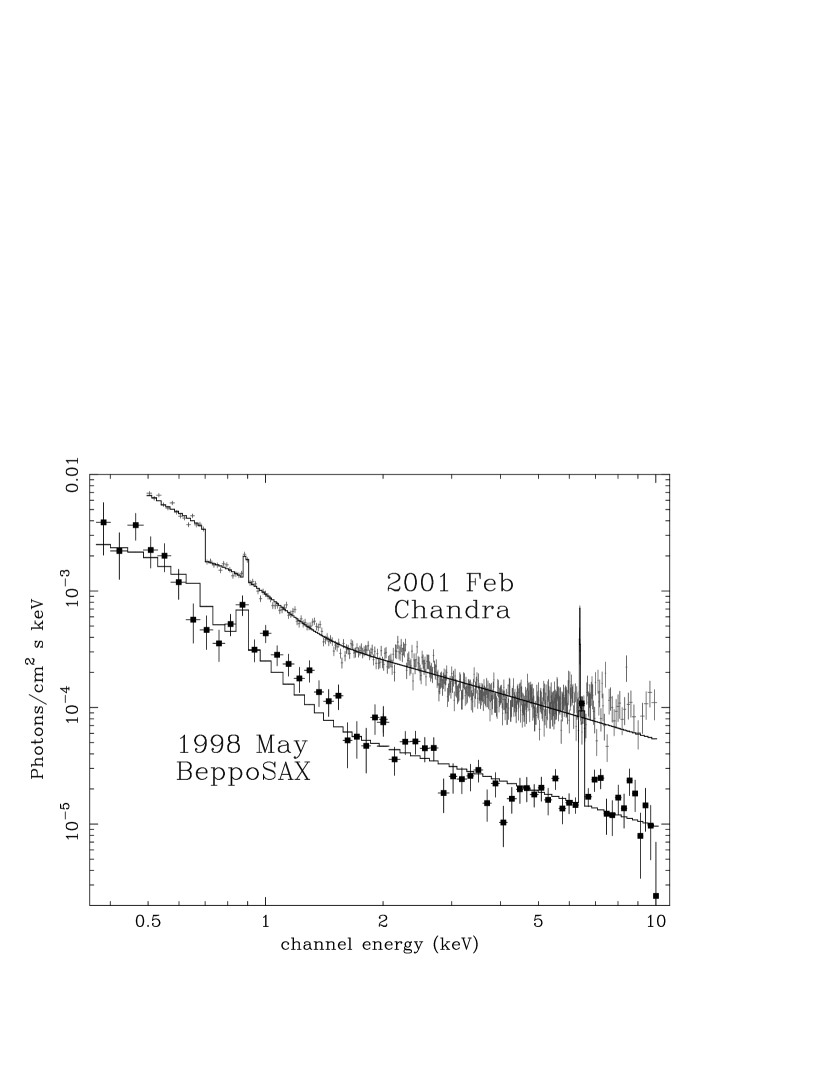
The broadband continuum shape of the extended low state spectrum measured by Chandra in 2001 February is remarkably similar to that observed by Chandra during a brief (duration d) low flux epoch in 2000 April, while the source was in its normal high flux, highly variable state (Collinge et al., 2001). To compare the shapes of 2000 April and 2001 February spectra, we fitted our approximate, blackbody plus power law model to the April 2000 low flux epoch data444Corresponding to the 1st order MEG spectrum obtained during the final 15 ksec of the April 2000 observation, grouped to counts per spectral bin used by Collinge et al. (2001). We allowed only the blackbody and power-law normalizations and the depth of the 0.7 keV edge to vary. The data/model ratios are shown in Fig. 8, together with the ratios for the fitted Chandra spectrum (Section 4.1) for comparison, and the fit parameters are shown in Table 1. We also carry out the same type of fit on the BeppoSAX LECS and MECS spectra obtained during the 1998 low state (see Fig. 8 and Table 1). The fit is not very good, although the broad continuum shapes of both the 1998 low state and 2001 low states seem to match up rather well (see Fig. 9). It is perhaps not surprising that significant deviations from the model remain in the BeppoSAX data, since when the source continuum flux is exceptionally low (as in 1998 May), weak constant-flux components in the spectrum (e.g. unresolved emission lines) are likely to be revealed. Therefore we conclude that, although our simple model does not adequately fit the detailed structures in the spectra, the same hard and soft spectral components can approximate quite well the broadband continuum shape of both the 1998 and 2001 low states, as well as the brief low flux epoch observed in April 2000 while the source was in a normal state.
5 Discussion
The X-ray spectrum of NGC 4051 during the 2001 low state is unusual, dominated by a very hard component () above a few keV, and a very soft component at lower energies (, although a keV blackbody may be a more appropriate model). The question naturally arises as to what are the origins of these spectral components. In the 1998 low state spectrum, the hard continuum (and prominent iron K line) above keV and the much softer continuum at lower energies (both of which did not vary significantly), were interpreted, respectively, as being pure reflection from distant material and extended soft emission (Guainazzi et al., 1998; Uttley et al., 1999). We have seen in Section 2.2 that the soft emission component in the 2001 low state is not extended in the Chandra image, but originates from the unresolved central source. This fact, together with a detailed spectral analysis of the Chandra observation, show that the unusual spectrum observed in 2001 cannot be explained by the distant-reflection/extended-emission model used to explain the 1998 low state spectrum. Instead, the emitting region must be small, so that a substantial part of the emission can be significantly variable on time-scales of hours, suggesting that both hard and soft components represent mainly the primary continuum emission. This result does not necessarily invalidate the original interpretation of the 1998 low state spectrum, since this earlier spectrum was obtained when the continuum was significantly fainter than observed in February 2001, so that reflection from distant material might have been important. Furthermore, a reflection model provided a significantly better fit to the 1998 low state spectrum measured by BeppoSAX than a power-law model (Guainazzi et al., 1998). Indeed, the continuing presence of a relatively weak, narrow Fe K line in the 2001 low state spectrum might imply that the reflection component seen in May 1998 is present but largely masked by the intrinsically hard primary continuum in the 2001 low state.
Having established that the 2001 low state spectrum is probably dominated by the primary continuum emission, we must consider how this unusual spectral shape relates to the spectrum observed during the source’s normal state. In fact it appears (see Section 4.4) that the 2001 low state spectrum is not that unusual compared to the spectrum observed at comparable flux levels during the normal state. In other words, there may be a simple monotonic relation between continuum spectral shape and X-ray flux which is independent of whether the source is in a prolonged (i.e. weeks) low flux state or a much briefer (hours to days) excursion to low fluxes. It is likely that the extreme hardness of the continuum at very low fluxes is a result of the continuation of the correlation between spectral slope and continuum flux which is observed at higher fluxes (Guainazzi et al., 1996; Lamer et al., 2003). It is tempting to explain this correlation, which is observed in other AGN (e.g. Lamer et al. 2000, Vaughan & Edelson 2001) in terms of thermal Comptonization models, where increases in the seed photon flux cause corresponding increases in the hard Comptonized flux but also cool the Comptonizing medium so that the emitted spectrum steepens at higher fluxes and the spectrum effectively pivots about a fixed point at high energies (Zdziarski et al., 2003). In fact, Taylor, Uttley & McHardy (2003) have shown using a model-independent technique that in medium-energy X-rays (2-15 keV), the spectral variability of NGC 4051 is consistent with a combination of spectral pivoting of a varying power-law together with a constant hard spectral component. It is possible that in the low state, the constant hard component is more fully revealed, which might partly explain the deviations from a simple power-law observed at hard energies.
We next consider how the spectrum above a few keV can be so hard at low fluxes (irrespective of the duration of the low flux state), and how the hard continuum relates to the soft spectral component. The extremely hard continuum observed in the low state is difficult to explain using conventional thermal Comptonization models (e.g. Haardt, Maraschi & Ghisellini 1997), so that non-thermal models may be required. Alternatively, if the hard component also contains a substantial disk-reflection component (as suggested by the RXTE data, see Section 4.3), this would allow the primary continuum to be steeper than the observed continuum, so that standard thermal Comptonization models might still be appropriate. It is unclear how a disk reflection component can be so strong, unless the disk somehow sees a much greater primary continuum luminosity than we observe (e.g. if the continuum is beamed towards the disk through gravitational light bending effects, Fabian & Vaughan 2003). However, we note that evidence for an unusually strong iron diskline at relatively low continuum flux levels has been reported in the Seyfert 1 galaxy MCG-6-30-15 (Wilms et al., 2001). Fabian & Vaughan (2003) have shown that the weakly-varying hard component in the spectrum of MCG-6-30-15 may be attributed to a strong disk reflection spectrum (see also Taylor et al. 2003), so that at low fluxes the source should start to become reflection dominated. Since the normal spectral variability of NGC 4051 also implies the presence of a constant (or weakly varying) hard component (Taylor et al. 2003), it is natural to infer that strong disk reflection should be present in the low state of NGC 4051, which may dominate over any constant reflection from the torus, even at low fluxes.
The problem of explaining the hard continuum component in the low state of NGC 4051 is compounded by the fact that it varies together with, and with greater amplitude than, the soft component. If the soft component is a source of seed photons for a Comptonizing corona (perhaps from the hot, inner accretion disk), one would not expect the hard, multiply scattered X-rays to vary more than the soft photons. The problem may be resolved if a substantial, constant component, which does not contribute seed photons is present in the soft X-ray band. The factor reduction in fractional variability from the hard to the soft band can be accounted for if half the observed soft flux arises from a constant component (perhaps extended emission on scales pc so that it is unresolved by Chandra). Note that the absence of varying Heii emission but presence of variable H during the low state (Peterson et al., 2000) might be explained if, for whatever reason, the variability amplitude in the low state is smallest in the EUV band, but increases again towards the UV.
Although we can explain the spectral variability of NGC 4051 within the low state by invoking a constant soft component in addition to a variable soft component, we cannot rule out the possibility that the spectral variability is intrinsic to the primary continuum itself. Furthermore, we cannot be certain that the blackbody and power-law components that we use to model the low state spectrum really represent physically distinct components (such as an accretion disk and corona). It is possible that the reason that both hard and soft components vary together is that they have the same origin, perhaps in something like the hybrid thermal/non-thermal plasma which can successfully fit both the soft excess and power-law components in the spectrum of the black hole X-ray binary Cyg X-1 in its soft state (Gierlinski et al., 1999).
Finally we note that, since there is no apparent difference between the low state spectral shape and that observed during a low flux epoch in the normal state, then the low state may not be as special as originally thought. This result ties in well with the discovery (Uttley et al., in prep.) that the appearance of low states in NGC 4051 could be related to the rms-flux relation which is intrinsic to the normal variability process in AGN and X-ray binaries (Uttley & McHardy, 2001). Because of the rms-flux relation, short term variability amplitude is correlated with long-term flux, so that a large decrease in flux on long time-scales is also accompanied by a corresponding large reduction in short time-scale variability amplitude, producing the distinctive ‘low states’. We therefore consider it likely that the low states in NGC 4051 are simply prolonged low-flux epochs in the normal life of the X-ray source, i.e. they are caused by the same physical process which produces the flux variability on other time-scales and do not correspond to any distinct transitions in the physical properties of the source. Although the low state of NGC 4051 does not appear to be physically distinct from the normal state of the source, it does allow an excellent opportunity for further TOOs to target one extreme of the flux-correlated spectral variability in NGC 4051, enabling further progress in understanding the physical origin of the X-ray spectrum and variability in AGN.
6 Conclusions
We have presented results from a Chandra TOO observation of the Narrow Line Seyfert 1 NGC 4051, caught in a 6-week duration low state in 2001 February. We summarize our main results as follows:
-
1.
We confirm the report of Collinge et al. (2001) that there is no strong extended soft X-ray emission component in NGC 4051. The soft X-ray emission during the low state is dominated by the central point source.
-
2.
The nuclear X-ray spectrum of NGC 4051 in the low state has an unusual hybrid shape, very soft below keV ( for a simple, power-law fit) and very hard () at higher energies. Both soft and hard X-ray light curves are variable and well-correlated, the hard X-rays being more variable than the soft. The hard X-ray variability implies that the hard continuum in the 2001 low state is not due to pure reflection from distant cold gas, but must be the primary continuum itself.
-
3.
We parameterize the spectrum with a simple black body plus power-law model. The black body model for the soft emission is favoured over a steep power-law if one takes into account the spectral flattening which we observe below 0.5 keV (but do not fit due to systematic uncertainties at those energies), and is also reported by Collinge et al. (2001) in the normal flux state.
-
4.
The continuum at hard energies shows residuals above the power-law model, suggesting the presence of reflection. However the strength of reflection required, together with an analysis of spectral variability, shows that the deviations from a power-law cannot be simply explained by reflection from distant material (e.g. a molecular torus). An alternate possibility is that the hard residuals are caused by the presence of a strong broad feature, possibly an iron diskline and associated reflection at higher energies. This latter possibility is favored when we consider RXTE data obtained during the 2001 low state.
-
5.
The 2001 low state spectrum is consistent with being the same shape as the spectrum observed in a brief ( d) low-flux epoch during the normal active state of the source, in 2000 April (Collinge et al., 2001). This result suggests that the unusual low state spectrum is not a result of a fundamental physical difference in the emission process between the low and normal states, rather it is the continuation to low fluxes of the normal, flux-dependent spectral variability of the source.
-
6.
The even fainter 1998 May low state spectrum is also consistent with the same hybrid model as the 2001 February spectrum. However, as the hard component to the spectrum was a factor fainter in 1998 May than in 2001 February, and no significant variability was detected in that earlier observation, the reflection interpretation of the 1998 May spectrum remains valid.
References
- Collinge et al. (2001) Collinge, M. J., et al. 2001, ApJ, 557, 2
- Elvis et al. (1989) Elvis, M., Lockman, F. J., & Wilkes, B. J., 1989, AJ, 97, 777
- Fabian & Vaughan (2003) Fabian, A. C., & Vaughan, S., 2003, MNRAS, in press (astro-ph/0301588)
- Gierlinski et al. (1999) Gierlinski, M., Zdziarski, A. A., Poutanen, J., Coppi, P. S., Ebisawa, K., & Johnson, W. N. 1999, MNRAS, 309, 496
- Green et al. (1993) Green, A. R., McHardy, I. M., & Lehto, H. J. 1993, MNRAS, 265, 664
- Guainazzi et al. (1996) Guainazzi, M., Mihara, T., Otani, C., & Matsuoka, M. 1996, PASJ, 48, 781
- Guainazzi et al. (1998) Guainazzi, M., et al. 1998, MNRAS, 301, L1
- Haardt, Maraschi & Ghisellini (1997) Haardt, F., Maraschi, L., Ghisellini, G. 1997, ApJ, 476, 620
- Lamer et al. (2000) Lamer, G., Uttley, P., & McHardy, I. M. 2000, MNRAS, 319, 949
- Lamer et al. (2003) Lamer, G., McHardy, I. M., Uttley, P., & Jahoda, K. 2003, MNRAS, 338, 323
- Laor et al. (1991) Laor, A. 1991, ApJ, 376, 90
- Magdziarz & Zdziarski (1995) Magdziarz, P., & Zdziarski, A. A. 1995, MNRAS, 273, 837
- Nandra et al. (1997) Nandra, K., George, I. M., Mushotzky, R. F., Turner, T. J., & Yaqoob, T. 1997, ApJ, 476, 70
- Peterson et al. (2000) Peterson, B. M., et al. 2000, ApJ, 542, 161
- Singh (1999) Singh, K. P., 1999, MNRAS, 309, 991
- Taylor et al. (2003) Taylor, R. D., Uttley, P., McHardy, I. M. 2003, MNRAS, in press (astro-ph/0304523)
- Uttley et al. (1999) Uttley, P., McHardy, I. M., Papadakis, I. E., Guainazzi, M., & Fruscione, A. 1999, MNRAS, 307, L6
- Uttley et al. (2000a) Uttley, P., McHardy, I. M., Papadakis, I. E., Cagnoni, I., & Fruscione, A. 2000a, MNRAS, 312, 880
- Uttley et al. (2000b) Uttley, P. 2000b, Ph.D. Thesis, University of Southampton
- Uttley & McHardy (2001) Uttley, P., & McHardy, I. M., 2001, MNRAS, 323, L26
- Vaughan & Edelson (2001) Vaughan, S., & Edelson, R. 2001, ApJ, 548, 694
- Wilms et al. (2001) Wilms, J., Reynolds, C. S., Begelman, M. C., Reeves, J., Molendi, S., Staubert, R., & Kendziorra, E. 2001, MNRAS, 328, L27
- Zdziarski et al. (2003) Zdziarski, A. A., Lubinski, P., Gilfanov, M., & Revnivtsev, M., 2003, MNRASin press (astro-ph/0209363)


| Data | ||||||||
|---|---|---|---|---|---|---|---|---|
| Chandra 2001 Feb | 0.63 | 0.14 | 4.2 | 0.99 | 52.4 | 2.5 | 7.0 | 662/424 |
| Chandra 2000 Apr | 0.77 | 0.14aaFixed to Chandra 2001 Feb value | 3.6 | 0.99aaFixed to Chandra 2001 Feb value | 43.3 | 2.2 | 6.0 | 132/86 |
| BeppoSAX 1998 May | 0.52 | 0.14aaFixed to Chandra 2001 Feb value | 1.3 | 0.99aaFixed to Chandra 2001 Feb value | 9.1 | 0.7 | 1.4 | 108/60 |
Note. — Columns give , the optical depth of the 0.7 keV edge included in the fits; the blackbody temperature in keV; the xspec blackbody normalization; the power law photon index; the xspec power law normalization; the 0.5-2 keV flux (units of erg cm-2 s-1); the 2-10 keV flux (units of erg cm-2 s-1); the and number of degrees of freedom (d.o.f.) of the fit to that observation. Note that since none of the fits are formally acceptable, errors are not quoted.