The Ionized Gas and Nuclear Environment in NGC 3783 III. Detection of a Decreasing Radial Velocity in an Intrinsic UV Absorber11affiliation: Based on observations made with the NASA/ESA Hubble Space Telescope. STScI is operated by the Association of Universities for Research in Astronomy, Inc. under NASA contract NAS 5-26555.
Abstract
We report an intrinsic absorber with decreasing outflow velocity in the Seyfert 1 galaxy NGC 3783. This is the first detection of a change in radial velocity in an outflow associated with a Seyfert galaxy. These results are based on measurements from 18 observations with the Space Telescope Imaging Spectrograph aboard the Hubble Space Telescope, obtained between 2000 February and 2002 January. In two intervals separated by 13 and 9 months, the absorption lines in the kinematic component with highest outflow velocity exhibited mean redward velocity shifts of 35 and 55 km s-1, respectively. The rate of velocity decrease was 2.2 0.6 times more rapid in the second interval. No variations in absorption velocities were detected in the other kinematic components. We explore potential interpretations of the observed velocity shifts: radial deceleration of the UV absorber due to a change in either the speed or direction of motion of the outflow, and the evolution of a continuous flow across our line of sight to the emission source.
1 Introduction
Recent surveys with the Hubble Space Telescope (HST) and the Far Ultraviolet Spectroscopic Explorer (FUSE) have shown intrinsic UV absorption is common in Seyfert 1 galaxies, appearing in over half of the objects observed to date (Crenshaw et al., 1999; Kriss, 2002). In most cases, the absorption is blueshifted with respect to the systemic velocity of the host galaxy, indicating radial outflow from the active galactic nucleus (AGN). There is a one-to-one correspondence between the detection of intrinsic UV absorption and X-ray “warm absorption” in Seyfert galaxies, indicating they are closely connected (Crenshaw et al., 1999). The mass outflow revealed by the blueshifted absorption may be a major component of the energetics and circumnuclear environment in AGN (e.g., Mathur et al., 1995; Reynolds, 1997). Currently, the mechanism driving this mass outflow in AGN is not well understood.
Variability of the intrinsic UV absorption appears to be common in Seyferts. In the few objects that have multiple UV spectra at sufficiently high spectral resolution for the accurate comparison of column densities, significant variations are detected in all cases (Maran et al., 1996; Crenshaw et al., 2000a; Kraemer et al., 2002; Crenshaw et al., 2003). In some extreme examples, entire kinematic components have appeared and disappeared on roughly yearly timescales. Strong evidence for column density variations ascribable both to ionization changes in response to the AGN continuum (Kraemer et al., 2001a, 2002) and to changes in total absorption columns in our line of sight to the AGN, i.e., due to transverse motion (Kraemer et al., 2001b; Crenshaw et al., 2003), have been found.
One somewhat surprising finding has been the lack of variability in the absorption kinematics. Although multi-epoch data are sparse, no detections of radial velocity variations have been reported for any intrinsic absorbers in Seyfert galaxies, revealing stability on timescales of at least several years in some cases (e.g., Weymann et al., 1997; Kraemer et al., 2001b). Many of the extreme counterparts to Seyfert absorbers, the broad absorption line (BAL) systems seen in more luminous AGN, have also shown this long-term stability (e.g., Barlow, 1993; Weymann, 2002). Limits on radial acceleration in BALs have been used to assess models of the dynamical forces associated with their mass outflow (Foltz et al., 1987; Weymann et al., 1997). Rare exceptions to this stability have been reported by Hamann et al. (1997) and Vilkoviskij & Irwin (2001), in which centroid radial velocity shifts were detected in relatively narrow absorption line systems in QSOs.
The bright Seyfert 1 galaxy NGC 3783 has exhibited dramatic variability in its UV absorption spectrum. In only four observations with the Goddard High Resolution Spectrograph (GHRS) and the Space Telescope Imaging Spectrograph (STIS) obtained approximately 1 – 5 years apart, new kinematic components appeared in three separate cases (Maran et al., 1996; Kraemer et al., 2001b). No correlation was found between the column densities and continuum flux, indicating these large-scale changes were primarily due to transverse motion of the absorbers (Kraemer et al., 2001b). In part because of this extreme variability, NGC 3783 was selected for an intensive multiwavelength monitoring campaign with HST, FUSE, and Chandra. In this study, we concentrate on variability of the absorption kinematics based on analysis of the STIS spectra obtained during our monitoring campaign. Analyses of the averaged X-ray and UV (STIS and FUSE) spectra are presented in Kaspi et al. (2002, hereafter Paper I) and Gabel et al. (2003, hereafter Paper II), respectively. Full treatment of the variability of the UV and X-ray absorption will be given in subsequent papers.
2 Observations and Results
A total of 18 HST/STIS observations of the nucleus of NGC 3783 were obtained between 2000 February 27 and 2002 January 6 using the E140M medium resolution echelle grating. This grating spans 1150 – 1730 Å with a spectral resolving power of 40,000, sampling the Ly, N V 1238.8,1242.8, C IV 1548.2,1550.8, and Si IV 1393.8,1402.8 resonance lines at a resolution of 8 km s-1. Each visit consisted of two orbits and 4.9 ks of exposure time. A log of the observations and full description of the data reduction are given in Paper II.
A detailed discussion of the UV absorption spectrum is presented in Kraemer et al. (2001b) and Paper II. Here we review some features that are important for the subsequent analysis. During our monitoring campaign, strong absorption was present in Ly, N V, and C IV in three kinematic components, at centroid radial velocities of 1350, 725, and 550 km s-1 relative to the systemic redshift of NGC 3783 ( 0.00976; de Vaucouleurs et al., 1991). For historical reasons, we refer to these as components 1, 3, and 2, respectively. Weak absorption was tentatively detected in a fourth component at 1050 km s-1. The Si IV doublet only appears in component 1. Metastable C III was detected in component 1 in the averaged spectrum, indicating a high density in this absorber ( 109 cm-3; Paper II). Absorption in these components first appeared in the following epochs: component 2 in a 1994 January 16 GHRS spectrum of C IV, component 1 in a 1995 April 11 GHRS spectrum of C IV, and components 3 and 4 in the first STIS spectrum (2000 February 27).
We fit the intrinsic (i.e., unabsorbed) continuum plus emission-line fluxes in each STIS spectrum following the procedure described in Paper II. Each spectrum was normalized by dividing by its fit. We compared the interstellar absorption lines in each spectrum to ensure that there were no wavelength offsets. Specifically, we measured the centroid wavelengths of the Galactic Si IV 1393.8, C IV 1548.2, and Fe II 1608.5 lines in all spectra. For each interstellar line, the standard deviation of the centroids ( 2 – 4 km s-1) is less than a resolution element, indicating accurate relative wavelength solutions for these observations. Centroid radial velocities were then measured for each intrinsic absorption line.
In Figure 1a, the N V, C IV, and Si IV component 1 centroid velocities measured in all STIS spectra are plotted, clearly showing the radial velocity has decreased during the monitoring campaign. We identify three epochs exhibiting marked velocity variations: the first observation obtained 2000 February 27, the intensive phase of the campaign consisting of 13 observations obtained between 2001 February 25 – April 23, and the final observation obtained 2002 January 6. Figure 1b show only the intensive monitoring observations (epoch 2). Careful inspection of Figure 1b reveals no correlations in the centroids measured for the three ions; the fluctuations are likely due to the measurement uncertainties (see discussion below).
Table 1 lists the component 1 velocity measurements for each of the three epochs identified above. Centroids and uncertainties quoted for epoch 2 are the means and standard deviations of the 13 observations obtained during the intensive phase of the campaign. These observations also represent a good statistical sample for determining the random uncertainties associated with measurements in the individual spectra. Thus, we adopted the standard deviations for the 1 errors in epochs 1 and 3 as well, with the caveats that (1) if there are real variations in the centroid velocity during the intensive phase of the campaign these are upper limits on the random uncertainties and (2) this does not account for any systematic errors that may be associated with the measurements. The radial decelerations listed in Table 1, , assume a constant decrease in velocity between epochs. Uncertainties in these values were derived by propagating the errors associated with the radial velocities. The average deceleration between epochs 2 and 3 was 2.2 0.6 times greater than in the interval between epochs 1 and 2. N V shows some evidence for smaller velocity shifts than the other lines; however, formally, the decelerations are equal within the 1 uncertainties. No radial velocity variations were detected in kinematic components 2 – 4 within the uncertainties in the measurements ( 10–20 km s-1). Interestingly, only the component with the highest outflow velocity is observed to be decelerating.
While a full treatment of the other absorption properties, i.e., absorption strengths, widths, and covering factors, will be given in a later study (Gabel et al., in preparation), we briefly describe results here that have implications for the interpretation of the radial velocity shift. First, we note that although there were some variations in the absorption strengths and widths during the monitoring campaign, there were no large-scale changes in the three epochs that would indicate we are seeing different components appearing and disappearing to mimic a shift in velocity (although we may be seeing different regions of a continuous flow moving across our line of sight, as discussed in §3.3). This is evident from the overall similarity in the absorption spectra in Figure 2, which shows the profiles for each line in each of the three epochs. There were moderate variations in the component 1 line widths during the STIS observations, but these variations were complex; each line varied differently and there were no apparent correlations with radial velocity ( are listed in Table 1). For example, Figure 2 shows the mean C IV width in epoch 2 (150 km s-1) is narrower than in epochs 1 and 3 (203 and 194 15 km s-1, respectively), however the width varied between 115 – 190 km s-1 during the epoch 2 observations, on much shorter timescales than the radial velocity shifts. Furthermore, Table 1 shows the N V widths were not correlated with C IV. On the other hand, the C IV profile in the 1995 GHRS spectrum is much broader (500 50 km s-1) than during the STIS observations, as seen in Figure 1 in Kraemer et al. (2001b). Given the five year separation between the GHRS and STIS observations and the dramatic difference in the profiles, we cannot rule out that the absorption in the GHRS spectrum is unrelated to that observed with STIS; however, if it is, it indicates a significant evolution of the absorber’s structure over this interval. There were no detectable changes in the line-of-sight covering factors in the component 1 absorption lines. This provides constraints on the evolution of the absorption/emission geometry between the three epochs. Finally, we note there is evidence that the UV absorption in component 1 is comprised of at least two subcomponents with different ionization structures. This was initially suggested by Kraemer et al. (2001b) from photoionization modeling of the first STIS spectrum. Also, the Si IV covering factor in component 1 was found to be smaller than that of at least H I and N V (Paper II). Since all lines exhibit the velocity shift, this indicates both subcomponents are decreasing in outflow velocity.
3 Interpretation of Decreasing Radial Velocity
3.1 Deceleration of the Outflow?
One possible explanation for the observed decrease in radial velocity is that the absorber is undergoing a bulk radial deceleration. We first consider gravity as the source of the required inward radial force. The simplest case, gravitational deceleration of a ballistically ejected absorber, is excluded by the increased deceleration detected in the second interval (see Table 1), since the radial distance between the absorber and central mass has increased between epochs (by 31015 cm). This requires the presence of an outward radial force that has decreased relative to gravity between the two intervals. Since the other kinematic components in NGC 3783 are not decelerating, this adds the further requirement that the nature of the radial forces for these components differs from those of component 1, e.g., they may have reached sufficient distances from the central mass that they are near terminal velocity. Using the average deceleration over the second interval listed in Table 1 and the black hole mass for NGC 3783 (9106 M☉; Onken & Peterson, 2002), the absorber would be 91016 cm from the central mass if gravity is the decelerating force (the upper limit is for a negligible outward force during this interval).
An alternate decelerating mechanism could be an interaction of the absorber with other gas in the vicinity of the AGN. This has been invoked to explain observations of deceleration in the narrow line region (NLR) gas in several Seyfert galaxies because the onset of deceleration in these objects is at distances well beyond the gravitational influence of the central mass (Crenshaw & Kraemer, 2000; Crenshaw et al., 2000a; Ruiz et al., 2001). In the context of intrinsic absorbers, this could be the signature of an interaction between different phases in the outflow, as predicted in many dynamical models (e.g., Begelman et al., 1991; Krolik & Kriss, 2001; Everett, 2003). The hydrodynamic drag force is proportional to , where is the difference in velocity between the absorber and the ambient medium, is the density of the ambient medium, and is the column density of the absorber (Begelman et al., 1991). In this framework, a twofold increase in is required in the second interval to account for the observed increased deceleration. However, a potential problem for this model is the absence of any signatures of the interaction in the absorption spectrum. The deceleration of the NGC 3783 absorber is much greater than that observed in the NLR gas, requiring a drag force (per unit mass) that is four orders of magnitude greater ( 0.05 cm s-2). Changes in the ionization structure appear in the decelerating region of the NLR gas, presumably due to shocks (Kraemer & Crenshaw, 2000; Cecil et al., 2002), whereas no such changes are detected in the absorption spectrum in NGC 3783, as discussed above.
A third possible mechanism is deceleration of the outflow due to mass loading. In this scenario, additional mass is swept up by a momentum conserving flow, resulting in a decreased outflow velocity. This is believed to be the dominant effect in the deceleration of supernova remnants (e.g., Dyson et al., 2002, and references therein). As an example of how an outflow’s mass could be increased, we note the dynamical models of Everett (2003) predict material from the accretion disk is continually lifted by a disk-driven wind and added to the flow. Since the deceleration will depend on the rate of increase in the flow’s mass, the increased deceleration observed in the second interval requires that mass was accumulated more rapidly than during the first interval.
3.2 Directional Shift in the Outflow?
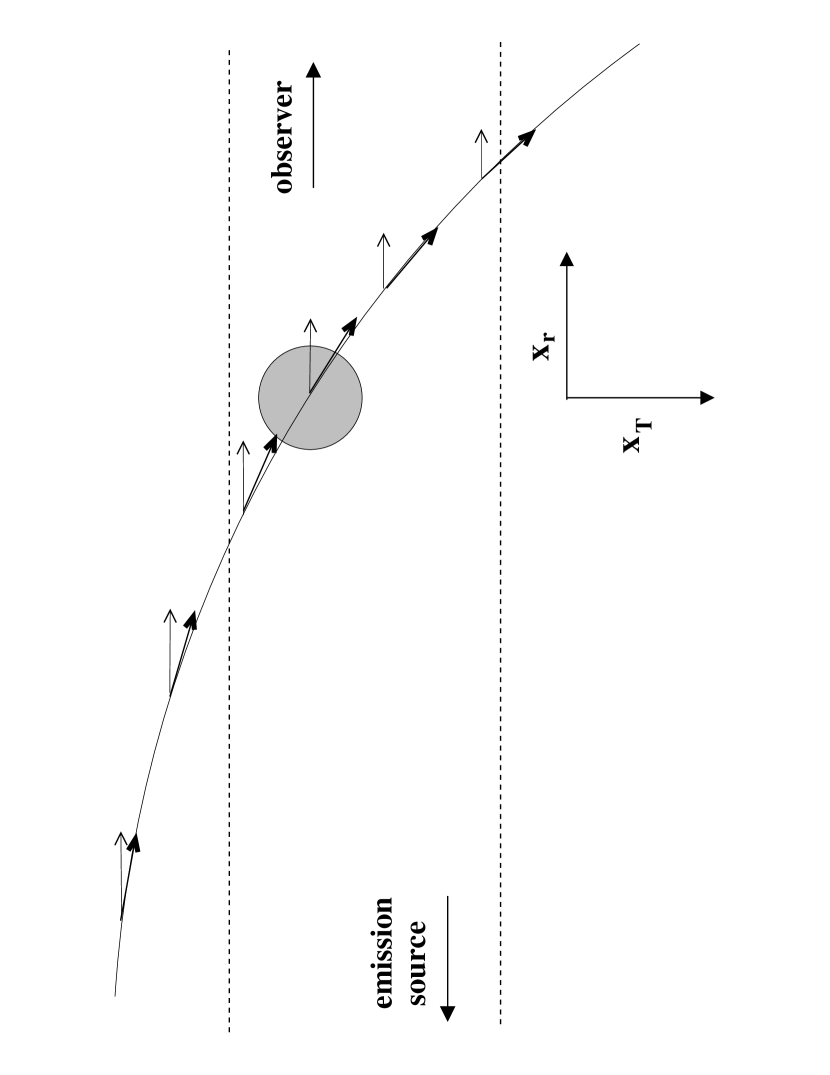
Another interpretation of the observed decrease in blueshifted radial velocity is that, rather than a bulk radial deceleration as described above, we are seeing a change in the radial component of the velocity vector with respect to our line of sight to the AGN. Figure 3 illustrates this schematically, depicting the absorber as a cloud moving along a curved path across our sight line to the background emission source. In this simple model, the velocity of the cloud, represented with thick filled arrows in Figure 3, has a constant amplitude along the trajectory, but the component that is directed radially in our line of sight (open arrows in the direction) decreases due to the changing direction of the motion. The absorber occults 30% of the BLR (Paper II), which is demarcated with dashed lines in Figure 3.
The transverse component of motion of the absorber (i.e., along in Figure 3) is an integral part of this model, leading to the motion of the absorber into and eventually out of our view. A rough lower limit on the transverse velocity can be derived using the transverse size of the absorber (11016 cm; Paper II) and an upper limit on the time required for the absorber to move into our line of sight. As a conservative estimate of the latter, we use the interval between the 1994 January GHRS observation and the first STIS observation, since it is uncertain whether the absorption in the 1995 April GHRS spectrum is from the same absorber as that in the STIS data (see discussion in §2). The result is 542 km s-1, which, in combination with the transverse size of the BLR (1.91016 cm; Onken & Peterson, 2002), gives a rough upper limit on the total time that some portion of the absorber will occult the BLR, 17 yrs. This is strictly an upper limit since (a) we have only an upper limit on the interval over which the absorption appeared and (b) is increasing, as illustrated in Figure 3. Since the continuum source is certainly much smaller than the BLR, at some point in the absorber’s path it will no longer occult the continuum source but will still occult the same fraction of the BLR (see Paper II for a full discussion of the covering factors). Thus, this model predicts the covering factors, and therefore absorption depths, could change substantially at a later epoch, depending on the specific geometry of the BLR and continuum sources. Since the covering factor was not observed to change between the three epochs in our STIS campaign as described in §2, this implies the absorber has not yet moved out of our line of sight to the continuum source. We note that the rate of change in radial velocity will be determined by the curvature of the absorber’s trajectory and will not necessarily be constant. This may provide a natural explanation for the more rapid decrease in radial velocity observed in the second interval of the observations.
A number of mechanisms could produce the curved motion depicted in Figure 3. For example, models positing the absorber is driven off the accretion disk by radiation pressure from the central source (e.g., Murray et al., 1995; Proga et al., 2000) or by centrifugal forces along magnetic field lines in the disk (e.g., Blandford & Payne, 1982; Bottorff et al., 2000; Everett, 2003) all predict the outflow will follow a curved trajectory above the disk, exhibiting a changing angle with respect to the perpendicular to the disk. Additionally, these models predict the outflow’s path will be helical due to rotation about the central mass, and thus its motion will be curved in the plane parallel to the disk.
3.3 Evolution of a Continuous Flow?
If the component 1 absorber is a continuous outflow, the centroid velocity could vary due to the motion of different regions of the flow across our line of sight to the emission source. In this scenario, the absorber could be either a continuous stream of gas or a continuous “spray” of small clouds. An example is shown in Figure 4, in which a collimated flow, dileneated with thick solid lines, intersects our line of sight to the emission source obliquely. The mean angle of intersection in the flow, , determines the centroid radial velocity. Due to its finite opening angle, , the flow spans a range of projected radial velocities, giving the observed width of the absorption feature, . Two epochs are depicted in Figure 4, showing how changes in the flow geometry lead to variations in the absorption kinematics. Centroid velocity variations could be produced by either an overall change in the flow’s direction or inhomogeneities in the flow within a given opening angle that result in a change in . In constrast to the models discussed in the previous sections, the observed velocity shift is due to the motion of different gas elements, with different projected radial velocities, into our line of sight rather than the change in speed or direction of motion of any given gas element.
4 Conclusions
STIS spectra obtained as part of our monitoring campaign of NGC 3783 reveal a decreasing blueshifted radial velocity in one of its intrinsic absorption components. This is the first detection of a variable radial velocity in an outflow associated with a Seyfert galaxy. In two intervals separated by 13 and 9 months, the absorption lines in the kinematic component with highest outflow velocity exhibited mean redward velocity shifts of 35 and 55 km s-1, respectively. The rate of decrease in the second interval was twice as large as in the first. The absorption widths in this component varied moderately during these observations. These variations were complex, fluctuating on short timescales compared to the velocity shifts and showing no apparent correlation with the variations in radial velocity. No variations in absorption velocities were detected in the other kinematic components.
We have explored various interpretations of the observed velocity shift. The similarity in spectra at all epochs indicates it is not due to changes in the relative strengths of multiple subcomponents, and it thus represents a bona fide decrease in radial velocity. If it represents bulk deceleration due to a decrease in radial speed, we consider gravity, interaction with an ambient medium, and mass loading as possible deceleration mechanisms and derive special requirements on the nature of the radial forces. Alternatively, it could be due to a directional shift in the motion of the absorber with respect to our line of sight to the background emission sources, or a result of different regions in a continuous flow crossing our sightline.
J. R. G., D. M. C., and S. B. K. acknowledge support from NASA grant HST-GO-08606.13-A. W.N.B acknowledges CXC grant GO1-2103 and NASA LTSA grant NAG5-13035. F.H. acknowledges NSF grant AST 99-84040. We thank the anonymous referee for very helpful comments.
References
- Barlow (1993) Barlow, T. A. 1993, Ph.D. thesis Univ. of California at San Diego
- Begelman et al. (1991) Begelman, M. C. de Kool, M., & Sikora, M. 1991, ApJ, 382, 416
- Blandford & Payne (1982) Blandford, R. D., & Payne, D. G. 1982, MNRAS, 199, 883
- Bottorff et al. (2000) Bottorff, M. C., Korista, K. T., & Shlosman, I. 2000, ApJ, 537, 134
- Castor et al. (1976) Castor, J. I., Abbott, D. C., & Klein, R. I. 1976, ApJ, 195, 157
- Cecil et al. (2002) Cecil, G., Doptia, M. A., Groves, B., Wilson, A. S., Ferruit, P., Pecontal, E., & Binette, L. 2002, ApJ, 568, 627
- Crenshaw et al. (1999) Crenshaw, D. M., Kraemer, S. B., Boggess, A., Maran, S. P., Mushotzky, R. F., & Wu, C.-C. 1999, ApJ, 516, 750
- Crenshaw & Kraemer (2000) Crenshaw, D. M., & Kraemer, S. B. 2000, ApJ, 532, L101
- Crenshaw et al. (2000a) Crenshaw, D. M., et al. 2000a, ApJ, 545, L27
- Crenshaw et al. (2000b) Crenshaw, D. M., et al. 2000b, AJ, 120, 1731
- Crenshaw et al. (2003) Crenshaw, D. M., et al. 2003, ApJ, in press
- de Vaucouleurs et al. (1991) de Vaucouleurs, G., de Vaucouleurs, A., Corwin, H. G., Buta, R. J., Paturel, G., & Fouque, P. 1991 Third Reference Catalogue of Bright Galaxies (Springer-Verlag: New York)
- Dyson et al. (2002) Dyson, J. E., Arthur, S. J., & Hartquist, T. W. 2002, A&A, 390, 1063
- Everett (2003) Everett, J. E. 2003, ApJ, in press, astro-ph/0212421
- Foltz et al. (1987) Foltz, C. B., Weymann, R. J., Morris, S. L., & Turnshek, D. A. 1987, ApJ, 317, 450
- Gabel et al. (2003) Gabel, J. R., et al. 2003, ApJ, 583, 178 (Paper II)
- Hamann et al. (1997) Hamann, F., Barlow, T. A., Cohen, R. D., Junkkarinen, V., & Burbidge, E. M. 1997, in ASP Conf. Ser. 128, Mass Ejection from Active Galactic Nuclei, ed. N. Arav, I. Shlosman, & R. J. Weymann (San Francisco: ASP), 19
- Kaspi et al. (2002) Kaspi, S., et al. 2002, ApJ, 574, 643 (Paper I)
- Kraemer & Crenshaw (2000) Kraemer, S. B. & Crenshaw, D. M. 2000, ApJ, 544, 763
- Kraemer et al. (2001a) Kraemer, S. B., et al. 2001a, ApJ, 551, 671
- Kraemer et al. (2001b) Kraemer, S. B., Crenshaw, D. M., Gabel J. R. 2001b, ApJ, 557, 30
- Kraemer et al. (2002) Kraemer, S. B., et al. 2002, ApJ, 577, 98
- Kriss (2002) Kriss, G. A. 2002, in ASP Conf. Ser. 255, Mass Outflow in Active Galactic Nuclei: New Perspectives, ed. D. M. Crenshaw, S. B. Kraemer, & I. M. George (San Francisco: ASP), 69
- Krolik & Kriss (2001) Krolik, J. H. & Kriss, G. A. 2001, ApJ, 561, 684
- Maran et al. (1996) Maran, S. P., Crenshaw, D. M., Mushotzky, R. F., Reichert, G. A., Carpenter, K. G., Smith, A. M., Hutchings, J. B., & Weymann, R. J. 1996, ApJ, 465, 733
- Mathur et al. (1995) Mathur, S., Elvis, M. & Wilkes, B. 1995, ApJ, 452, 230
- Murray et al. (1995) Murray, N., Chiang, J., Grossman, S. A., & Voit, G. M. 1995, ApJ, 451, 498
- Onken & Peterson (2002) Onken, C. A., & Peterson, B. M. 2002, ApJ, 572, 746
- Proga et al. (2000) Proga, D. Stone, J. M., & Kallman, T. R. 2000, ApJ, 543, 686
- Reynolds (1997) Reynolds, C. S. 1997, MNRAS, 286, 513
- Ruiz et al. (2001) Ruiz, J. R., et al. 2001, AJ, 122, 2961
- Vilkoviskij & Irwin (2001) Vilkoviskij, E. Y., & Irwin, M. J. 2001, MNRAS, 321, 4
- Weymann et al. (1997) Weymann, R. J., Morris, S. L., Gray, M. E., & Hutchings, J. B. 1997, ApJ, 483, 717
- Weymann (2002) Weymann, R. J. 2002, in ASP Conf. Ser. 255, Mass Outflow in Active Galactic Nuclei: New Perspectives, ed. D. M. Crenshaw, S. B. Kraemer, & I. M. George (San Francisco: ASP), 329
| Epoch | Julian Date | N V | C IV | Si IVaaAverage values for the two lines of the Si IV doublet. | ||||||
|---|---|---|---|---|---|---|---|---|---|---|
| bbCentroid velocity of component 1 relative to the systemic velocity. | ccAverage radial deceleration since previous epoch. | bbCentroid velocity of component 1 relative to the systemic velocity. | ccAverage radial deceleration since previous epoch. | bbCentroid velocity of component 1 relative to the systemic velocity. | ccAverage radial deceleration since previous epoch. | |||||
| (2,450,000 +) | (km s-1) | (10-6 km s-2) | (km s-1) | (km s-1) | (10-6 km s-2) | (km s-1) | (km s-1) | (10-6 km s-2) | (km s-1) | |
| 1 | 1602 | 13344 | 21215 | 13528 | 20315 | 137413 | 17525 | |||
| 2dd and are mean values and are range of values measured during intensive phase of monitoring. | 1966–2023 | 13074 | 0.80.2 | 140–212 | 13188 | 1.00.3 | 115–190 | 133313 | 1.20.5 | 100–145 |
| 3 | 2281 | 12614 | 1.80.3 | 15015 | 12568 | 2.50.5 | 19415 | 128013 | 2.20.8 | 14025 |